
One-step to Cluster and Visualize Gene Expression Matrix
ClusterGVis
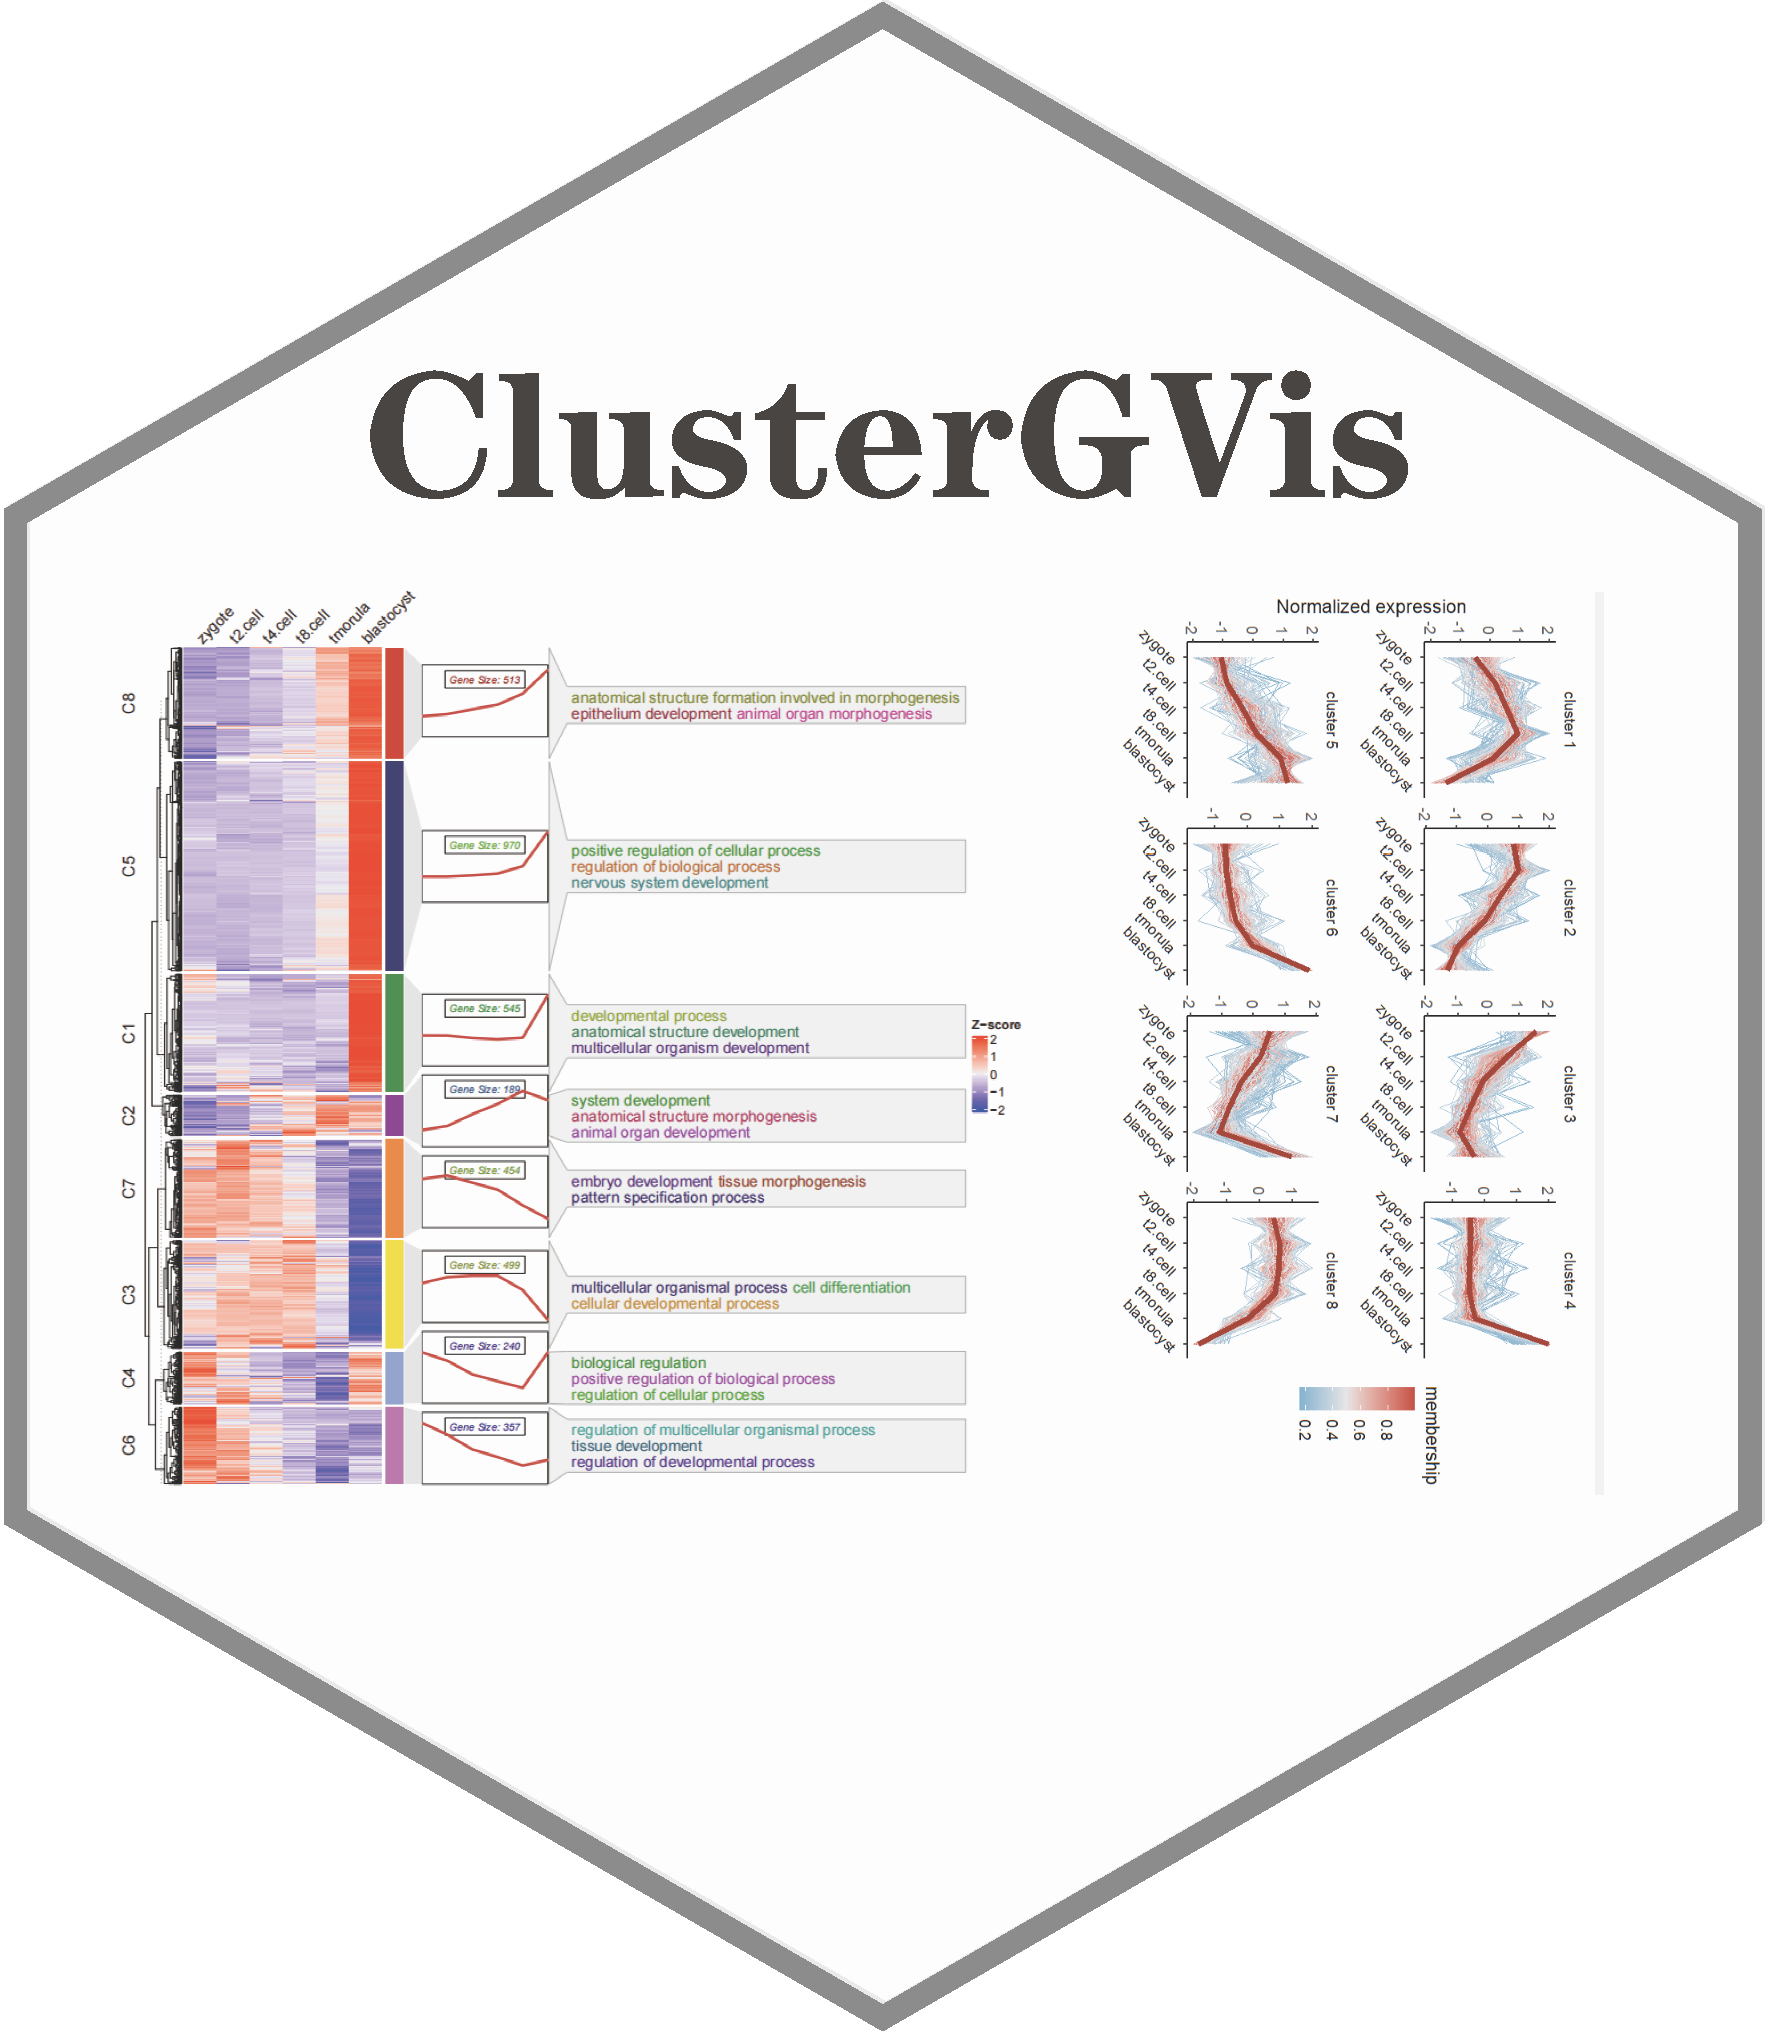
To enhance clustering and visualization of time-series gene expression data from RNA-Seq experiments, we present the ClusterGVis package. This tool enables concise and elegant analysis of time-series gene expression data in a simple, one-step operation. Additionally, you can perform enrichment analysis for each cluster using the enrichCluster function, which integrates seamlessly with clusterProfiler. ClusterGVis empowers you to create publication-quality visualizations with ease.
Thanks for the contributions for clusterProfiler and ComplexHeatmap!

Installation
You can install the development version of ClusterGVis like so:
r
Note: please update your ComplexHeatmap to the latest version!
install.packages("devtools")
devtools::install_github("junjunlab/ClusterGVis")
Citation
ClusterGVis: An Advanced Visualization and Clustering Tool for Gene Expression Analysis
Documentation
The comprehensive documentation: https://junjunlab.github.io/ClusterGvis-manual/
Interactive web App
https://github.com/junjunlab/ClusterGvis-app
Related blogs
- ClusterGVis 对基因表达时间序列聚类和可视化
- ClusterGVis 的问题解答及优化
- ClusterGVis 对指定 cluster 添加注释
- ClusterGVis 继续查缺补漏
- ClusterGVis 添加多个样本注释
- bugs 报告和修复
- ClusterGVis 对接单细胞啦
- 听说你还想添加 KEGG 注释?
- ClusterGVis 对接 monocle2 拟时序热图
- 听说你想画个 monocle3 的拟时序热图?
- ClusterGVis 添加自定义图形注释
- 听说你想插入 GO 和 KEGG 图形注释?
- enrichCluster 关于非模式物种富集分析的使用
- 听说你想给 visCluster 添加行注释?
- ClusterGVis shiny 交互式 web 来了?


