
The home of the Jupyter notebook graph visualization widget powered by yFiles for HTML




A graph diagram visualization widget for Jupyter Notebooks and Labs powered by yFiles for HTML.
Easily visualize graphs from various sources: Networkx✅, igraph✅, neo4j✅, pygraphviz✅, and any structured Python dictionaries and lists. Many more formats supported indirectly via Networkx imports!
The widget is supported in the default Jupyter environments, but also in other environments like VS Code or Google Colab.
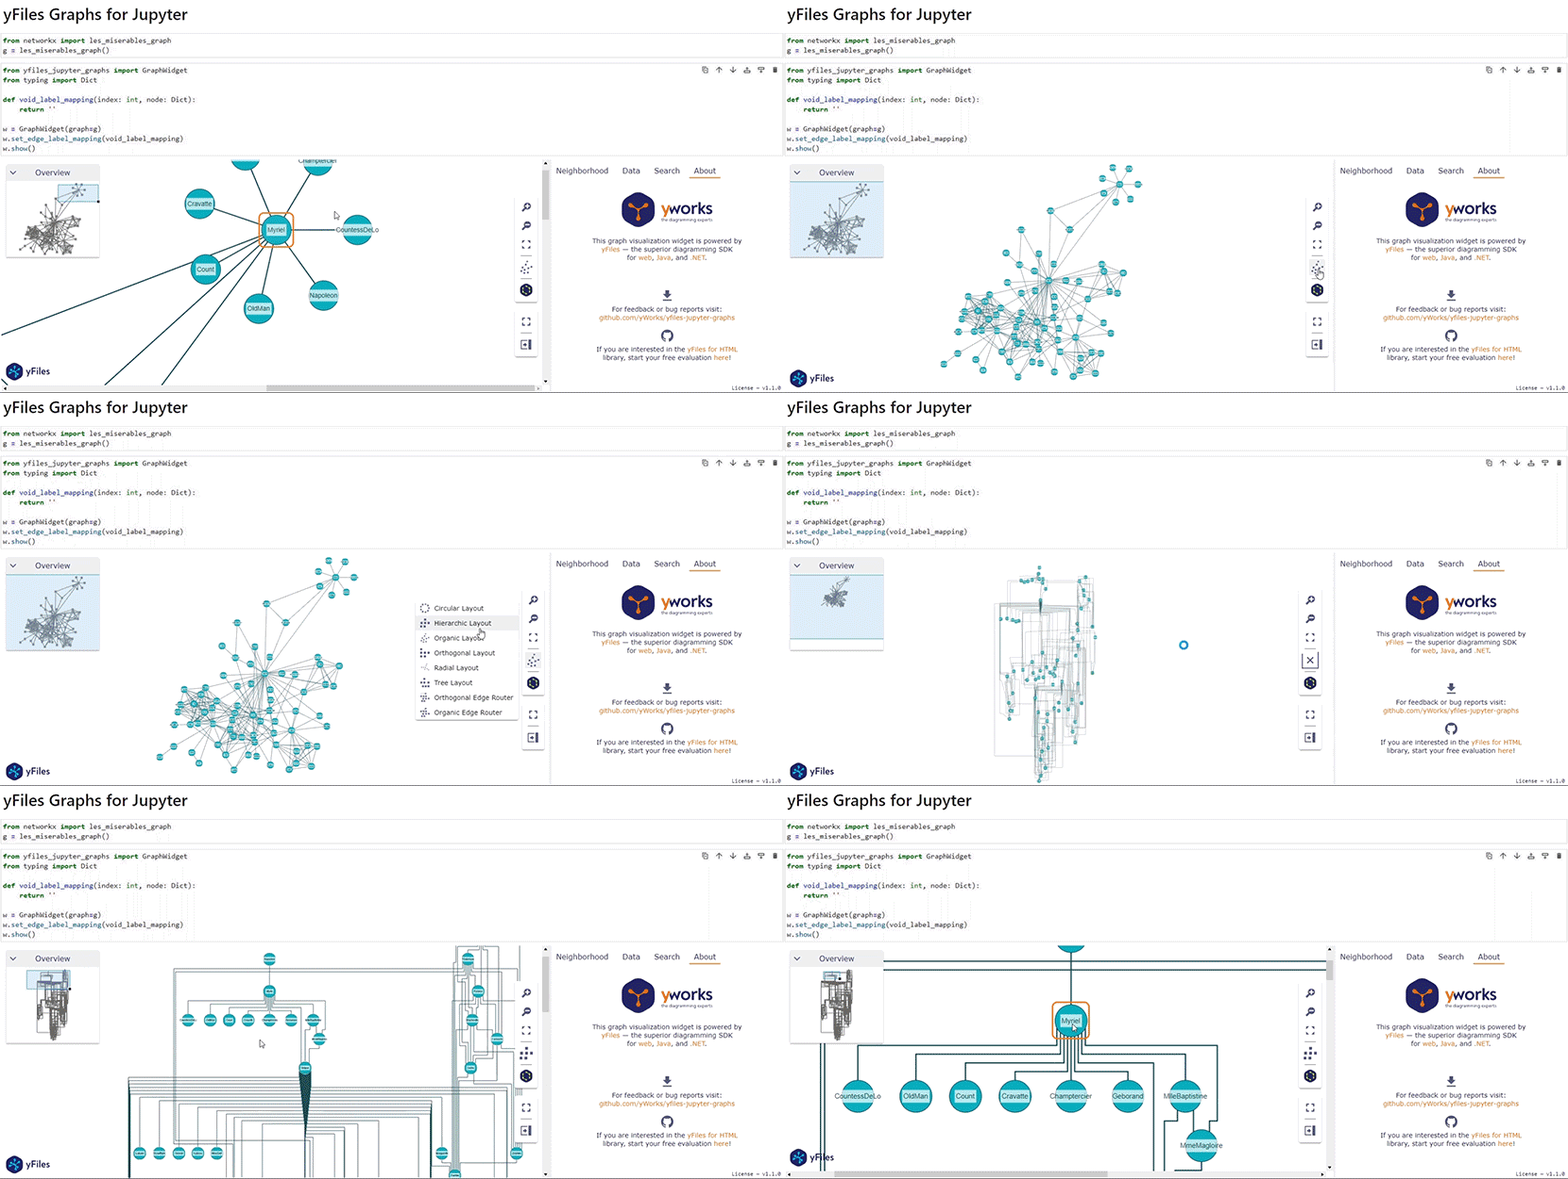
Try the Showcase notebook on Google Colab here. Or see the simple Introduction notebook.
yfiles-jupyter-graphs-for-neo4j
For working with Neo4j databases, we built yfiles-jupyter-graphs-for-neo4j, an open-source extension on top of yfiles-jupyter-graphs. This extension provides an easier Python interface for the driver and allows direct configuration of data mappings depending on the label or type of the node or relationship.
So if you are planning to use the extension with Neo4j databases, consider using yfiles-jupyter-graphs-for-neo4j.
yfiles-jupyter-graphs-for-kuzu
For working with Kuzu databases, we built yfiles-jupyter-graphs-for-kuzu, an open-source extension on top of yfiles-jupyter-graphs. This extension provides a specifically tailored API for easier and more domain specific usage in Kuzu databases (see Kuzu integration guide).
yfiles-jupyter-graphs-for-sparql
For working with RDF databases and SPARQL queries, we built yfiles-jupyter-graphs-for-sparql, an open-source extension on top of yfiles-jupyter-graphs. This extension provides a specifically tailored API for easier and more domain specific usage in RDF databases with SPARQL.
Supported Environments
- JupyterLab or Jupyter Notebook
- Visual Studio Code
- Google Colaboratory
- Google Vertex AI Workbench
- Google Dataproc
- Azure Machine Learning Studio Notebooks
- Amazon SageMaker
- Kaggle
- Just try it in your preferred platform for Jupyter notebooks
Requirements
- python >= 3.6
- jupyter notebook or lab
- ipywidgets >= 7.6.0
Installation
If you already have Jupyter installed, just pip install the prebuilt extension from the Python Package Index.
pip install yfilesjupytergraphs[!IMPORTANT]
To installyfilesjupytergraphsfrom within a Jupyter Notebook cell, use%pipinstead of!pipto ensure that it
is installed in the correct Python environment.
If you want to start clean and get a fresh new Jupyter Lab with the widget readily installed and available, you can use docker, too:
From a shell, create a docker image that contains all that is required:
mkdir yfiles-jupyter && cd yfiles-jupyter
echo -e "FROM jupyter/scipy-notebook\nRUN pip install yfiles-jupyter-graphs" > Dockerfile
docker build -t yfiles-jupyter-graphs-on-docker .
(the above has been tested successfully with scipy-notebook:lab-3.4.7 and yfiles-jupyter-graphs==1.2.1), but we want to make sure that it will also work with upcoming versions - file an issue if it doesn't work for you!)
You can then create a fresh new instance of your server from this image like so:
docker run -it -p 8888:8888 --name yfiles-jupyter yfiles-jupyter-graphs-on-dockerUsage
In a notebook which has the widget installed in the server, in a Python cell, you can then do this:
"""Execute in jupyter notebook or jupyter lab"""
from yfilesjupytergraphs import GraphWidget
shows empty widget
GraphWidget()
You can find the full documentation here.
Features
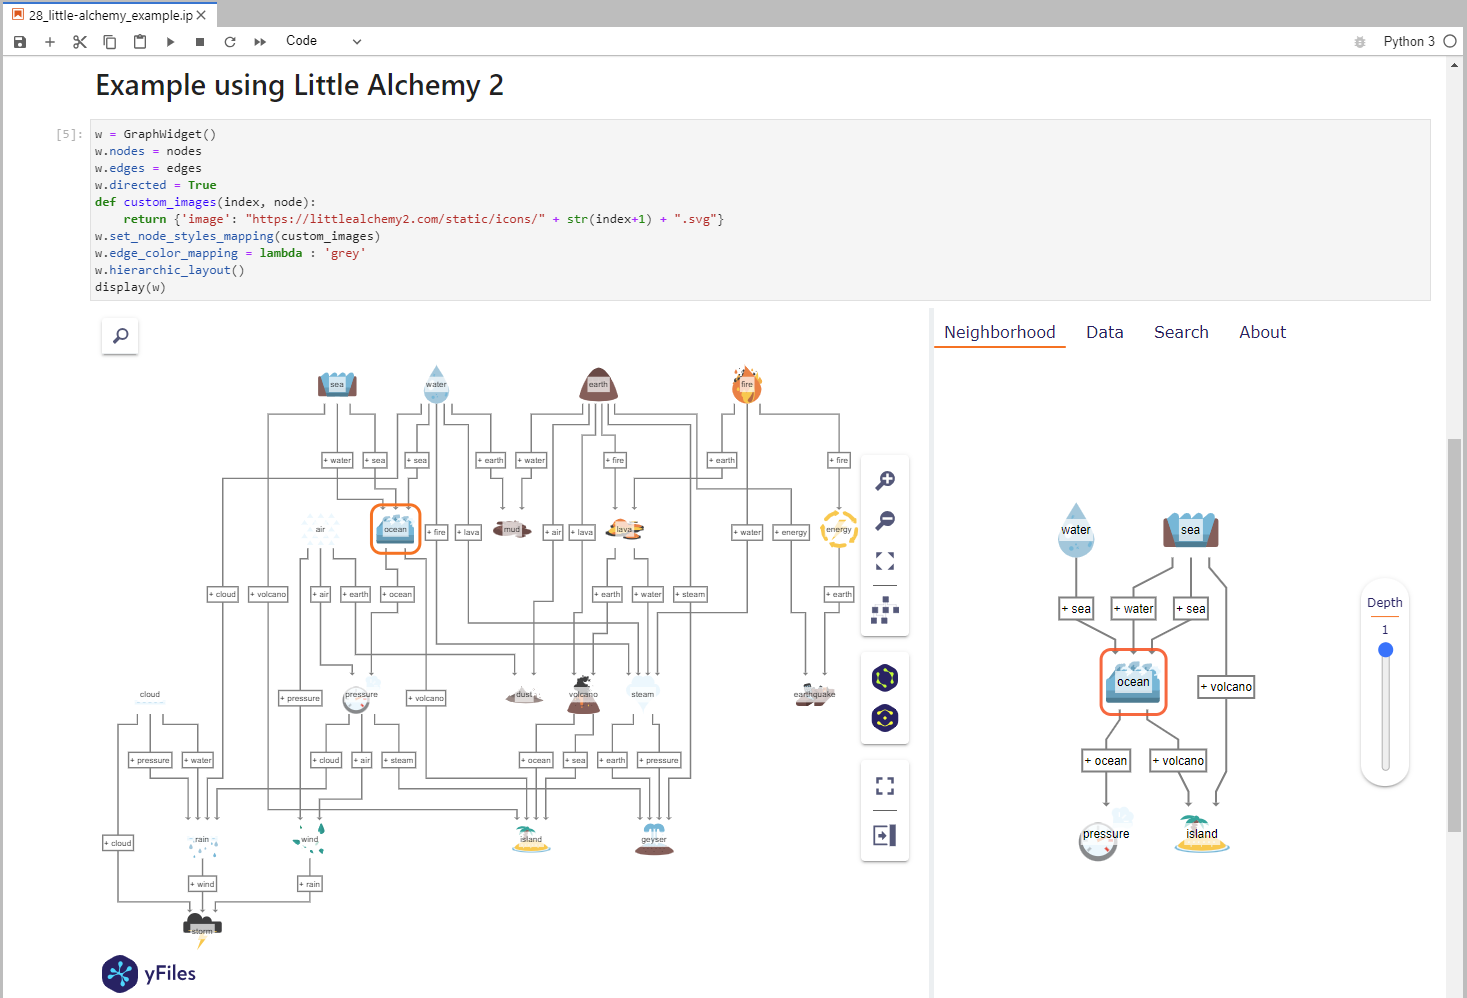

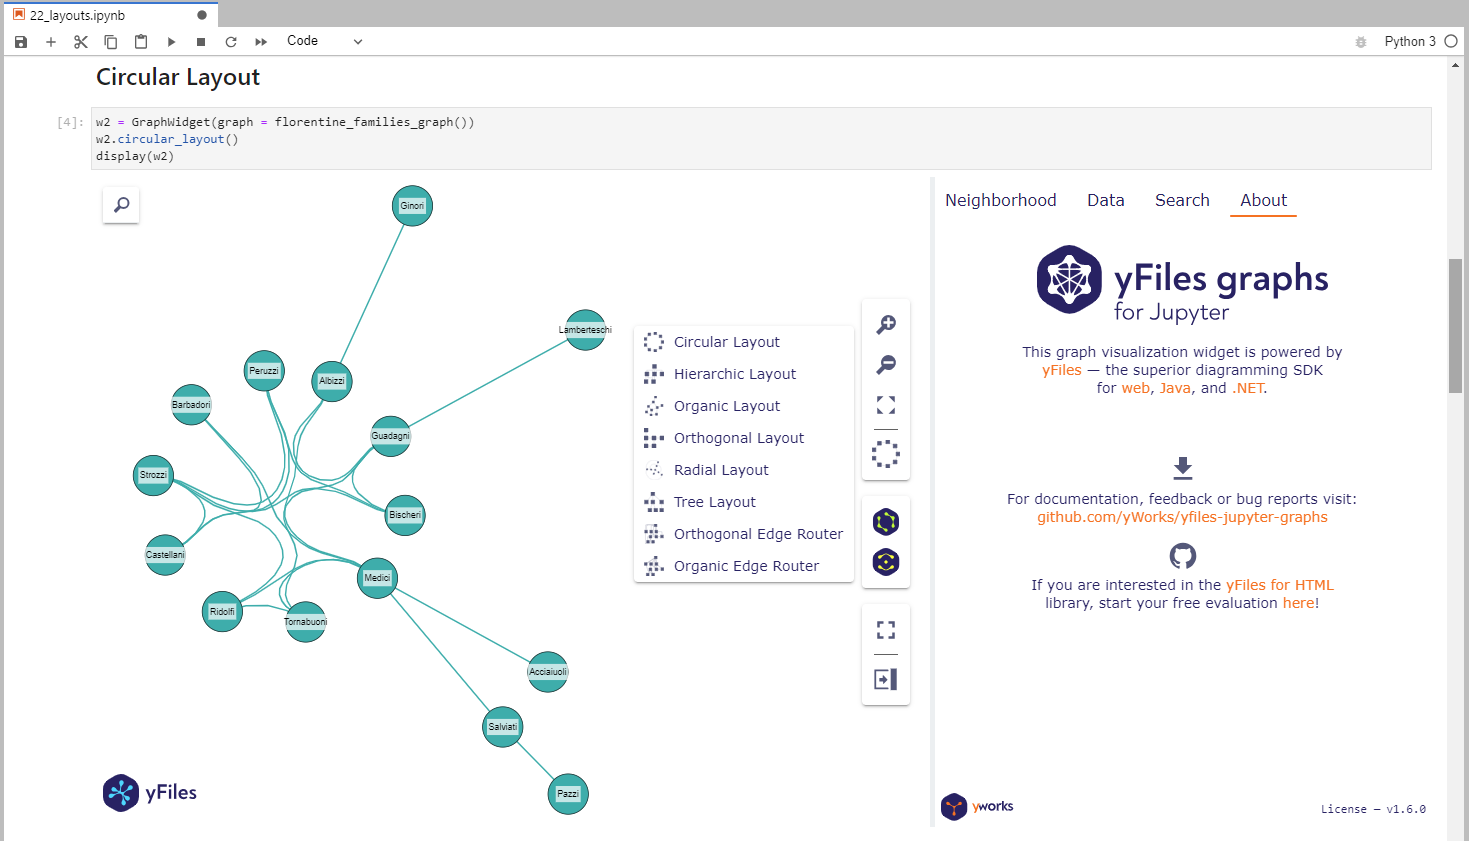
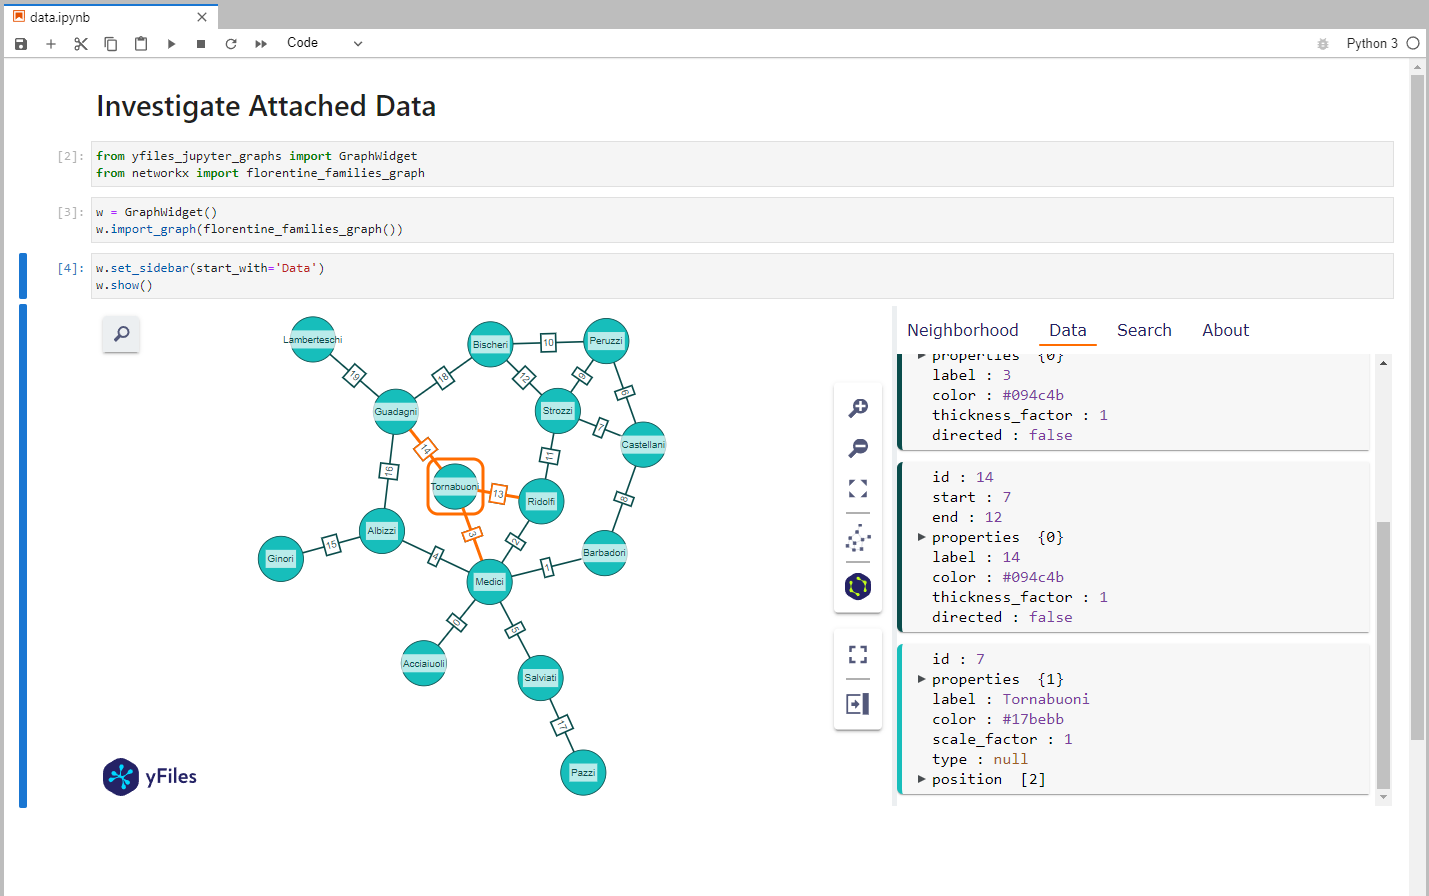
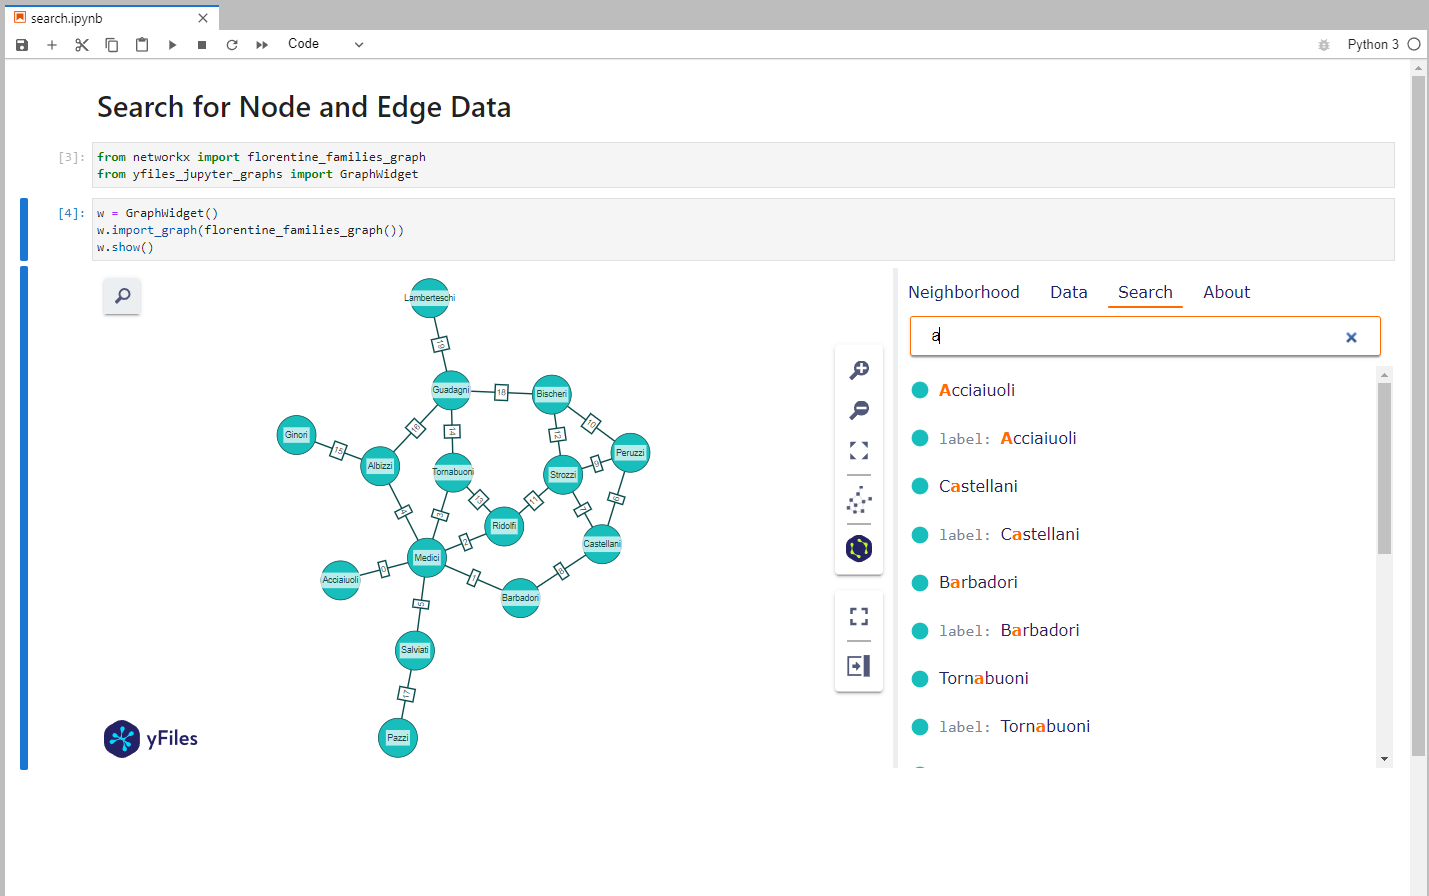
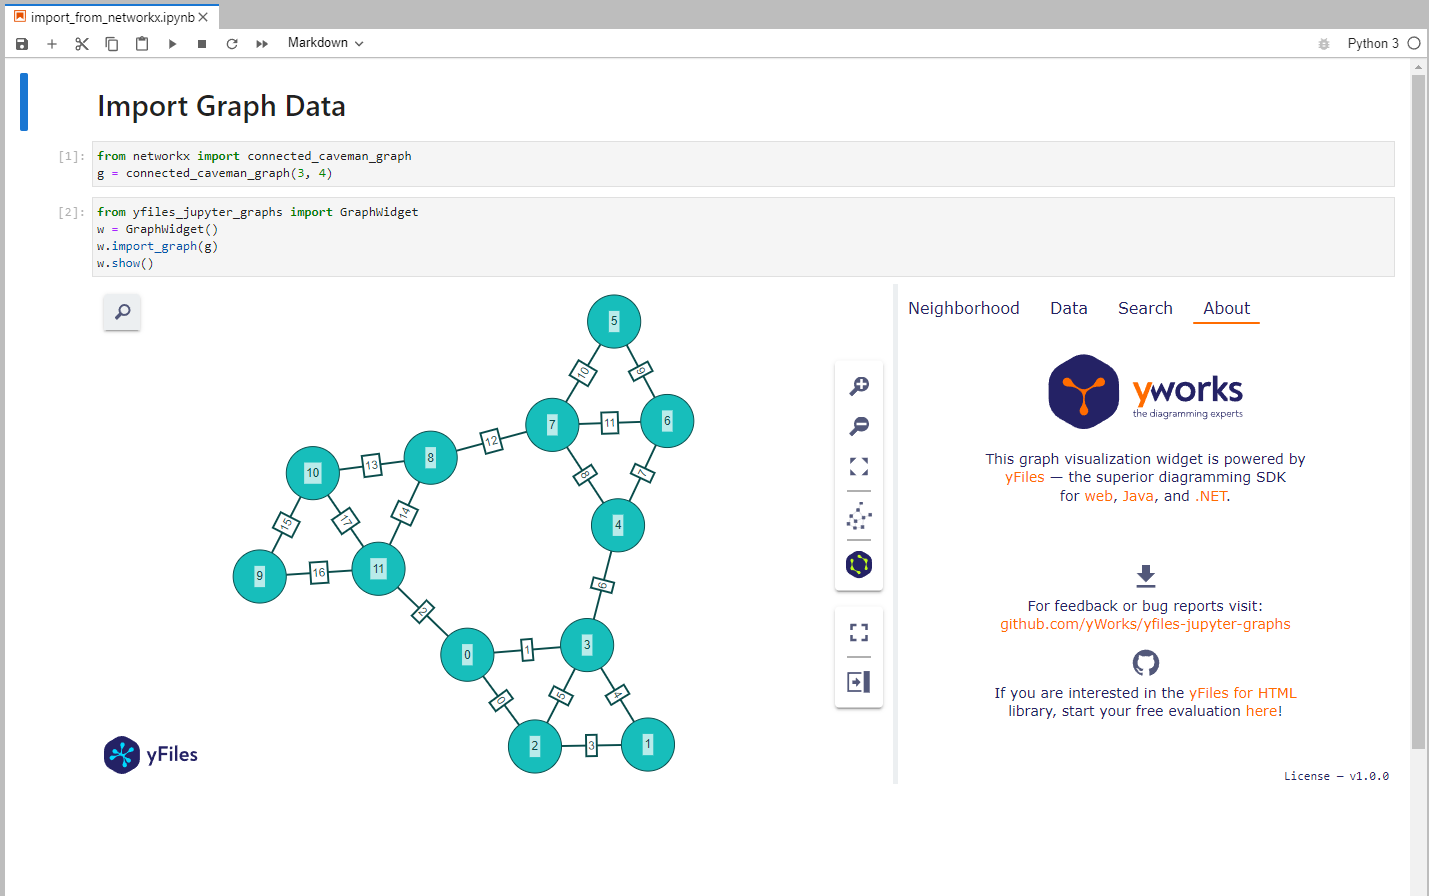

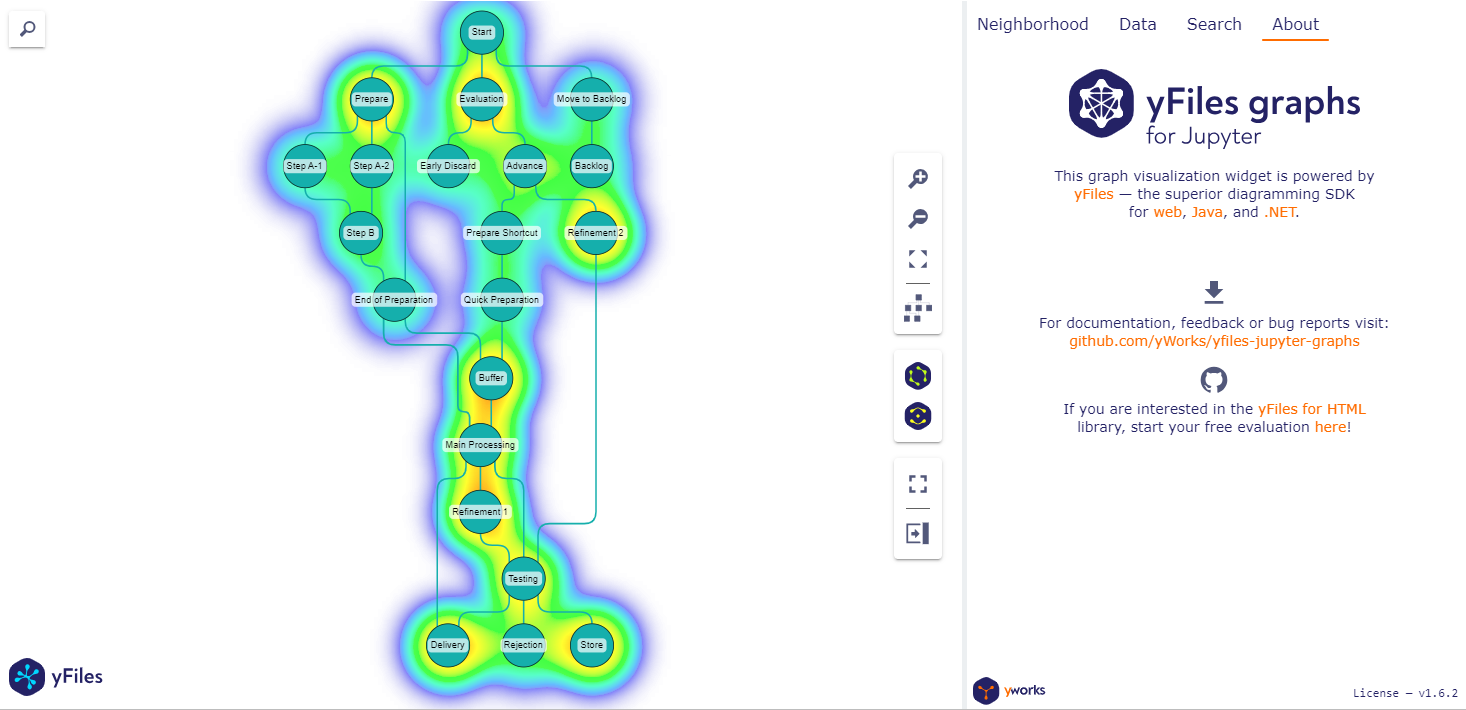
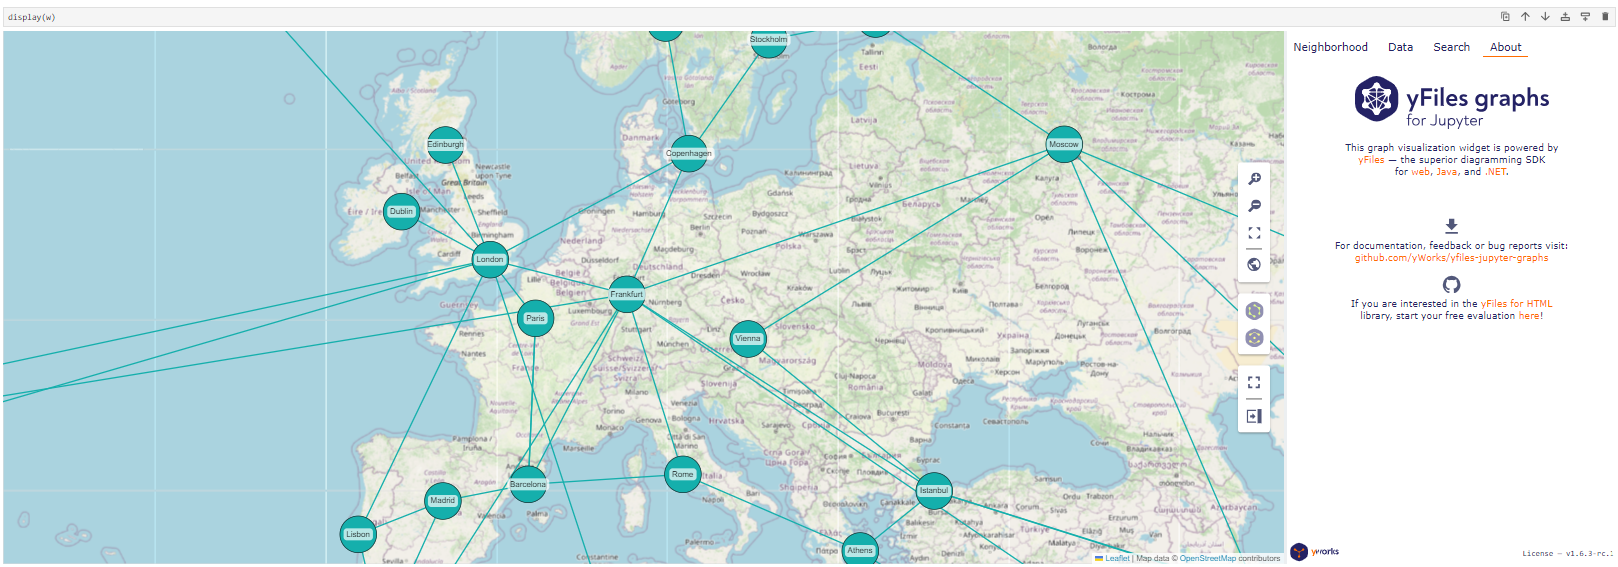
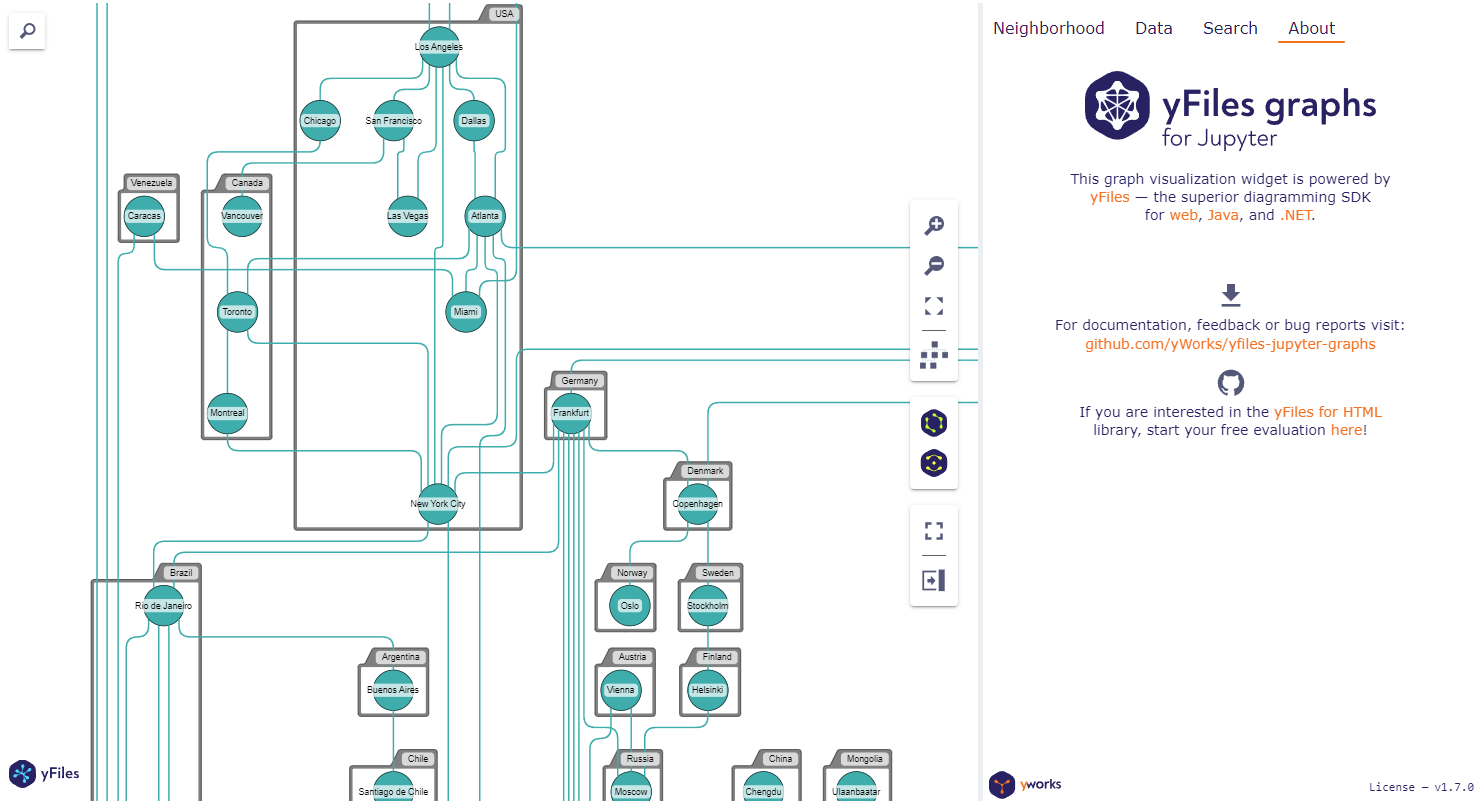
For example code look here.
Google Colab Examples
You can try the example notebooks in Google Colab by opening GitHub notebook URL:https://colab.research.google.com/github/yWorks/yfiles-jupyter-graphs/blob/main/examples/<notebook.ipynb>.
For example the Introduction notebook:
https://colab.research.google.com/github/yWorks/yfiles-jupyter-graphs/blob/main/examples/01_introduction.ipynb


