
A large (+2500) collection of colormaps and palettes for Python 🎨
PyPalettes

A dependency-free large (+2500) collection of colormaps and palettes for Python.
- All available palettes can be found in the Color Palette Finder.
- To learn more about how to use
pypalettes, please refer to the official documentation.


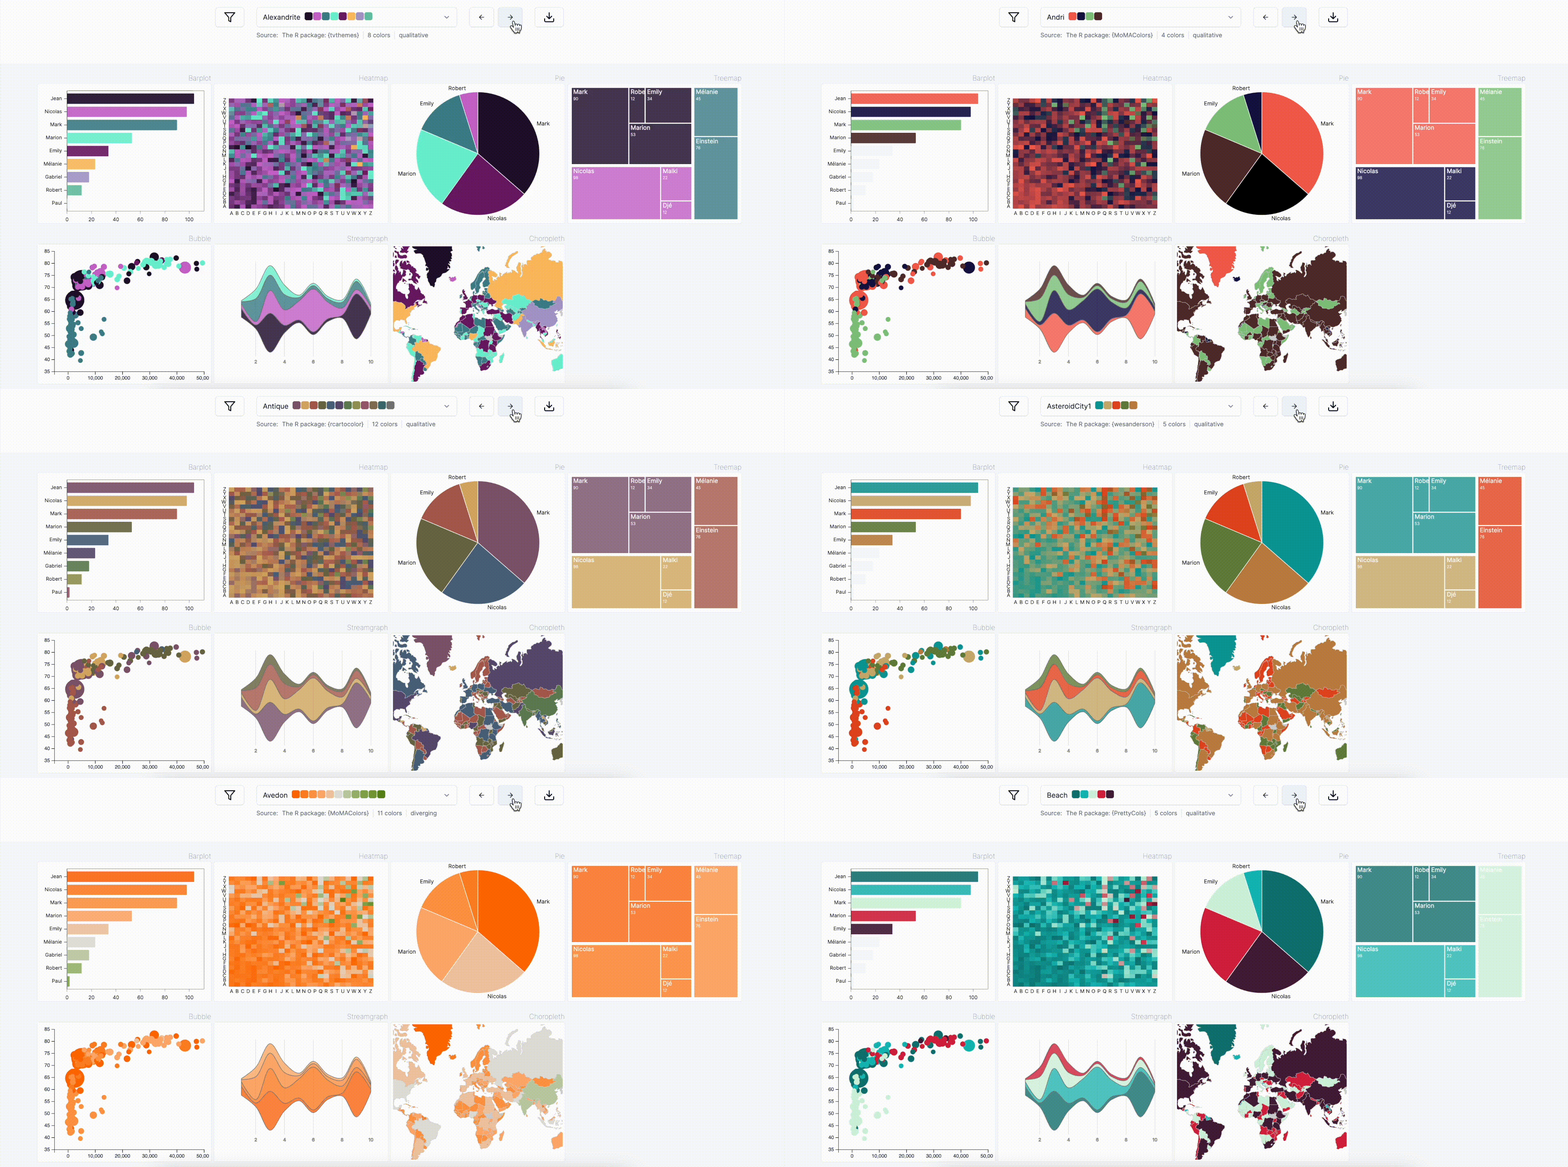
This package is based on the R package paletteer, and all associated sub-packages (with original palettes) mentioned in the LICENSE file.
Installation
With pip:
pip install pypalettesWith conda:
conda install conda-forge::pypalettesQuick start
pypalettes primarly offers 2 functions:
loadpalette("palettename"): loads a list of colors (dependency-free)loadcmap("palettename"): loads a colormap object (for matplotlib/seaborn/etc)
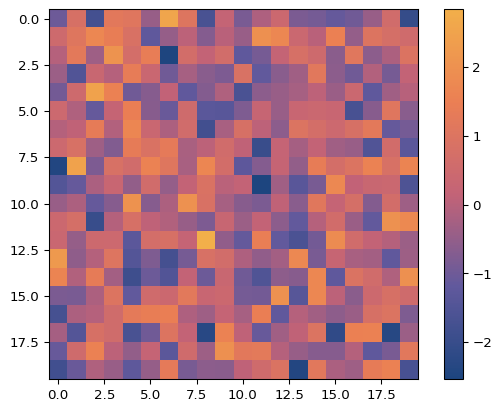
Continuous colormap for matplotlib/seaborn
import matplotlib.pyplot as plt
import numpy as np
from pypalettes import load_cmap
cmap = loadcmap("Sunset2", cmaptype="continuous")
data = np.random.randn(20, 20)
plt.imshow(data, cmap=cmap) plt.colorbar()
Categorical palette
import matplotlib.pyplot as plt
import seaborn as sns
from pypalettes import load_palette
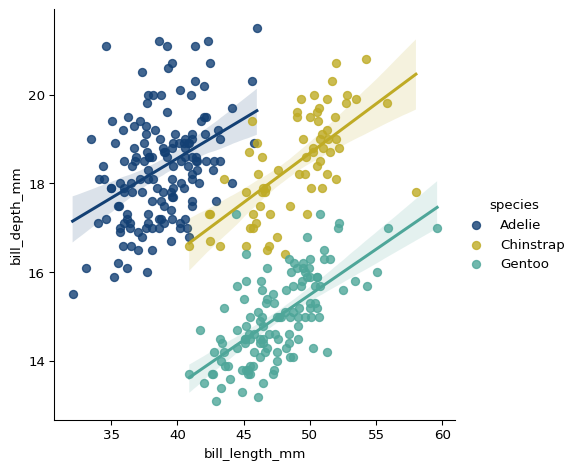
palette = load_palette("Fun")
df = sns.load_dataset("penguins")
g = sns.lmplot(     data=df,     x="billlengthmm",     y="billdepthmm",     hue="species",     palette=palette, )
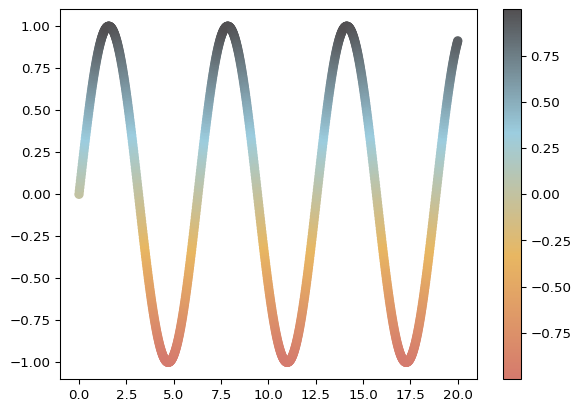
Your own colormap for matplotlib/seaborn
import matplotlib.pyplot as plt
from pypalettes import create_cmap
import numpy as np
cmap = create_cmap(     colors=["#D57A6DFF", "#E8B762FF", "#9CCDDFFF", "#525052FF"],     cmap_type="continuous", )
x = np.linspace(0, 20, 1000) y = np.sin(x)
plt.scatter(x, y, c=y, cmap=cmap) plt.colorbar()
Features
- Add +2500 native palettes to matplotlib and seaborn
- Load, customise and combine +2500 palettes
- Create your own palettes
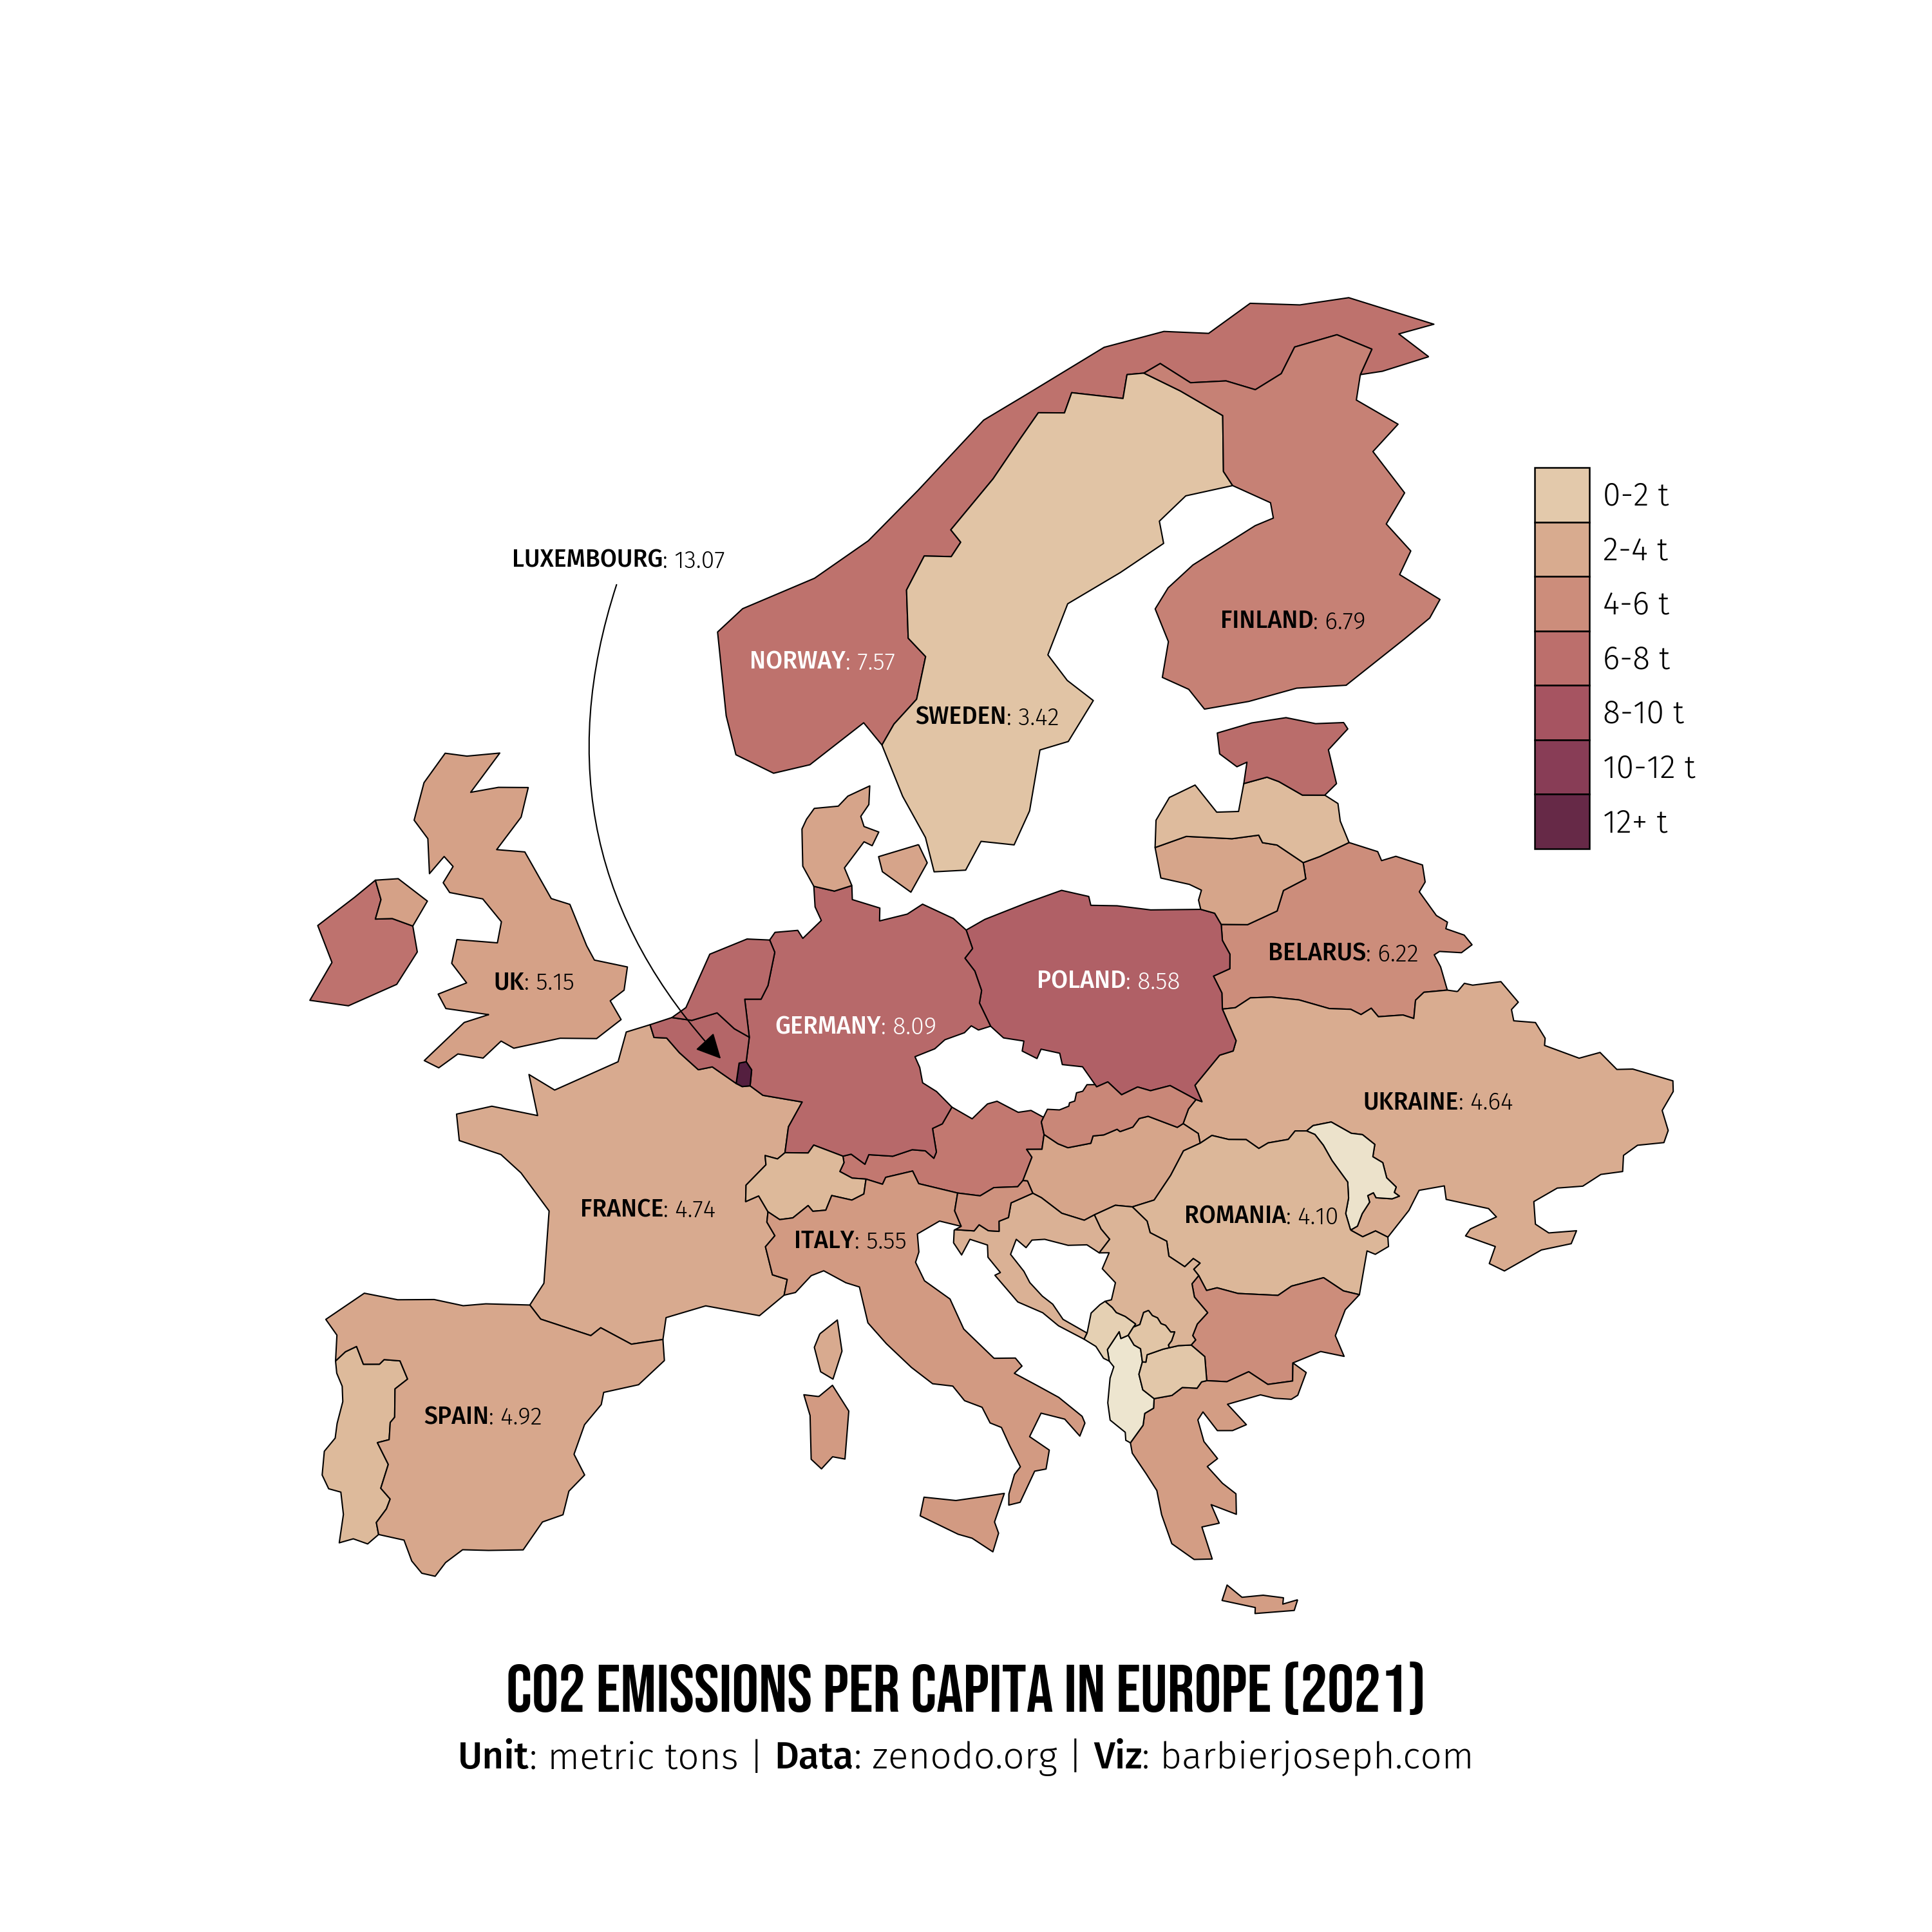
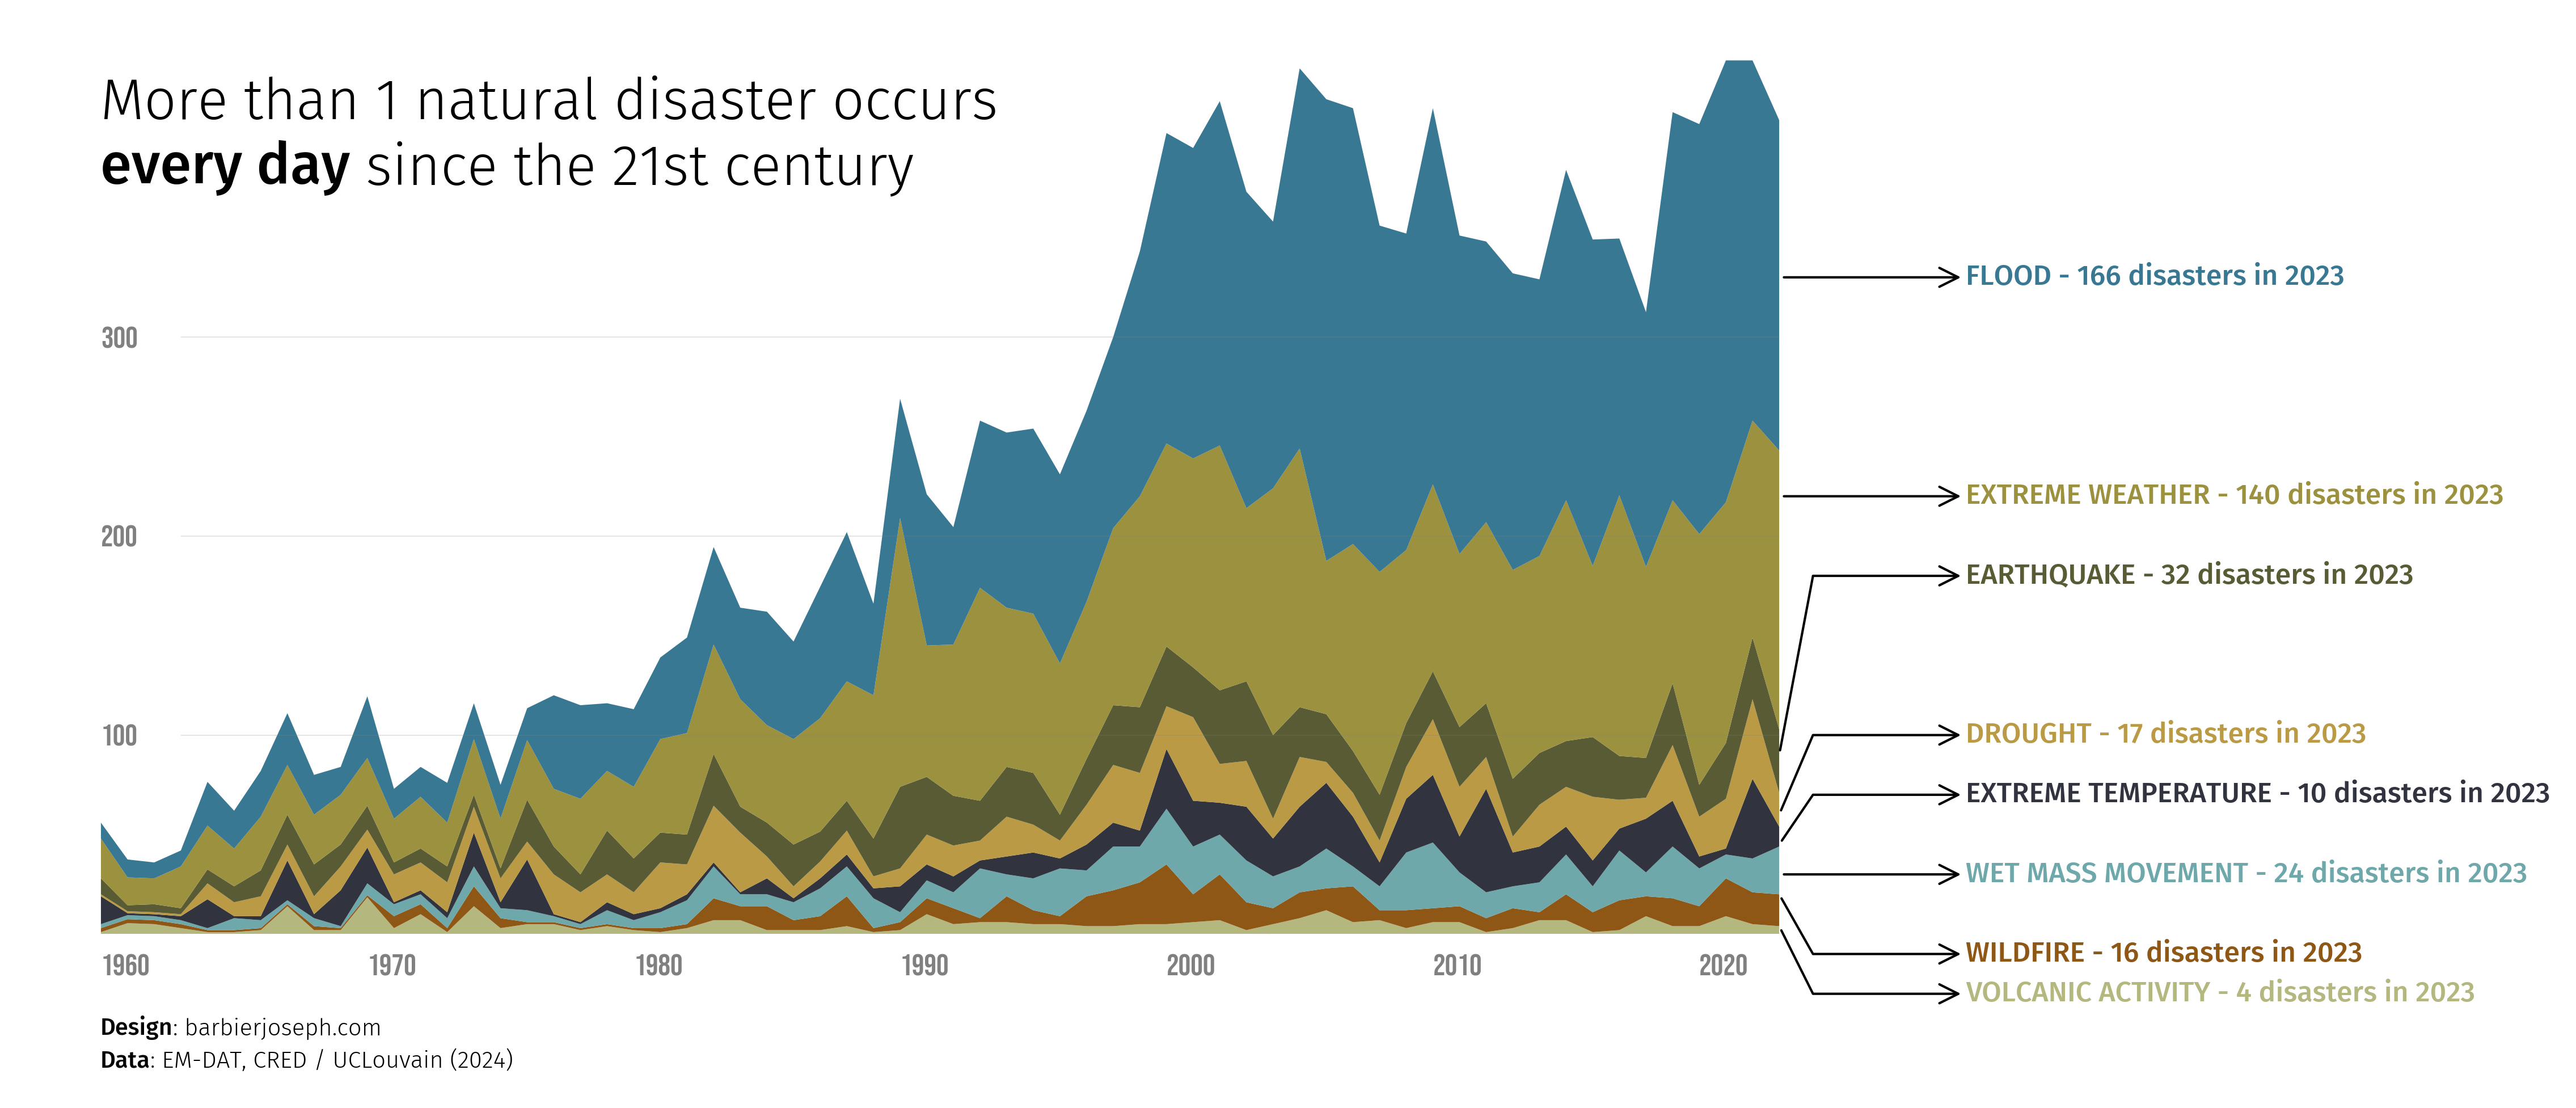
Chart made with pypalettes
Click on the image to get the associated code!


Acknowledgements
PyPalettes is highly inspired (and relies on for the first one) from
- the R package paletteer
- the python library palettable


