
Draw text along an arbitrary curve in matplotlib, with arc-length positioning and a perpendicular offset.
curved-text


Draw text that follows an arbitrary curve in matplotlib.
Label a curve along its own path instead of in a legend, so the reader's eye never leaves the data to read a colour key. The figure below shows the difference: a legend on the left, and the same lines labelled along their paths on the right.

The label is recomputed every time the figure is drawn, so it keeps following the curve through layout changes, resizing, and interactive panning or zooming.
When it fits
- The curve
(x, y)must be ordered along its length, so each point comes after
- The curve should be smooth relative to the text size. Label a smoothed or
Install
pip install curved-textTo work from a clone, install it in editable mode:
pip install -e .Usage
import numpy as np
import matplotlib.pyplot as plt
from curvedtext import curvedtext
x = np.linspace(0, 2 * np.pi, 400) y = np.sin(x)
fig, ax = plt.subplots() ax.plot(x, y) curved_text(ax, x, y, "text that follows the curve",             pos=0.5, anchor="center", offset=6.0, color="C3") plt.show()

Placement
Three independent parameters control where the label sits:
possets where the label is anchored along the curve, as a fraction of the
0.0 is the first point, 1.0 is the last.
anchorsets which part of the label lands atpos:"start","center",
"end".
offsetshifts the label off the curve, measured in typographic points. The
The figure below sweeps pos from the first point to the last. The green dot marks the anchor point in each panel.

If the label runs past either end of the curve, it is not cut off. The curve continues straight in the direction it had at that end, and the extra letters sit on that straight line.
The function and the class
The object form is also available:
from curved_text import CurvedText
CurvedText(x, y, "along the curve", ax, pos=0.2, anchor="start", offset=4.0)
Note the order of the axes argument. The CurvedText class takes it after x, y, text, matching matplotlib.text.Text. The curved_text function takes it first, matching matplotlib's axes-first helper functions.
Any extra keyword arguments (color, fontsize, alpha, fontfamily, ...) pass through to each per-character glyph and each mathtext run.
Features
Mathtext
A $...$ run in the label is laid out by matplotlib's mathtext engine and then bent along the curve the same way plain text is. Every part of the expression follows the curve, down to the bars in fractions and the overlines in radicals, so fractions, radicals, and large brackets stay joined together at any curvature. Plain and math runs mix freely in one string:
curvedtext(ax, x, y, r"flux $\propto \sqrt{D{\mathrm{eff}}}\,(L/L_0)^2$",
            pos=0.5, anchor="center", offset=8.0)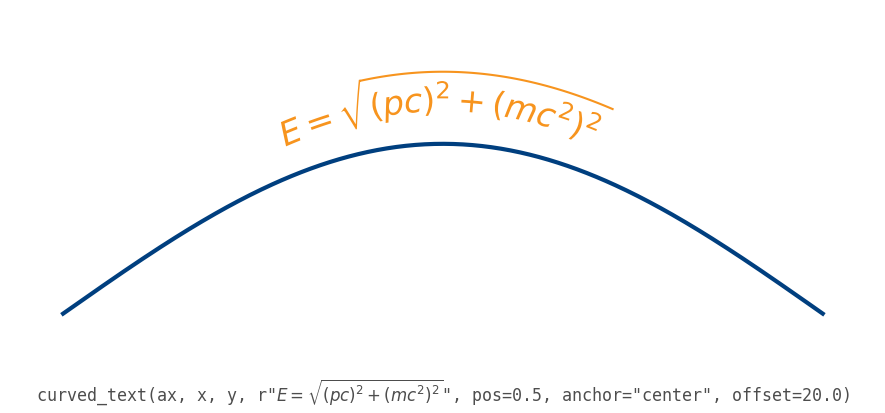
Pass parse_math=False to treat dollar signs literally. Tall expressions compress vertically on the inside of tight bends, so choose the text size to suit the curvature. text.usetex is not supported.
Plain words and math runs in one label share a single baseline, so the math symbols sit level with the surrounding letters and a superscript lifts only the exponent, not the body -- the alignment is built in, not tuned:
curved_text(ax, x, y, r"mass $m$ and speed $c$ give $E = mc^2$")
Casing behind the label
Set box to draw a casing behind the label. The casing is a band that follows the curve under the letters, at the label's height. It keeps the label readable where it crosses the lines it labels. Because it is a single fill, it covers plain text and mathtext alike:
curved_text(ax, x, y, r"signal $s(t) = A\,e^{-t/\tau}$", box=True)box accepts True, a colour string, or a dict with these keys:
| Key | Meaning | Default | | ------- | ------------- | ------------- | | color | Fill colour of the band | white | | pad | Band height, as a multiple of the tallest glyph's height | 1.1 | | alpha | Opacity of the band | 1.0 |
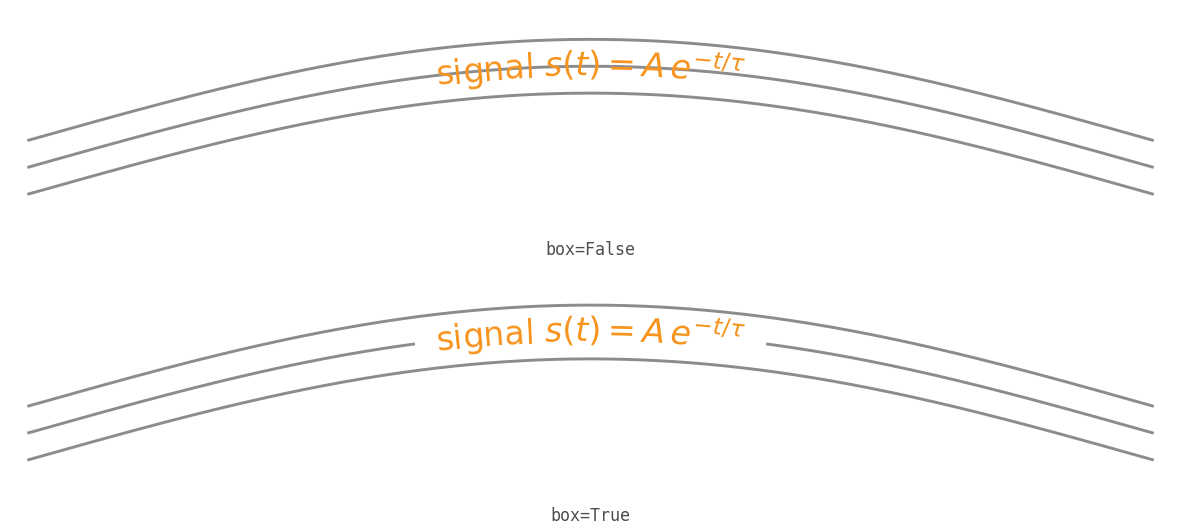
For a lighter casing that hugs each letter instead, pass a white withStroke through matplotlib's path_effects. Path effects reach every letter and every mathtext run, as they do on any Text. Because each letter is stroked on its own, a wide stroke makes neighbouring letters blur together, so use box for solid coverage under plain text:
import matplotlib.patheffects as pe
curved_text(ax, x, y, r"signal $s(t) = A\,e^{-t/\tau}$",             path_effects=[pe.withStroke(linewidth=4, foreground="white")])
The figure below shows the difference on the same plain-text label: a wide stroke per character on top, the single box fill on the bottom.

Even spacing on tight bends
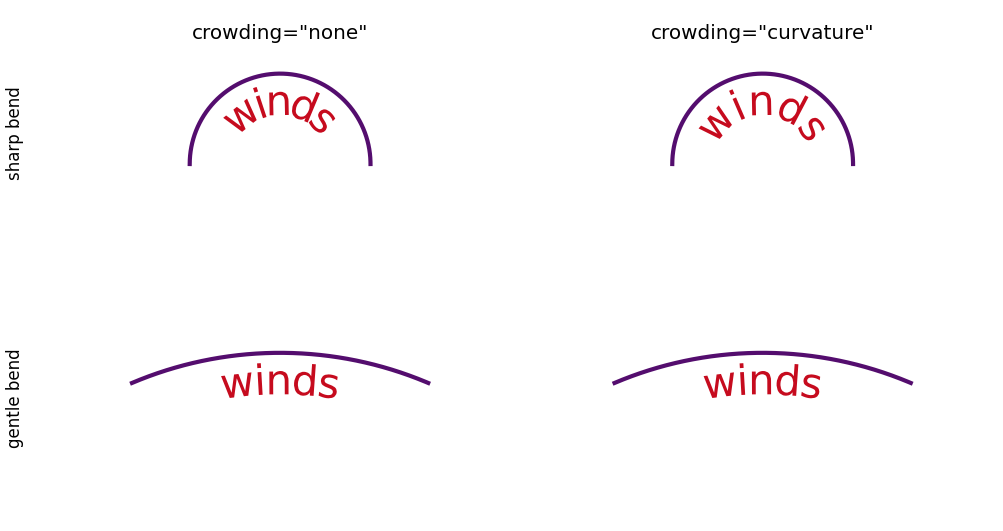
Letters are placed one after another by their own widths, so where the curve bends sharply they crowd together on the inside of the bend, because each rigid letter box fans into its neighbour there. Set crowding="curvature" to open an even letterspacing gap that grows with the local curvature, so the inside edges stop colliding:
curved_text(ax, x, y, "winding", crowding="curvature")The gap is the same between every pair of letters, so the tracking stays even. It also has a deadband: a gentle bend or a straight run stays below it and is left unchanged, so only genuinely crowded text is spaced out. The default is crowding="none", which leaves the spacing as the letters' own widths set it.
The figure below shows both regimes. Top row: a sharp bend, where the correction visibly separates the letters. Bottom row: a gentle bend of the same letters, left untouched because it falls below the deadband.
Choosing what rides the curve
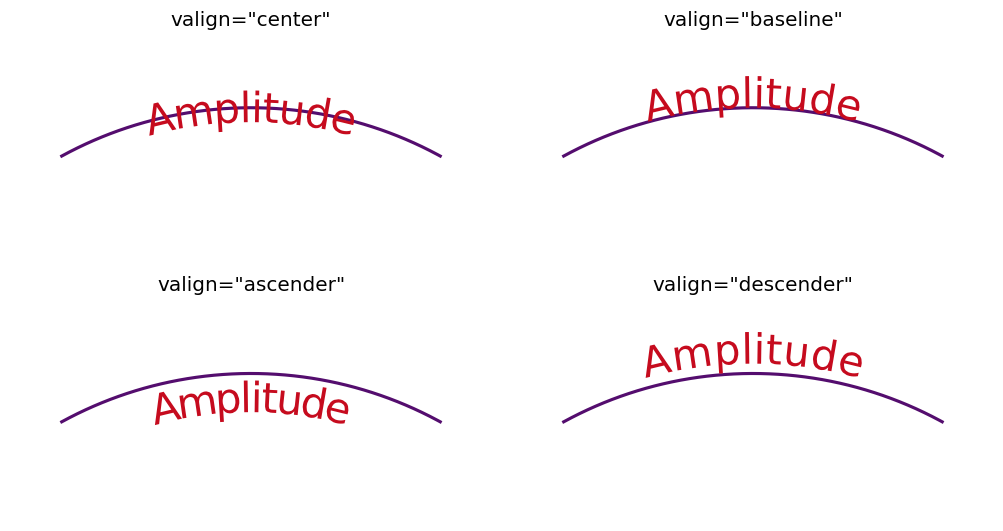
By default the text straddles the curve (valign="center"). Use valign to pick a different line: "baseline" runs the text baseline along the curve so the body sits above it, while "ascender" and "descender" ride the top or bottom of the text -- handy for hanging a label below a curve or sitting it above one:
curved_text(ax, x, y, "Amplitude", valign="baseline")The shift is a single font metric applied to the whole label, so it never disturbs the spacing or the alignment of plain text with mathtext. Combine it with offset to lift the chosen line clear of the curve.
Works with seaborn, pandas, and other matplotlib-backed libraries
curved_text needs only a matplotlib.axes.Axes, so it works with any library that draws on matplotlib. seaborn's axes-level functions return an Axes, its figure-level functions expose one through .axes, and pandas DataFrame.plot returns an Axes as well. Pass that axes in directly:
import seaborn as sns
ax = sns.lineplot(data=df, x="x", y="y") curved_text(ax, df["x"], df["y"], "along the curve",             pos=0.5, anchor="center", offset=6.0)

How it works
Each character (and each $...$ run) is a child artist drawn from its glyph outline and placed so a single shared text baseline follows the curve. A plain character is turned rigidly to follow the line: instead of reading the curve's slope at a single point, the package draws a straight line across the width of that one letter and tips the letter to match. Averaging over the letter's width this way keeps neighbouring letters smooth even when the curve is drawn from only a few points, and sharing one baseline keeps plain text and mathtext level.
All of this is measured in display space, that is, in pixels on the final figure after every scaling step. So the spacing and the perpendicular offset stay correct at any DPI and figure size. The layout is redone on every draw, which is why the label keeps up with resizing and with interactive pan or zoom.
Related
matplotlib-label-lines labels one or many lines inline at a chosen or automatically picked point, each label rotated to the local slope. It is the quickest way to replace a legend across a set of lines. curved-text solves the adjacent problem: making a single string (plain or mathtext) follow the curve character by character, with arc-length placement and a perpendicular offset, redone on every draw. Reach for label-lines to drop legend labels onto several lines, and for curved-text to make text ride a path. In the ggplot2 world, geomtextpath covers similar text-on-path ground.
For matplotlib users coming from LaTeX: this is matplotlib's version of TikZ's text along path decoration (from decorations.text). The mapping is close. pos and anchor do the work of text align and the indents, offset does the work of raise, and overrunning text rides the straight tangent extension instead of being cut off at the path's end.
Documentation
Full documentation, including the API reference and the design notes, is at thiebes.github.io/curved-text. More worked examples are in the example gallery.
Contributing
Bug reports, feature requests, and pull requests are welcome. See CONTRIBUTING.md for the development install, how to run the tests, linting, and the rest of the workflow. By participating you agree to the Code of Conduct.
Development and AI use
Generative AI tools were used to develop and maintain this package. The author (the sole maintainer) directed the design and reviewed, tested, and approved every change before committing it.
- Design and direction. The architecture and the design decisions were the
_CurveFrame
display-space geometry, tangent-extension overflow, and the choice to support
mathtext by bending glyph outlines along the curve. The mathtext feature was
iterated against real problems found in use, including the baseline-alignment
fix and the move from a per-character stroke to a single box casing once the
per-letter halo was found to leave gaps. AI assisted in drafting the design
documents and the implementation against these decisions.
- Code. The implementation in
src/curved_text/was drafted with
- Tests. The test suite in
tests/was drafted with AI assistance and
- Documentation. The README, API reference, and example gallery prose were
- How AI was used. Primarily conversational and agentic drafting with
No AI-generated content was committed without human review.
License
MIT


