
:rocket: SwiftUI Charts with custom styles
Last updated Jun 26, 2026
803
Stars
66
Forks
10
Issues
0
Stars/day
Attention Score
53
Topics
Language breakdown
No language data available.
▸ Files
click to expand
README
SwiftUI Charts
Build custom charts with SwiftUI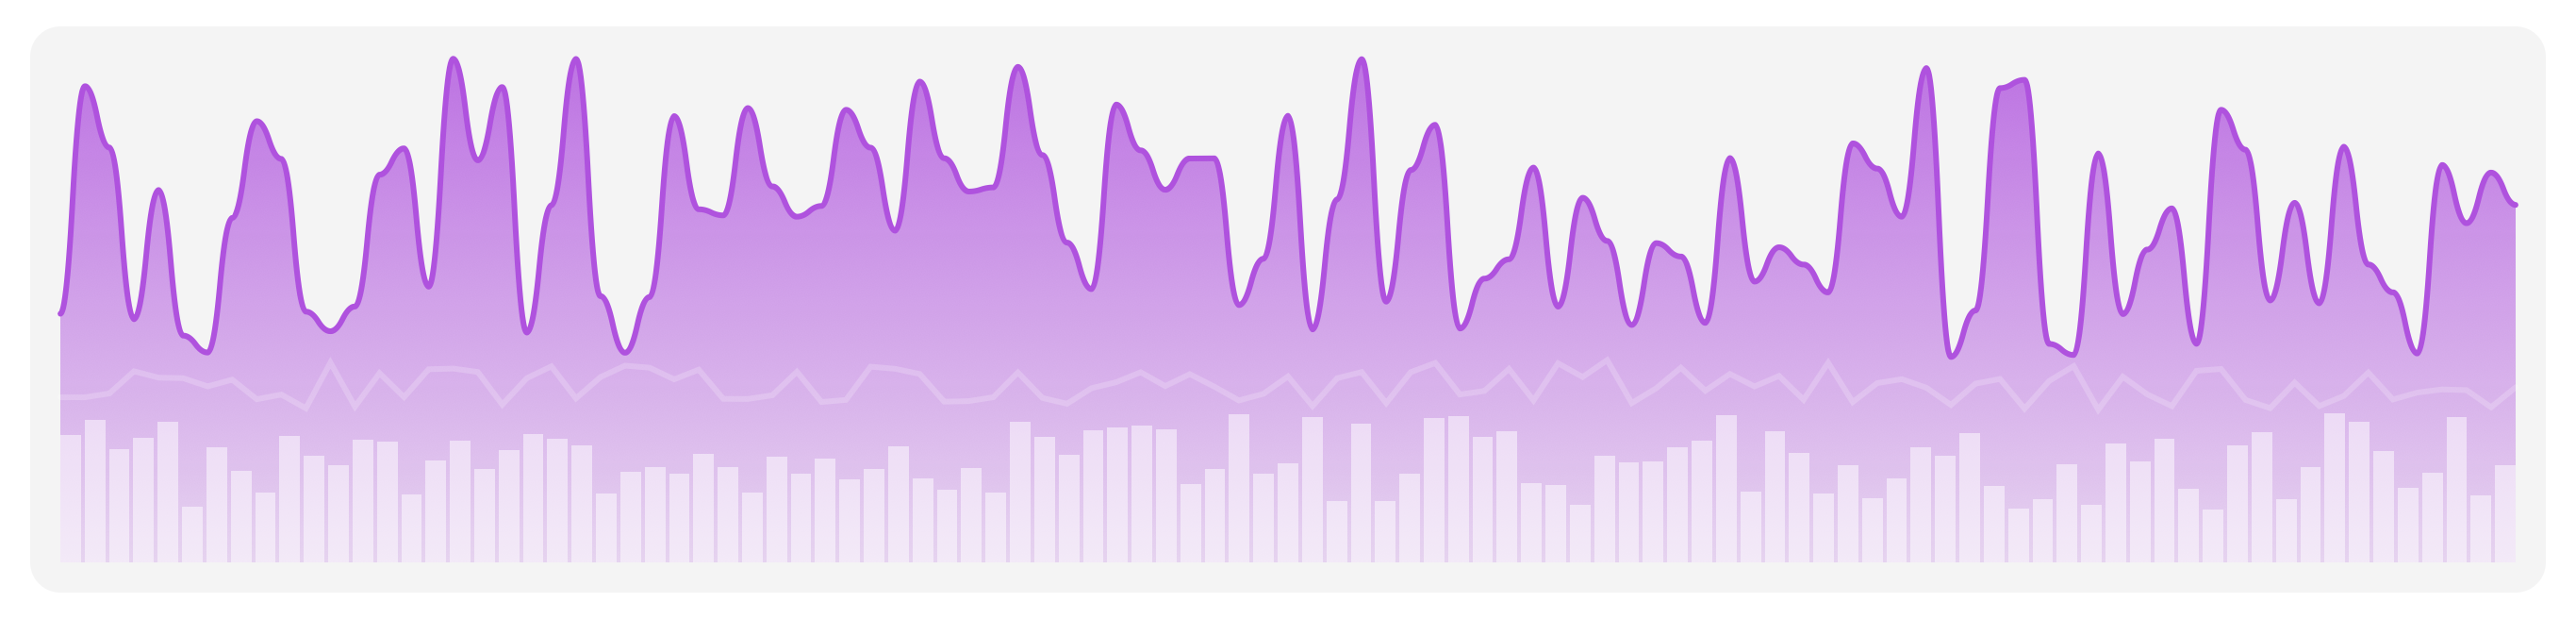
Styles
Line
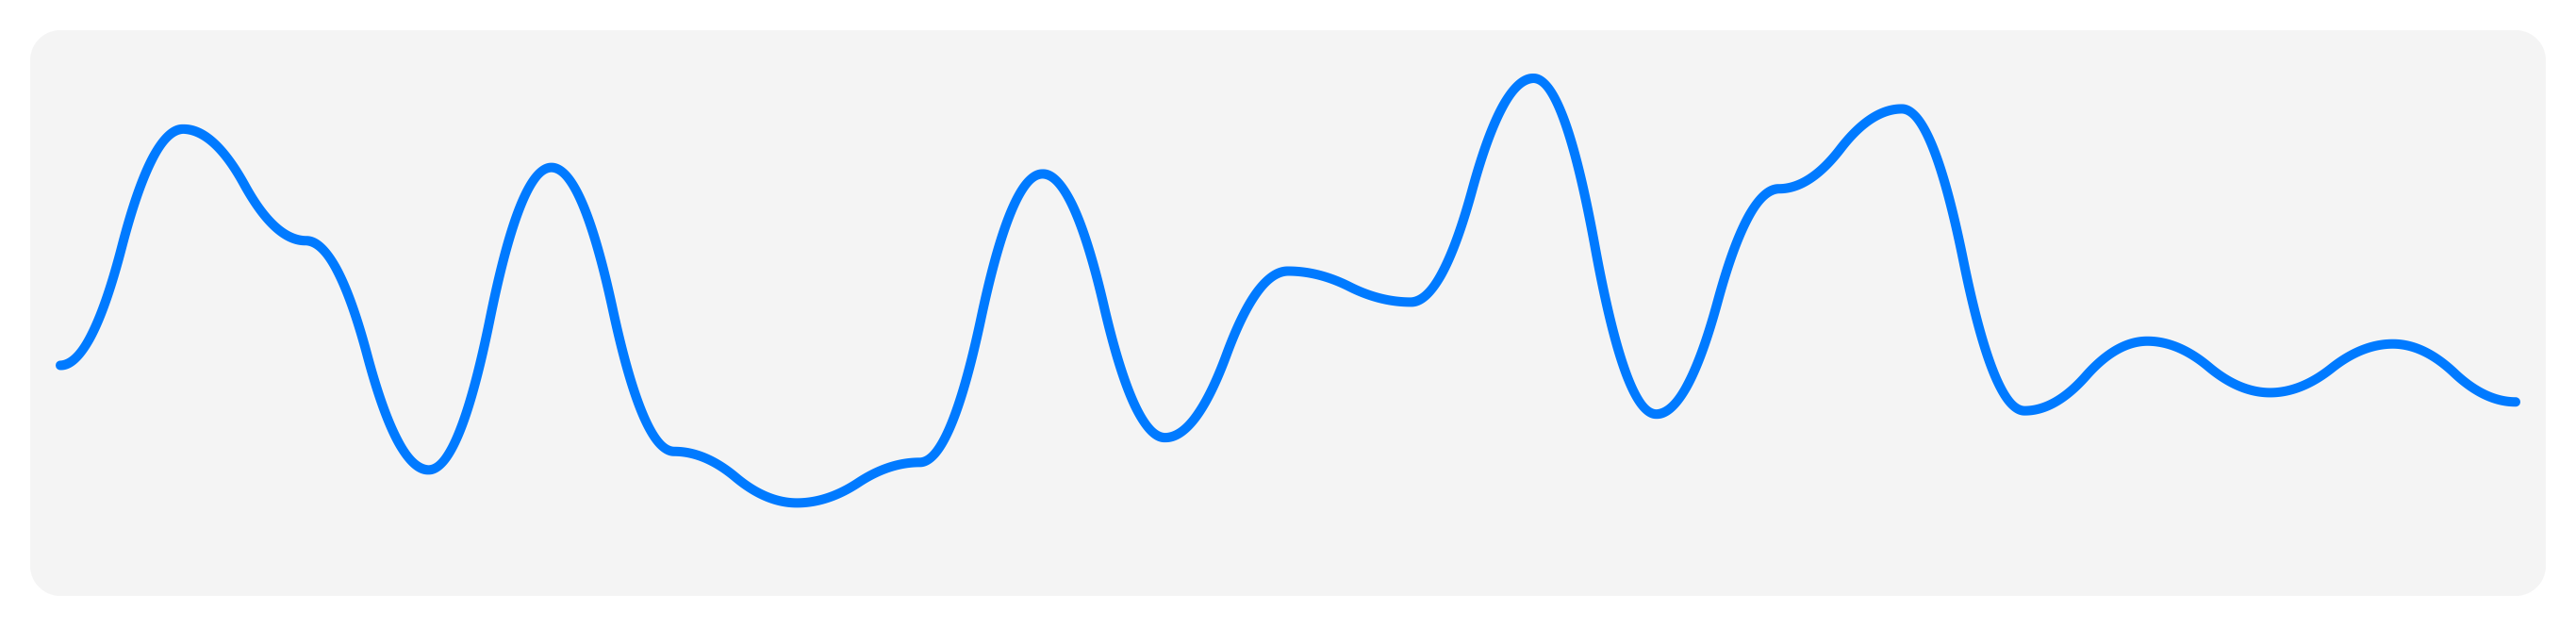
Chart(data: [0.1, 0.3, 0.2, 0.5, 0.4, 0.9, 0.1])
    .chartStyle(
        LineChartStyle(.quadCurve, lineColor: .blue, lineWidth: 5)
    )
Area
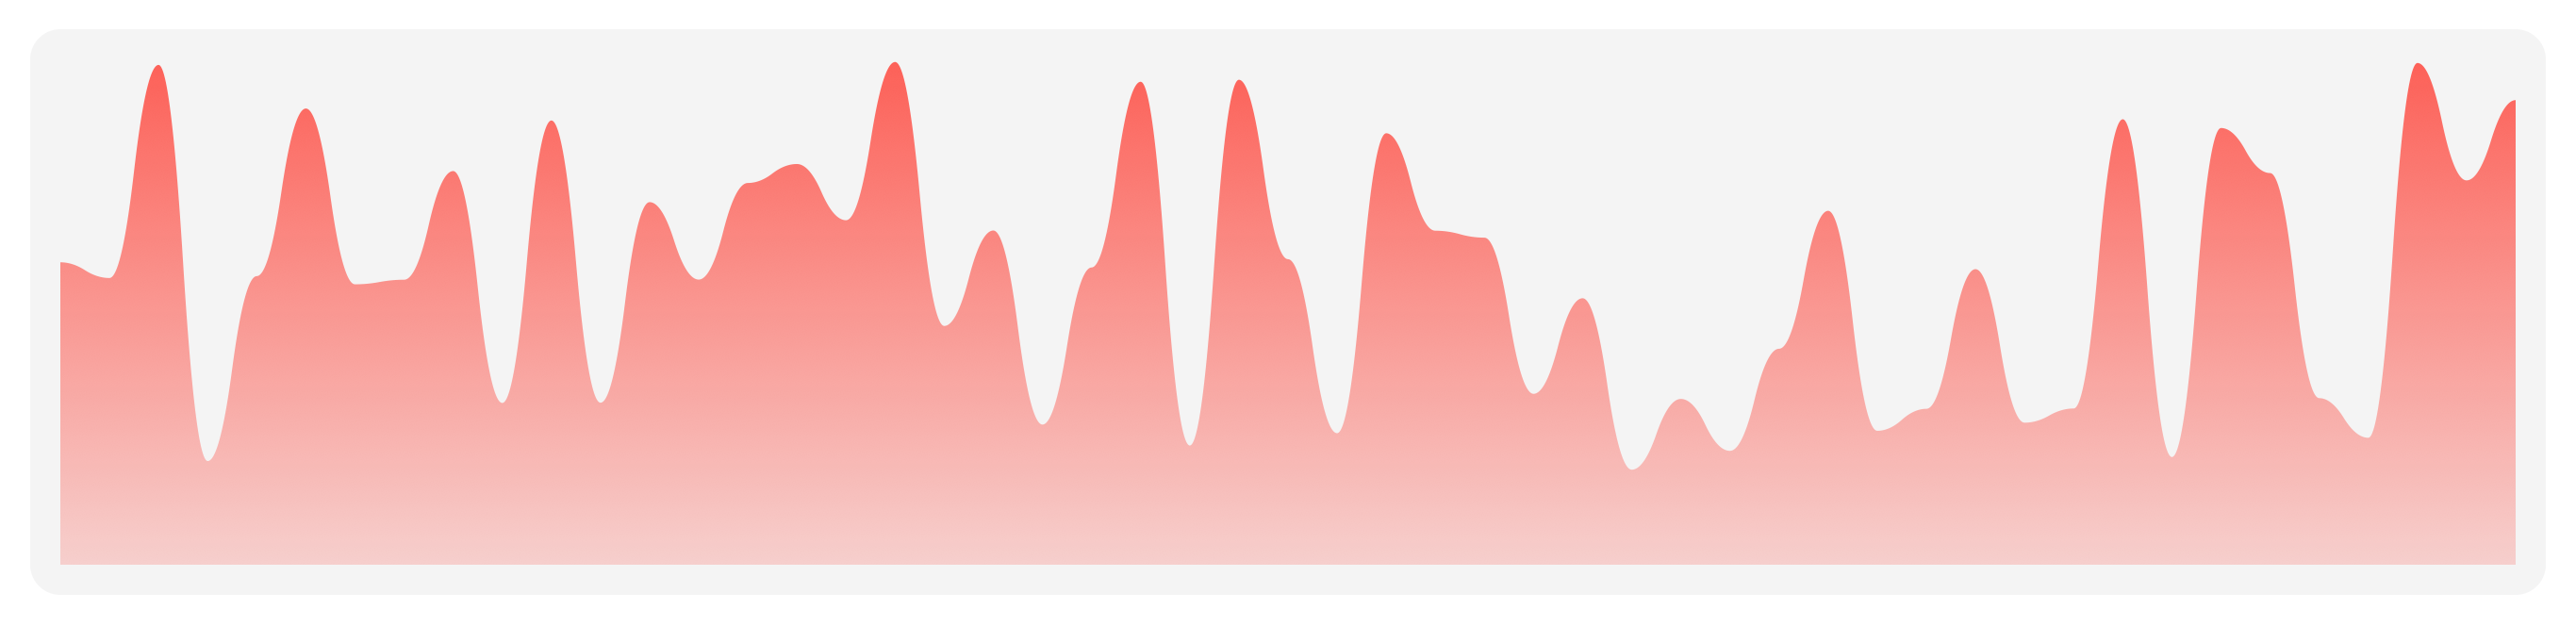
Chart(data: [0.1, 0.3, 0.2, 0.5, 0.4, 0.9, 0.1])
    .chartStyle(
        AreaChartStyle(.quadCurve, fill:
            LinearGradient(gradient: .init(colors: [Color.blue.opacity(0.2), Color.blue.opacity(0.05)]), startPoint: .top, endPoint: .bottom)
        )
    )
Stacked Area
Chart(data: matrix)
    .chartStyle(
        StackedAreaChartStyle(.quadCurve, colors: [.yellow, .orange, .red])
    )
Column
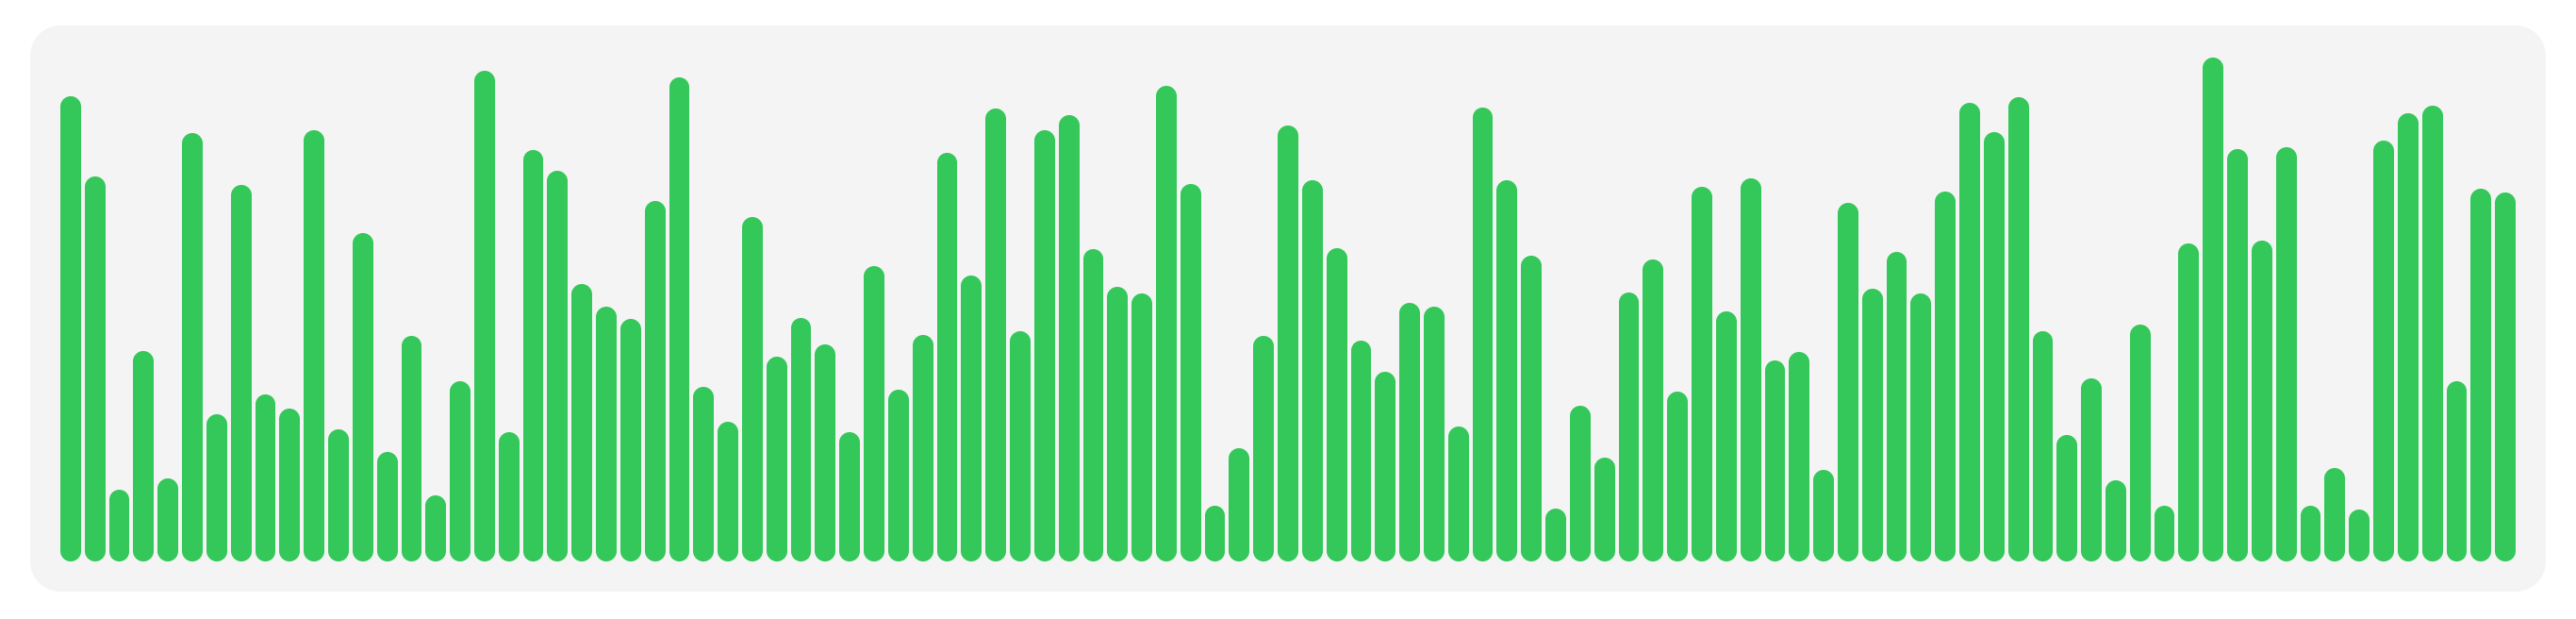
Chart(data: [0.1, 0.3, 0.2, 0.5, 0.4, 0.9, 0.1])
    .chartStyle(
        ColumnChartStyle(column: Capsule().foregroundColor(.green), spacing: 2)
    )
Stacked Column
Chart(data: matrix)
    .chartStyle(
        StackedColumnChartStyle(spacing: 2, cornerRadius: 3, colors: [.yellow, .orange, .red])
    )
Install
AddCharts to your project with Swift Package Manager
// swift-tools-version:5.1
import PackageDescription
let package = Package(     name: "YOUR_PROJECT",     dependencies: [         .package(url: "https://github.com/spacenation/swiftui-charts.git", from: "1.0.0"),     ] )
Roadmap
- Bar chart style


