
This project analyzes and visualizes the Used Car Prices from the Automobile dataset in order to predict the most probable car price
Data Analysis and Visualisation to predict Car Prices based on Used Car Prices Data Set
In this project I'm trying to analyze and visualize the Used Car Prices from the dataset available at https://archive.ics.uci.edu/ml/machine-learning-databases/autos/imports-85.data in order to predict the most probable car price
It is divided into four parts:
1) Data Wrangling - Pre processing data in python - Dealing missing values - Data formatting - Data normalization - Binning 2) Exploratory Data Analysis - Descriptive statistics - Groupby - Analysis of variance - Correlation - Correlation stats 3) Model Development - Simple Linear Regression - Multiple Linear Regression 4) Model Review and Evaluation - Regression Plots - Distribution Plots
Softwares and Libraries Used:
- Anaconda Distribution - Jupyter Notebook - Numpy - Pandas - Matplotlib - Seaborn
Importing the Modules:
import pandas as pd import numpy as np import math import matplotlib.pyplot as plt import seaborn as sns
Analysis
1) Histograms representing Binned prices in Low, Medium, High 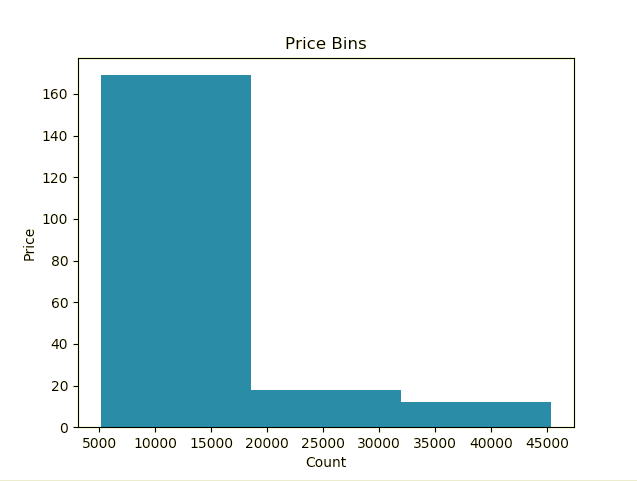
2) Boxplots representing effect of wheel frive with prices. 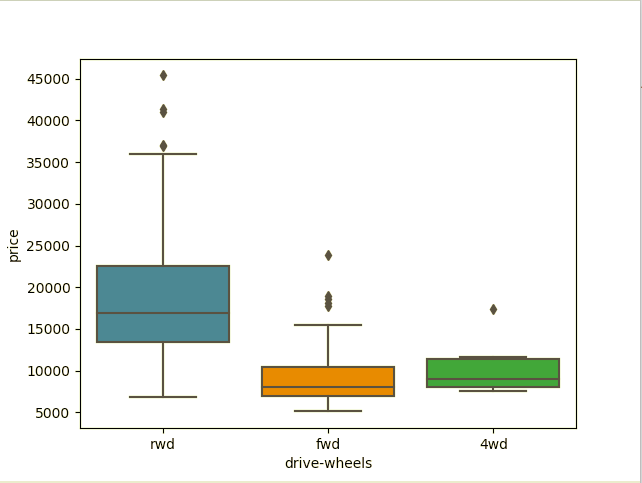
3) Scatter plot for Prices over Engine size 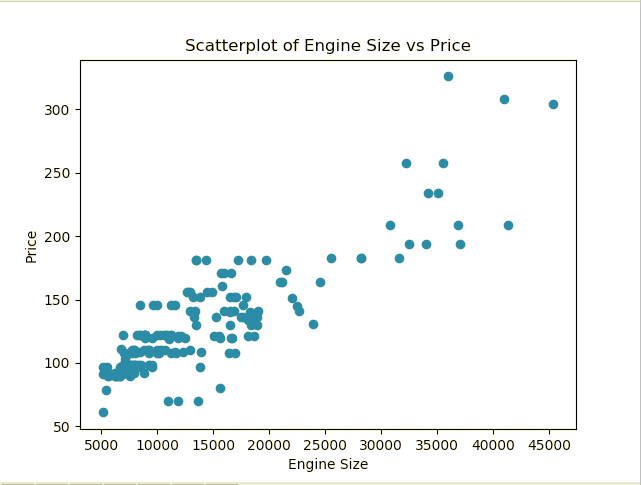
4) Pivot table categorizing wheel drive and body style with prices. 
5) HeatMap with wheel drive in y axis and body style in x axis. 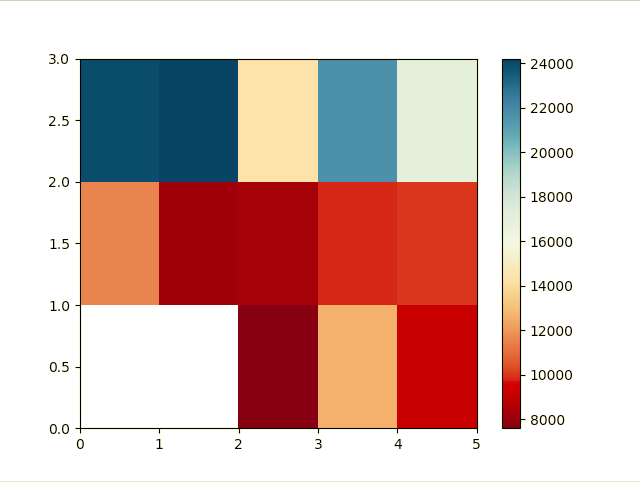
6) Positive Linear Relationship between engine size and price 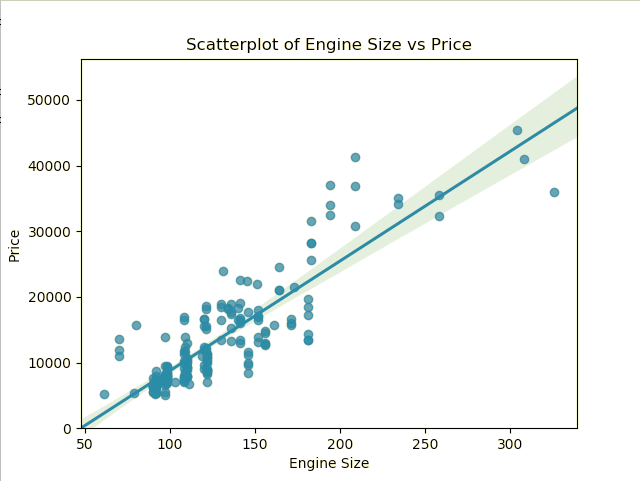
7) Negetive Linear Relationship between highway-mpg and price 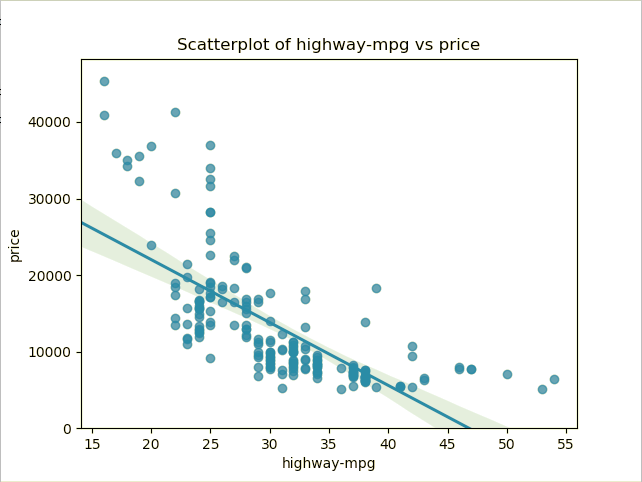
8) Weak Correlation between peak-rpm and price 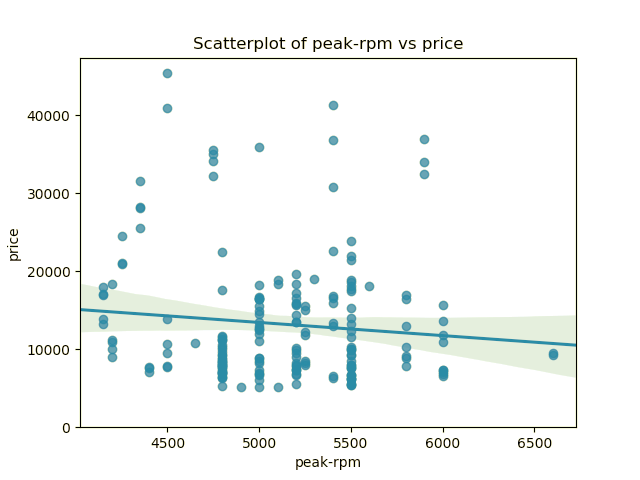
9) Simple Linear Regression plot 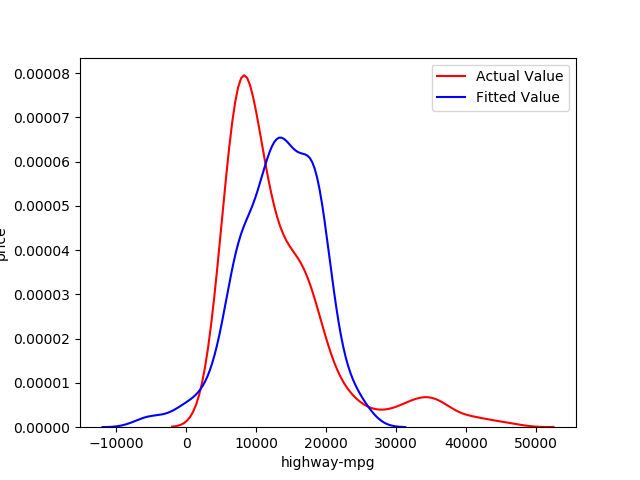
10) Multiple Linear Regression plot 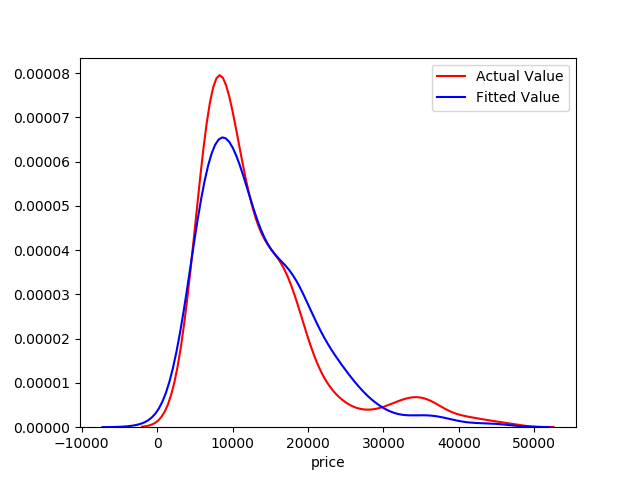
Conclusion
The distribution plot of Linear Regression and Multiple Regression technique shows how the model predicts the prices of automobiles based on "horsepower", "curb-weight", "engine-size" and "highway-mpg"
Comparing these three models, we conclude that the MLR model is the best model to be able to predict price from our dataset. This result makes sense, since we have 27 variables in total, and we know that more than one of those variables are potential predictors of the final car price.


