
Data visualization charts made mostly with Python, matplotlib, pandas, and numpy, and some scipy, plotly, seaborn, holoviews bokeh, streamlit, and R. Dataviz on Twitter. #30DayChartChallenge
30DayChartChallenge 2022
Hi, this was my first try at learning about data visualization, aside from a few matplotlib and Seaborn (Python) and d3.js (JavaScript) graphs I'd made earlier. Encouraged and inspired by the #30DayChartChallenge Twitter community, I experimented, had fun, and gained skills in finding data sources, differentiating the various kinds of charts, using pandas and numpy to work with the data, and writing matplotlib code. A couple of the projects also use scipy, plotly, seaborn, holoviews bokeh, streamlit, or R.
Intro to the 30 Day Chart Challenge
| Comparisons | Distributions | Relationships | Timeseries | Uncertainties | |----------------------------|-------------------------|----------------------------|-----------------------------|---------------------------| | 01 part-to-whole | 07 physical | 13 correlation | 19 global change | 25 trend | | 02 pictogram | 08 mountains | 14 3-dimensional | 20 new tool | 26 interactive | | 03 historical | 09 statistics | 15 multivariate | 21 down/upwards | 27 future | | 04 flora | 10 experimental | 16 environment | 22 animation | 28 deviations | | 05 slope | 11 circular | 17 connections | 23 tiles | 29 storytelling | | 06 data day: OWID | 12 theme day: The Economist | 18 data day: OECD | 24 theme day: Financial Times | 30 data day: UN Population |
COMPARISONS
[Day 01]: #
Part to Whole (Day 1)

[Day 02]: #
Pictogram (Day 2)

[Day 03]: #
Historical (Day 3)

 Historical Timeline - about - code
[Day 04]: #
Flora (Day 4)

[Day 05]: #
Slope (Day 5)

[Day 06]: #
Data OWID (Day 6)

Relational Plot - about - code
DISTRIBUTIONS
[Day 07]: #
Physical (Day 7)

[Day 08]: #
Mountains (Day 8)

[Day 09]: #
Statistics (Day 9)

Histogram, Poisson Distribution - about - code
[Day 10]: #
Experimental (Day 10)

[Day 11]: #
Circular (Day 11)
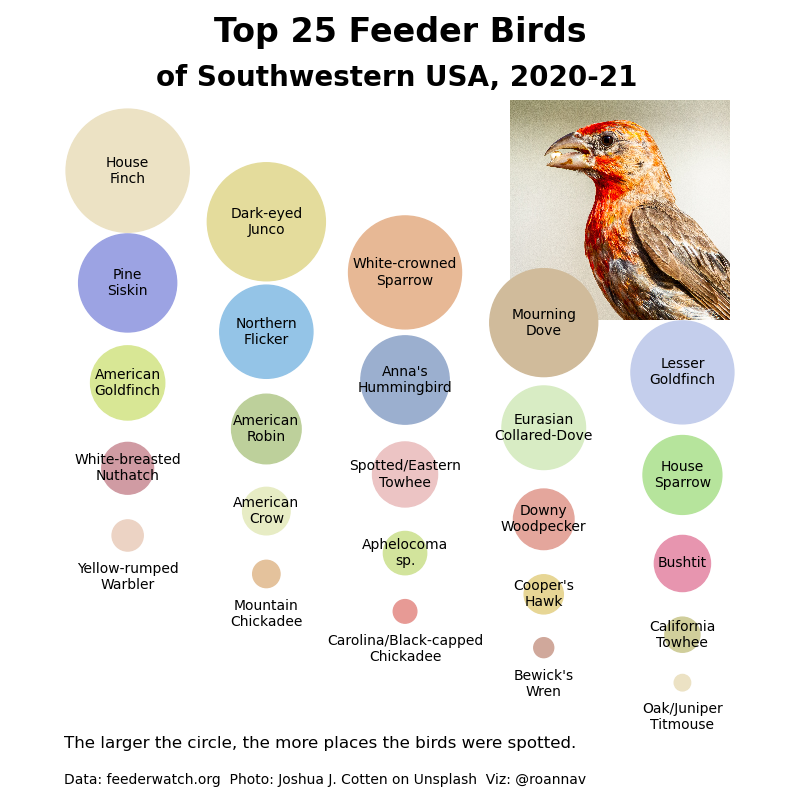
[Day 12]: #
Theme The Economist (Day 12)

Stacked Bar Chart - about - code
RELATIONSHIPS
[Day 13]: #
Correlation (Day 13)

Heat Map, Regression Plot - about - code
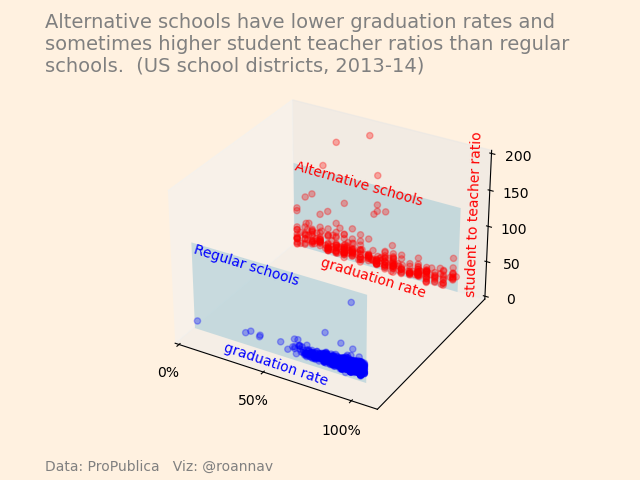
[Day 14]: #
3D (Day 14)
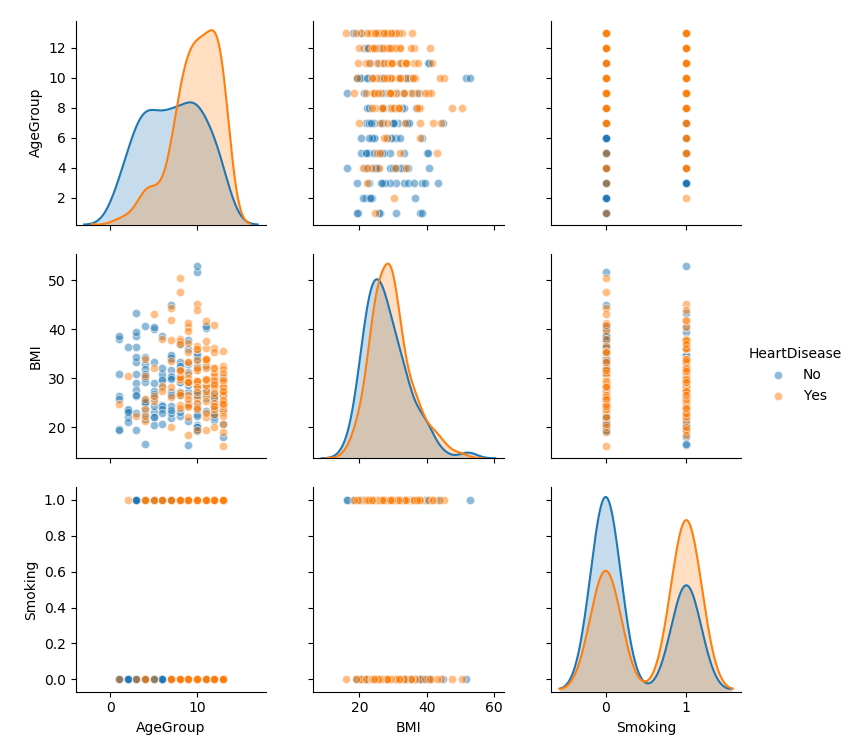
[Day 15]: #
Multivariate (Day 15)
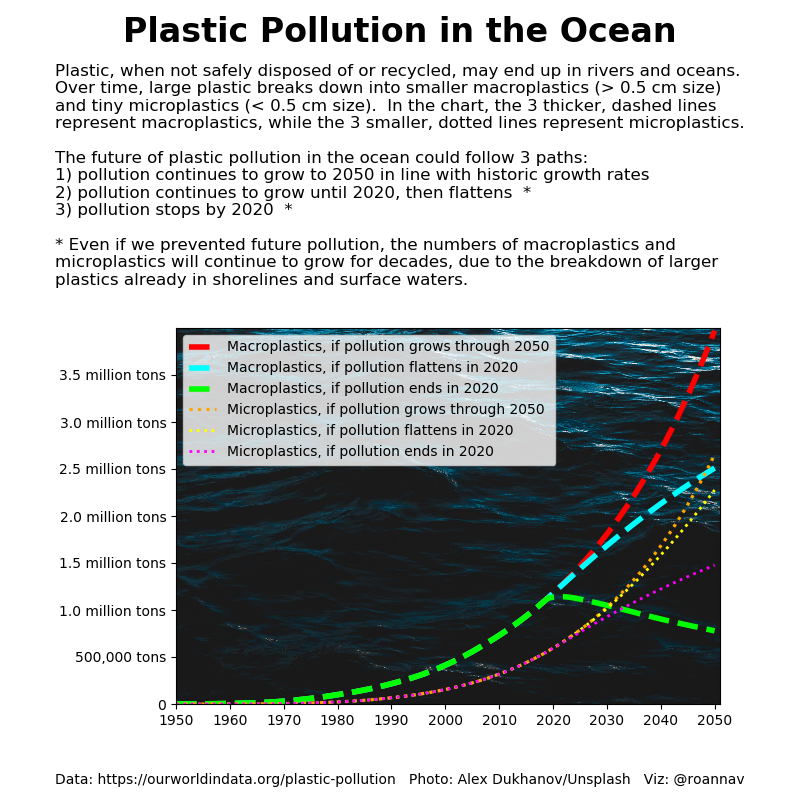
[Day 16]: #
Environment (Day 16)
[Day 17]: #
Connections (Day 17)
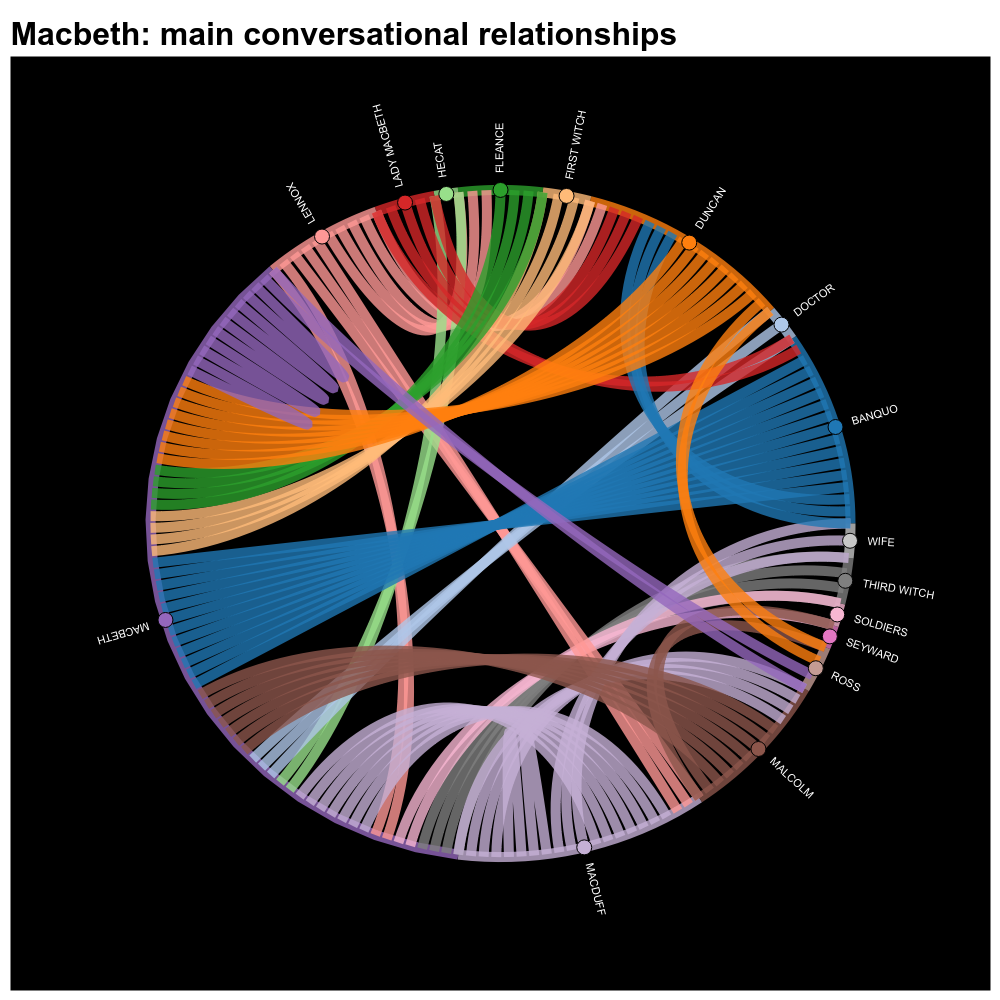
[Day 18]: #
Data: OECD(Day 18)

TIMESERIES
[Day 19]: #
Global Change (Day 19)

Time Series Chart - about - code
[Day 20]: #
New Tool (Day 20)

Stacked Area Chart - about - code
[Day 21]: #
Down/Upwards (Day 21)

Candlestick Chart - about - code
[Day 22]: #
Animation (Day 22)

Animated Line Graph - about - code
[Day 23]: #
Tiles (Day 23)

[Day 24]: #
Theme Financial Times (Day 24)

Time Series Graph - about - code
UNCERTAINTIES
[Day 25]: #
Trend (Day 25)
[Day 26]: #
Interactive (Day 26)

Pictogram, Bar Chart - about - code
[Day 27]: #
Future (Day 27)
[Day 28]: #
Deviations (Day 28)
[Day 29]: #
Storytelling (Day 29)
[Day 30]: #


