
Plugin for JetBrains IDEs to view Python DataFrames when debugging.
Python: Styled DataFrame Viewer
[!NOTE]
PyCharm 2024.2.1 - 2024.3.x Users: If you're using PyCharm versions >= 2024.2.1 and < 2025.1, the Python debugger has string truncation bugs that prevent fetching DataFrame data. Please see the workaround documentation: WORKAROUNDPYCHARM2024.2.1TO_2025.1.md
Installation
- Using the IDE built-in plugin system:
- JetBrains Marketplace:
What It Is
View, sort and filterDataFrames or a Python dict when debugging.
Note: The plugin requires one of the supported Python DataFrame libraries:
pandaspolars
Supported DataFrame Libraries
Features
- filtering (pandas, polars)
- sorting
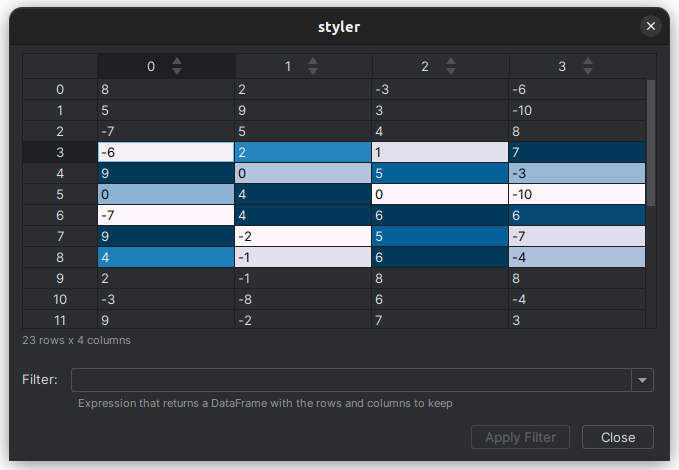
- highlighting of numeric cell values
- keyboard shortcuts to work efficiently
- settings to configure plugin behavior
How Does It Work
The plugin can be used to view DataFrames from aDebug Session or a Python Console.
Examples:
Example: Debug Session
Generate aDataFrame: # code for pandas import pandas as pd
df = pd.DataFrame.from_dict({"a": range(200), "b": range(100, 300), "c": range(200, 400)})
breakpoint()
# code for polars
import polars as pl
df = pl.from_dict({"a": range(200), "b": range(100, 300), "c": range(200, 400)})
breakpoint()
Run the code in debug mode in your JetBrains IDE. The program stops at the line with the breakpoint() command.
Select the Threads & Variables tab of the debugger (as seen in the screenshot below). Right-click on df to open the context menu. Select View as Styled DataFrame.

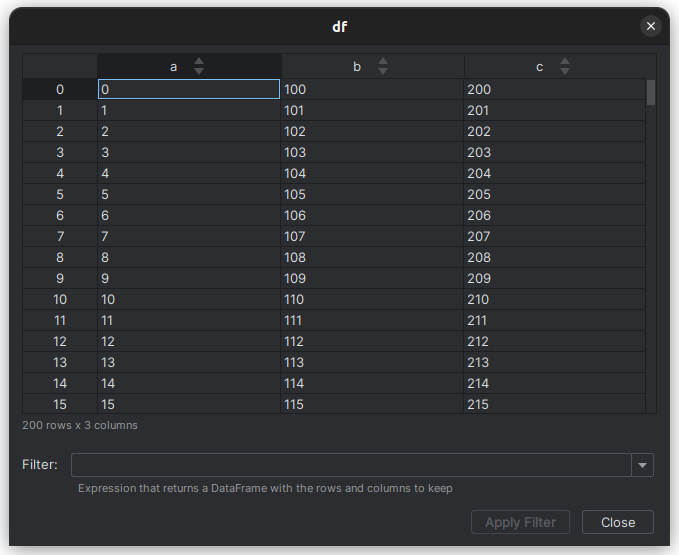
This opens a new window which shows the DataFrame df:
Example: Python Console
Enter the code to generate aDataFrame:
# code for pandas
import pandas as pd
df = pd.DataFrame.from_dict({"a": range(200), "b": range(100, 300), "c": range(200, 400)})
# code for polars
import polars as pl
df = pl.from_dict({"a": range(200), "b": range(100, 300), "c": range(200, 400)})
Right-click on df, in the variable view, to open the context menu. Select View as Styled DataFrame.

This opens a new window which shows the DataFrame df:


