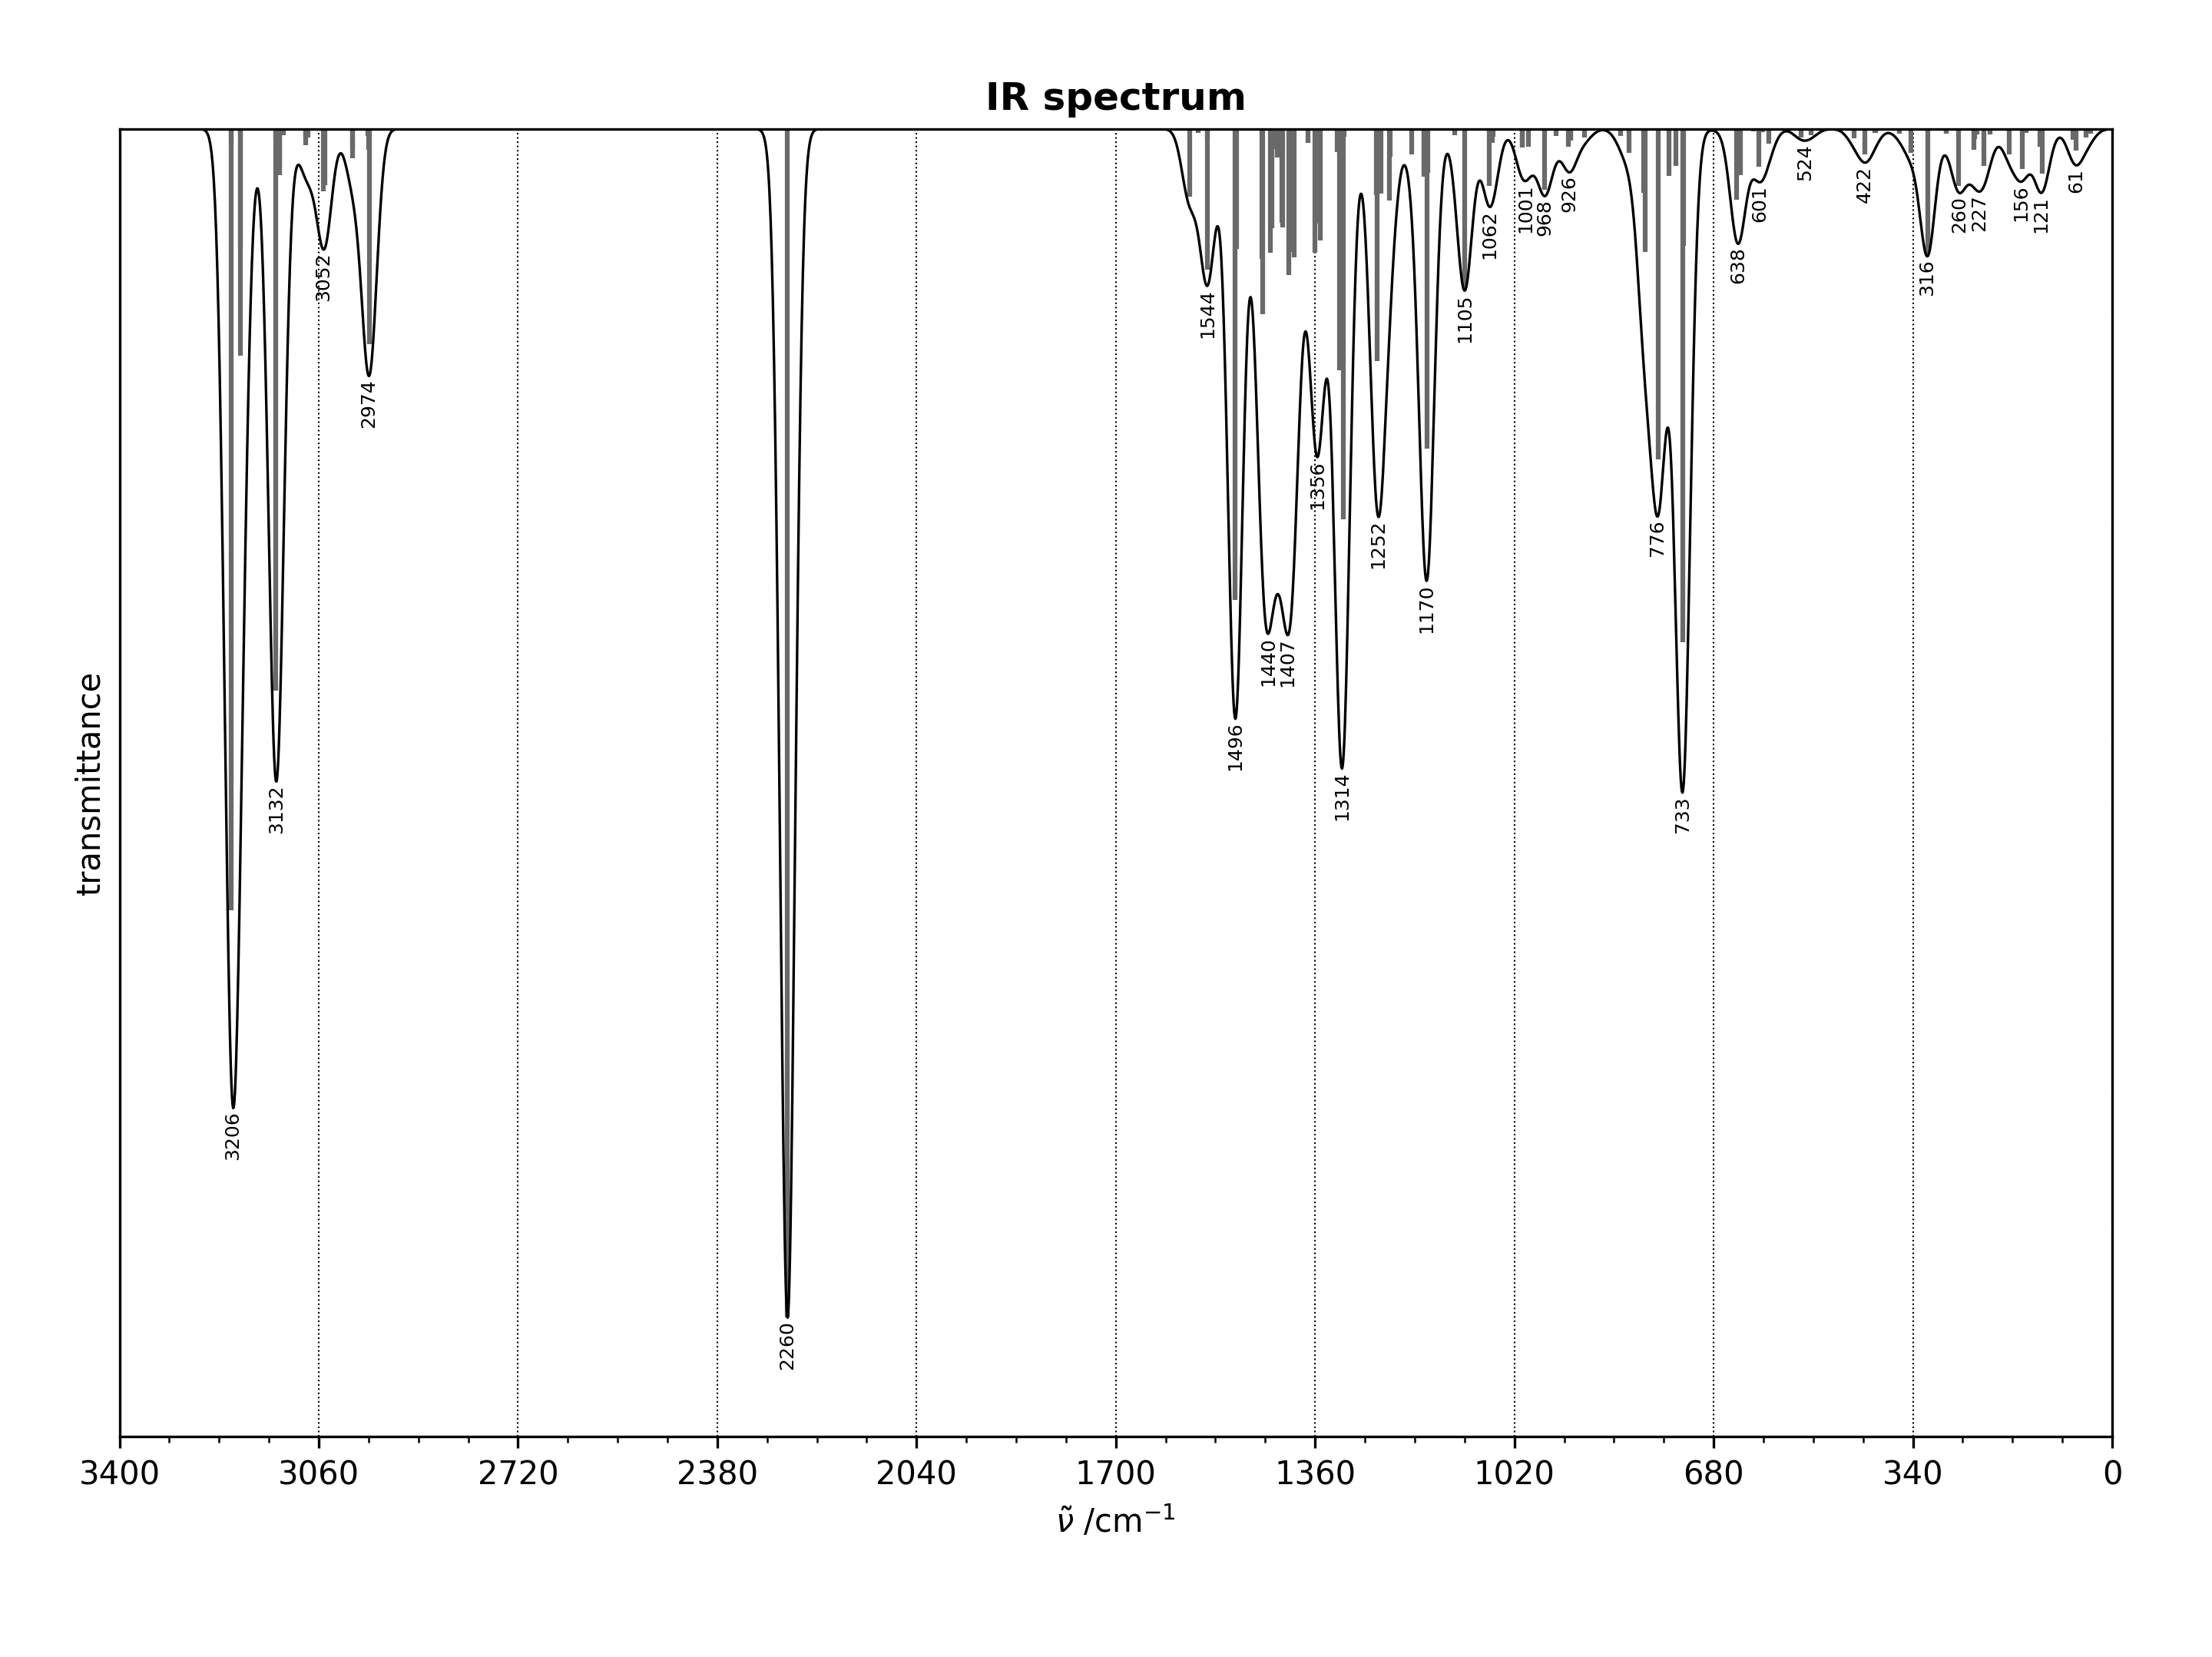
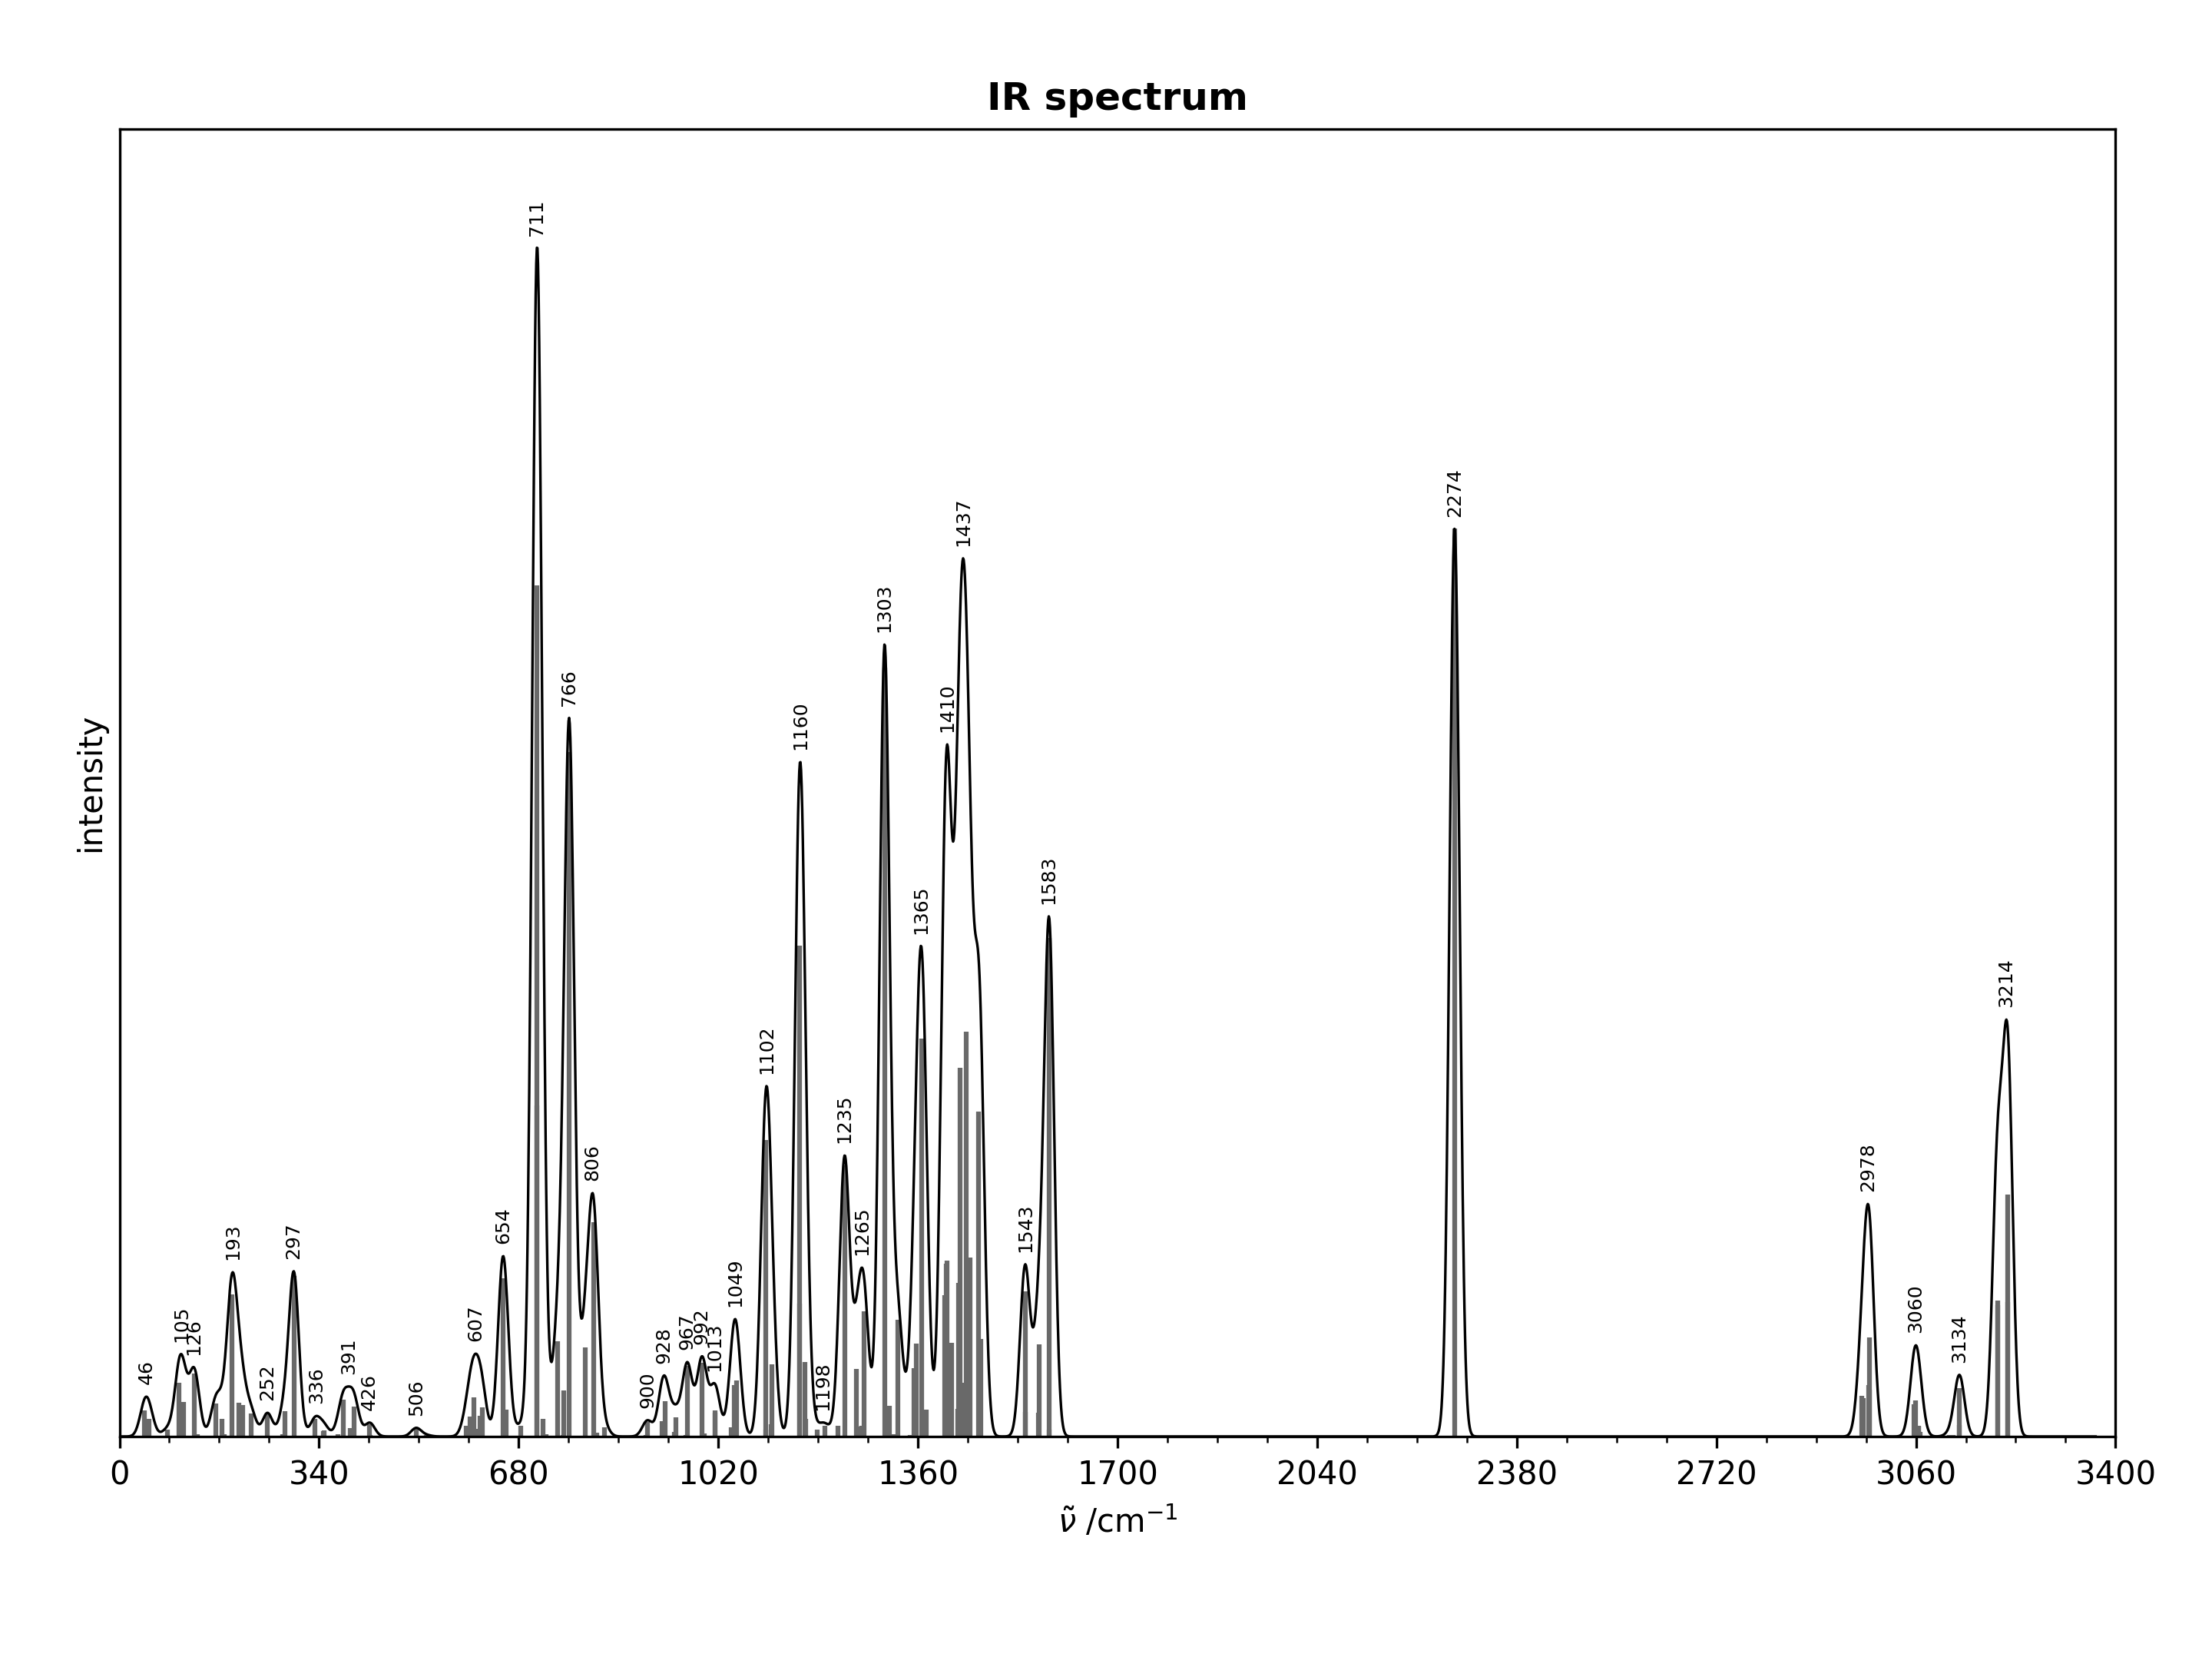
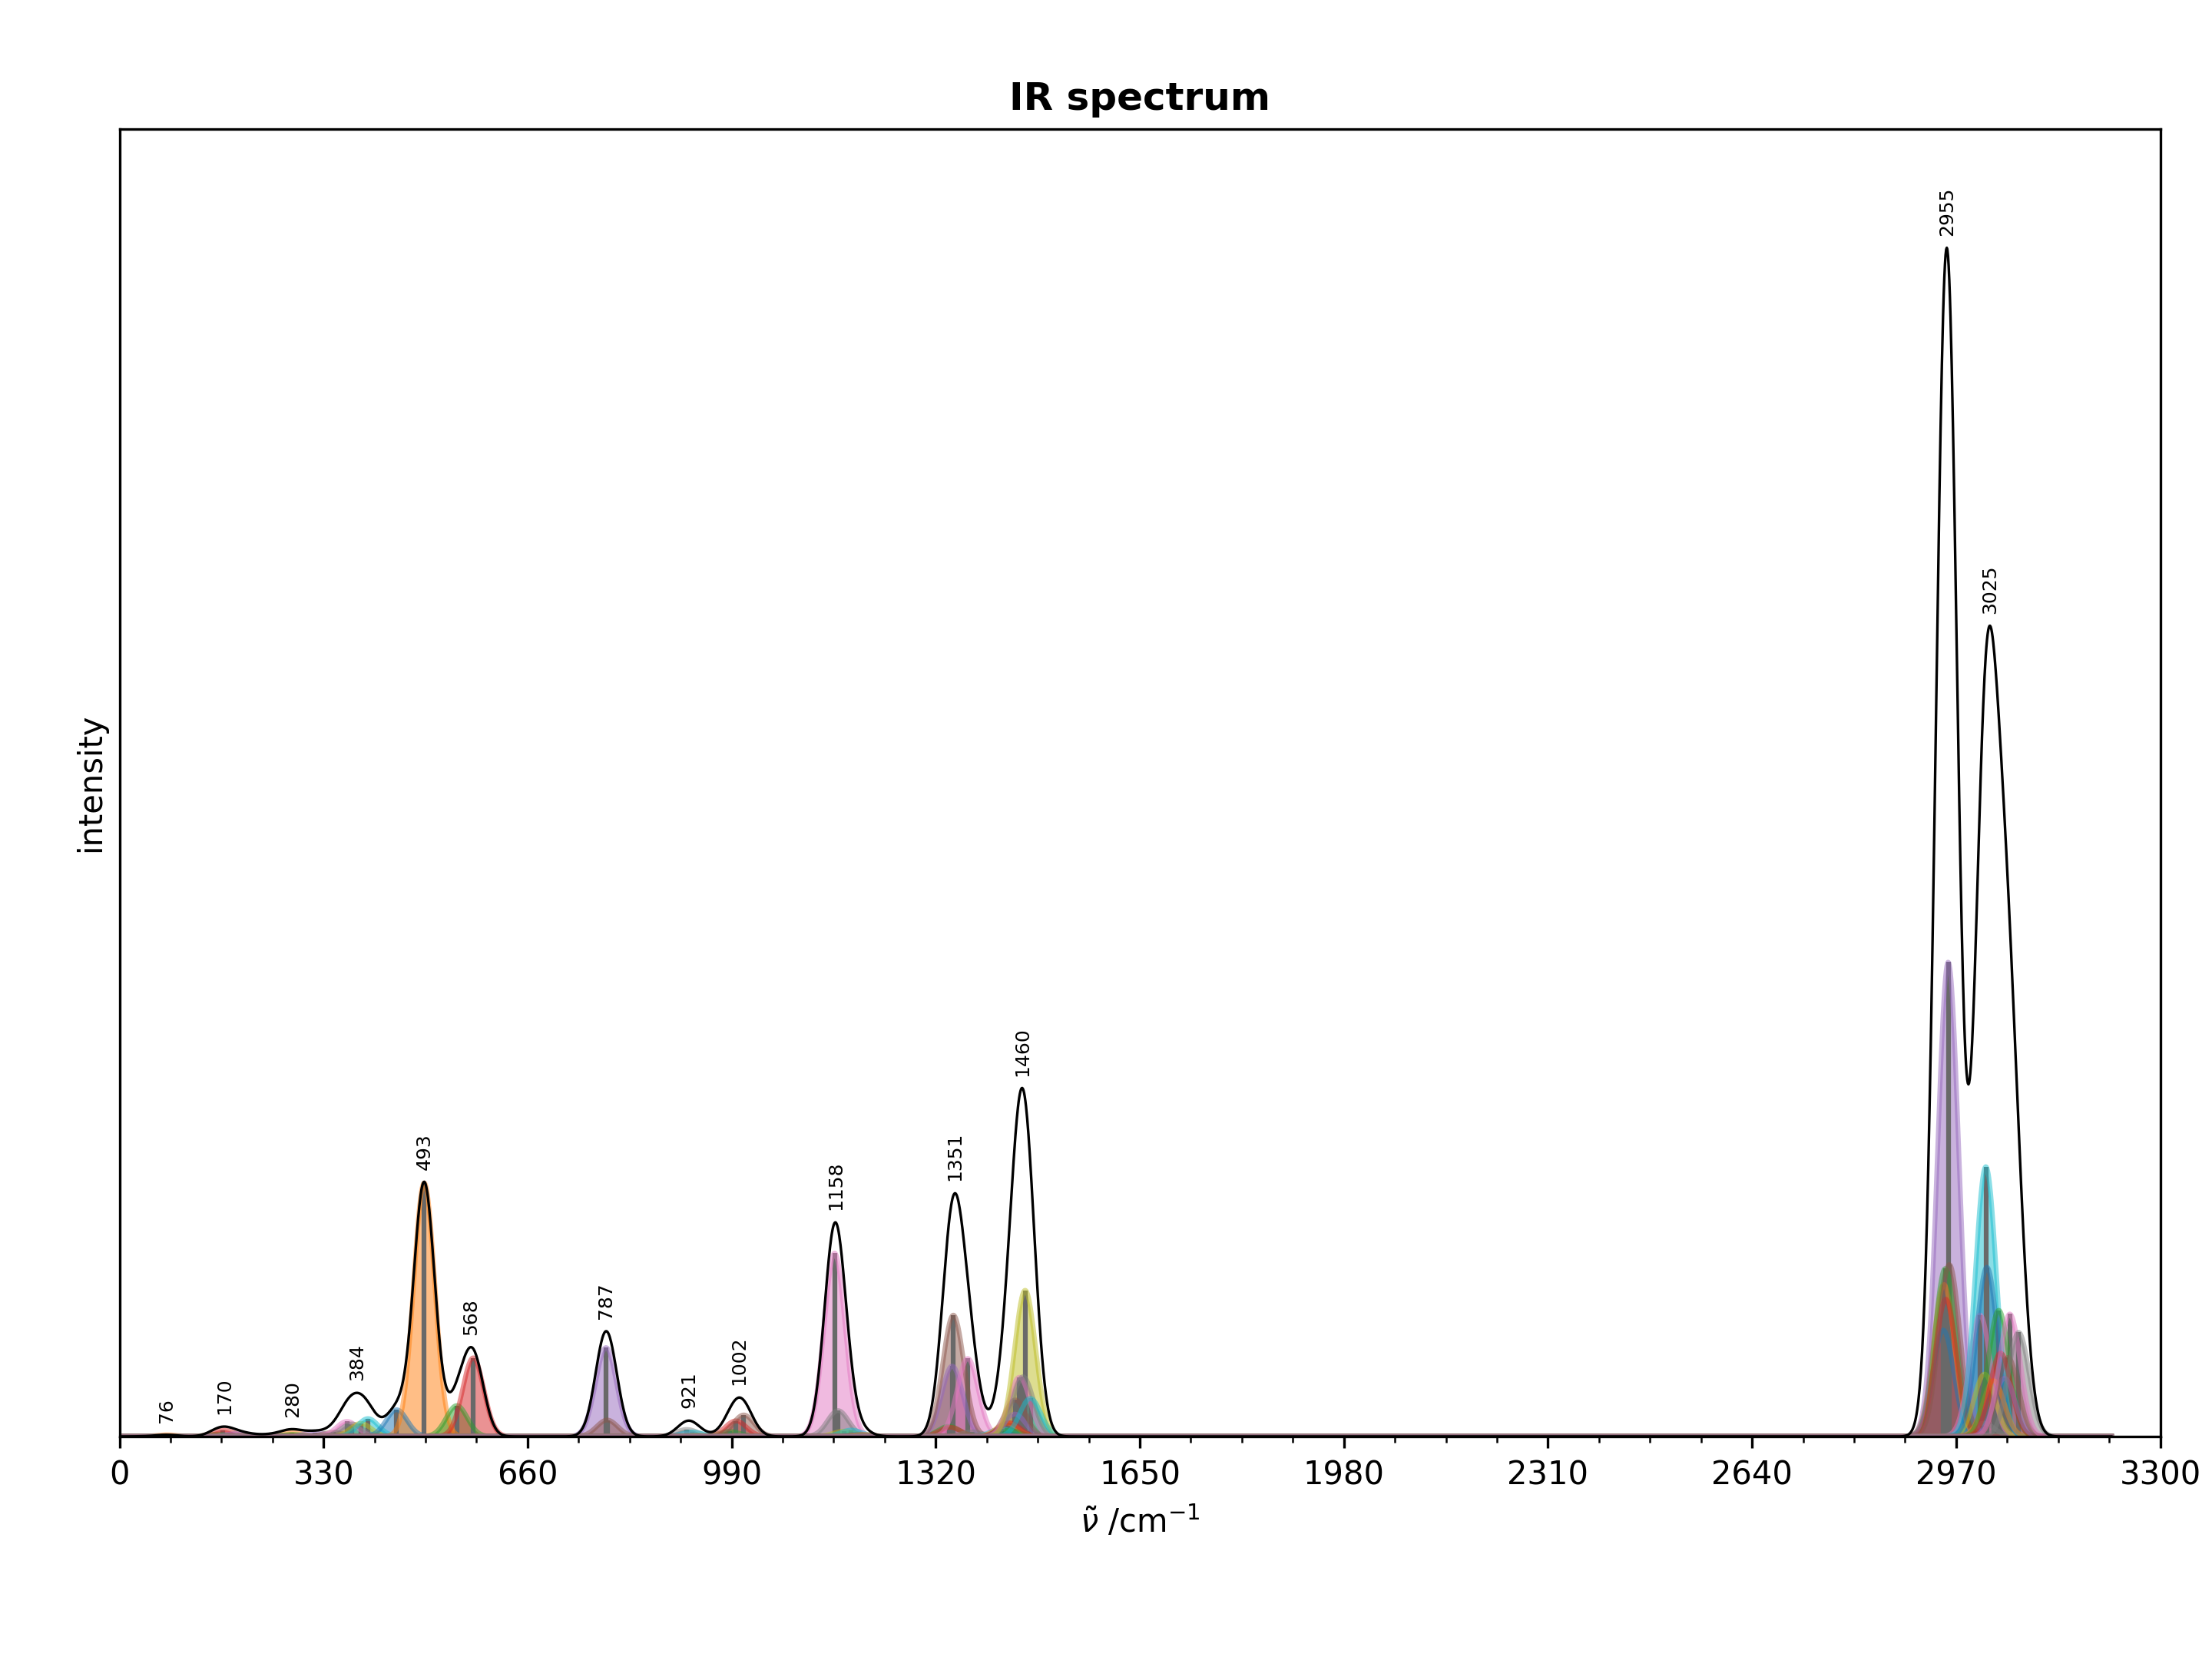
Plots IR spectra from from ORCA output files
Last updated Jun 25, 2026
23
Stars
4
Forks
0
Issues
0
Stars/day
Attention Score
52
Topics
Language breakdown
No language data available.
▸ Files
click to expand
README
[!TIP]
Trusty orca-ir.py is now available as a web app (thanks to AI)! Enjoy a brand-new interactive interface.
👉 Try it here: https://radi0sus.github.io/advancedorcair/
👉 Dive into the code.
orca-ir
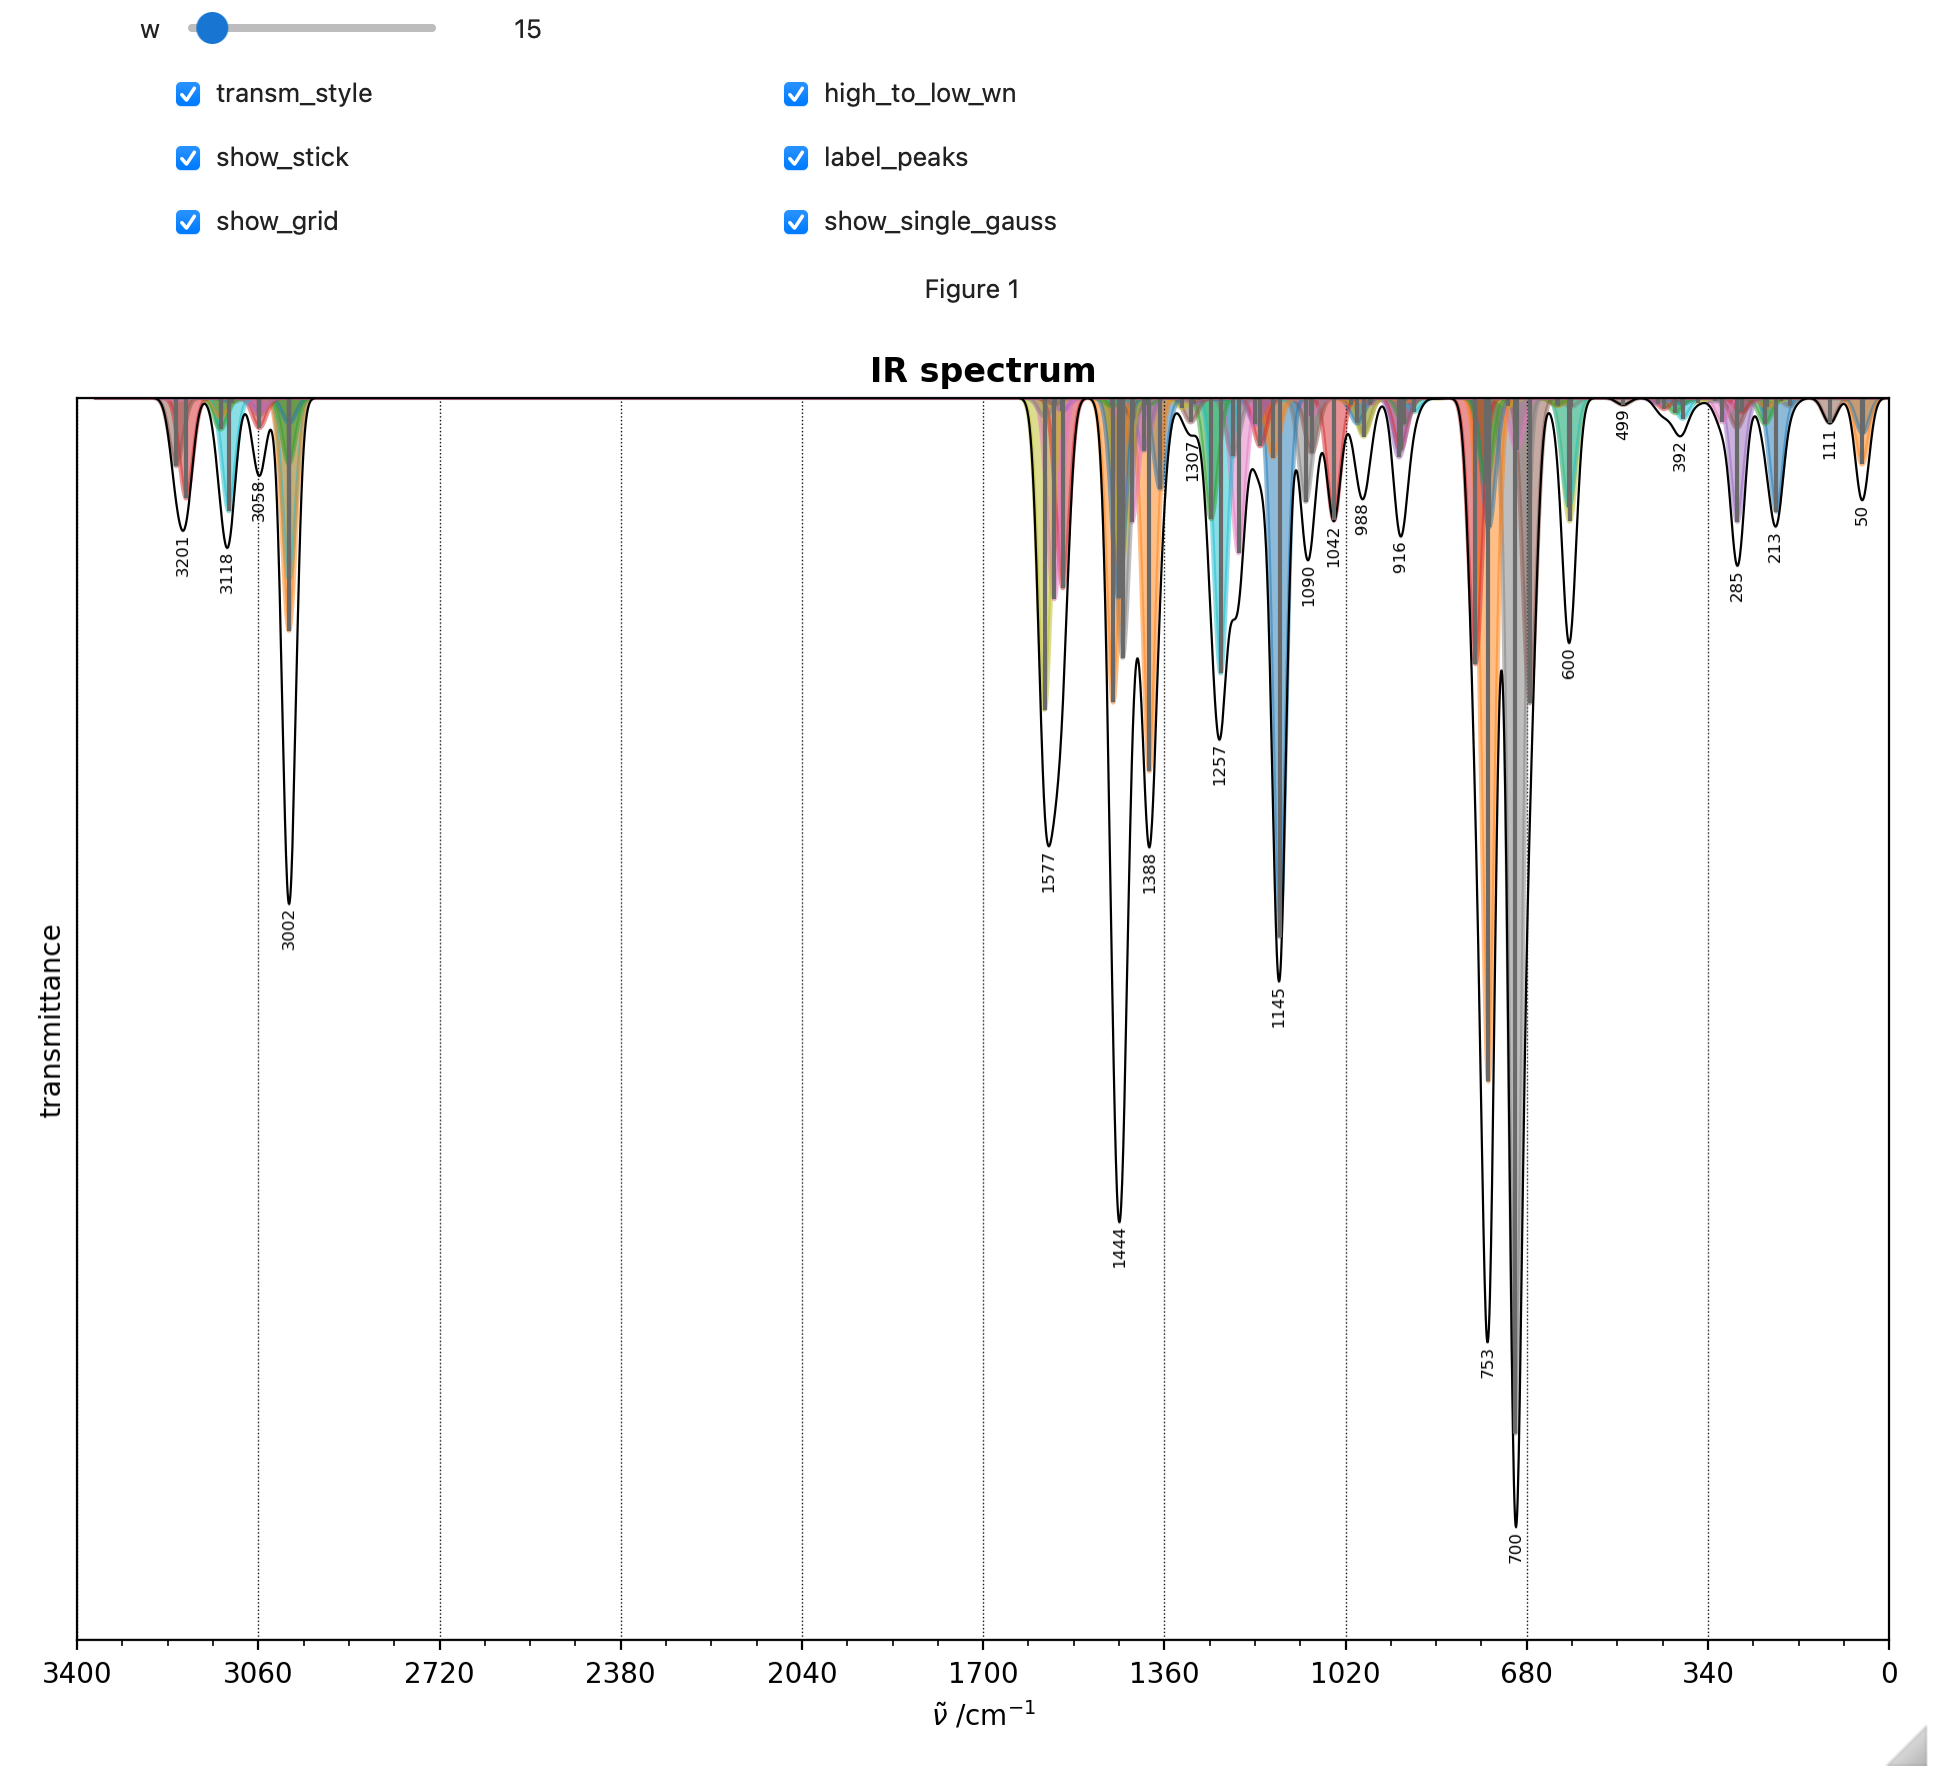
A Python 3 script for (hassle-free) plotting of IR spectra from ORCA output files with peak dectection and annotation. It combines the stick spectrum with the convoluted spectrum (gaussian line shape). The full spectrum or parts of the spectrum (via matplotlib window) can be plotted.Please also have a look at the interactive Jupyter Notebook edition. It offers almost the same functionality without the need to maintain a local Python installation. Please upload an orca.out file to the same directory and adjust the code to irdata = impdata('myorcacalcwithir_data.out'). Note: The interactive Matplotlib window does not work very well with colab. Replace %matplotlib widget with %matplotlib inline for a better performance. However, this change removes the ability to select a specific region and save the spectrum bitmap.
External modules
re
numpy
matplotlib
scipy
Quick start
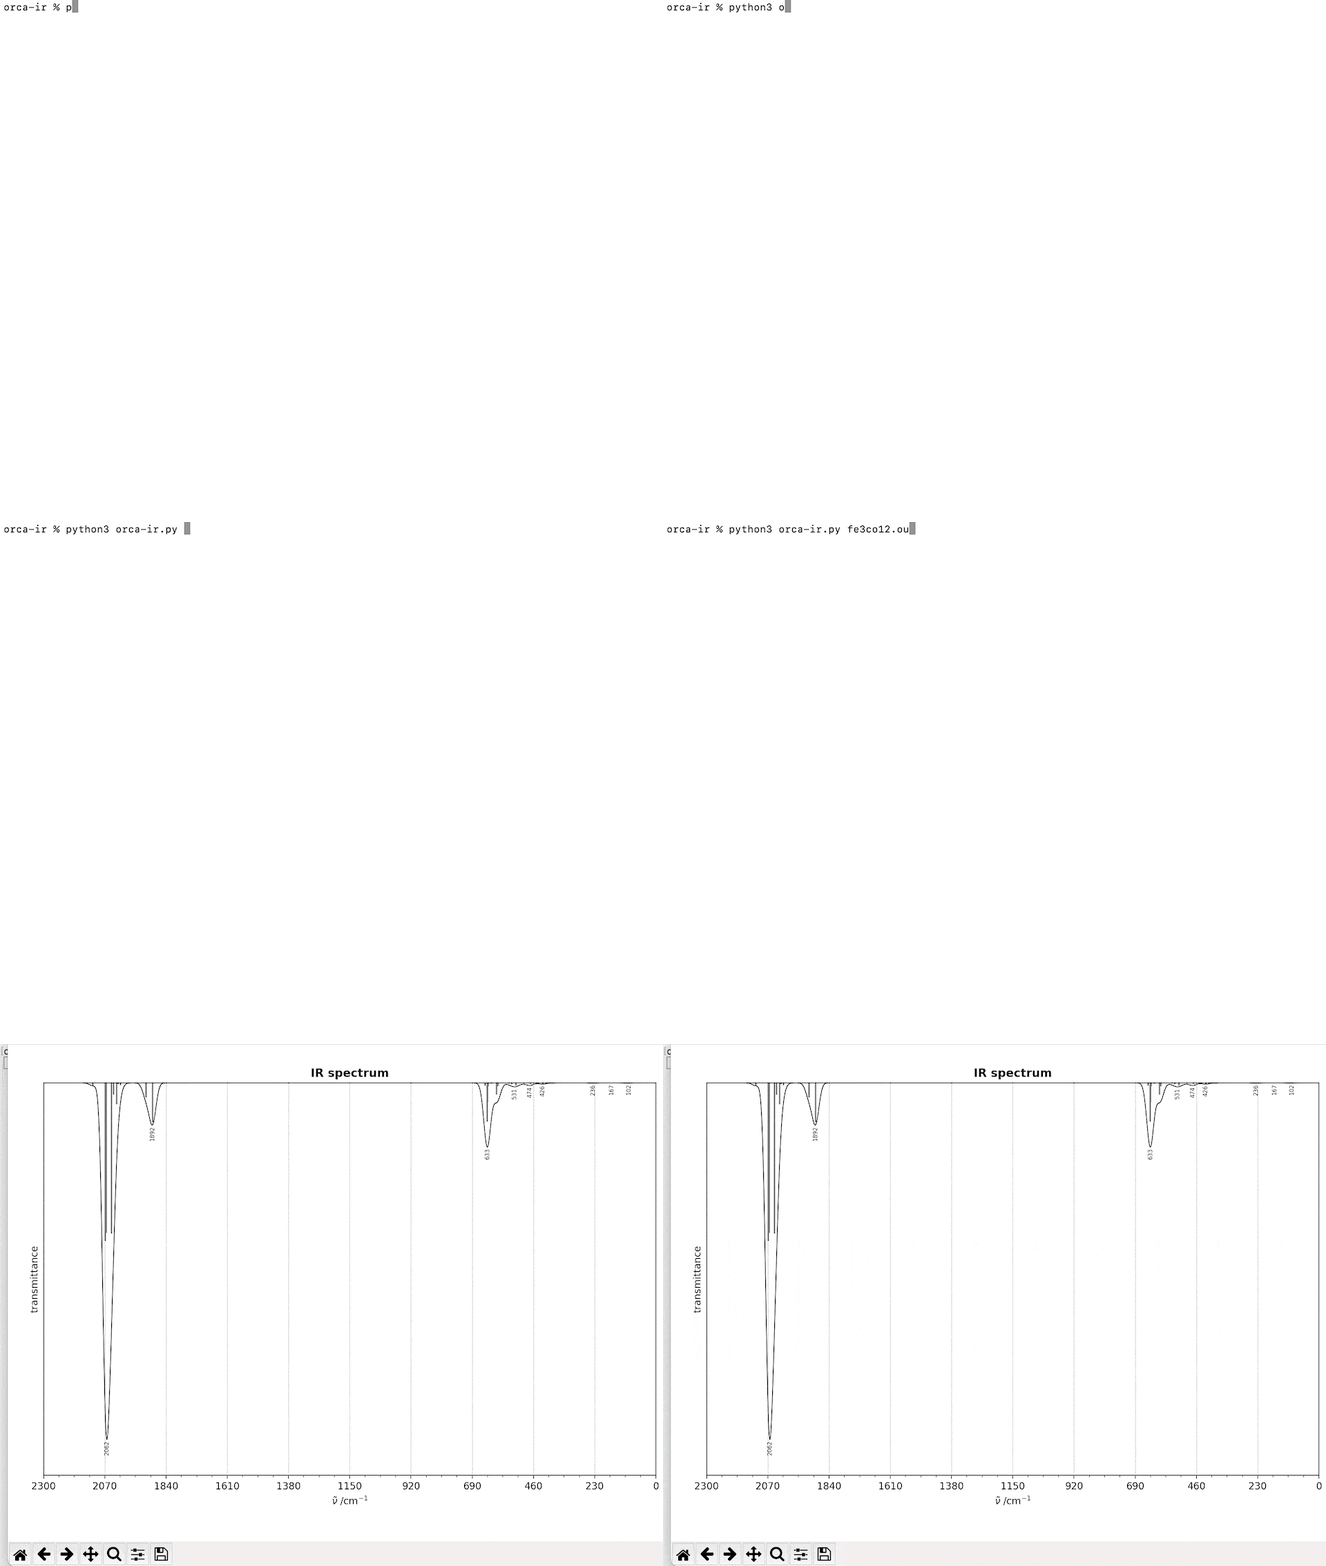
Start the script with:python3 orca-ir.py filenamefilename-ir.png
Command-line options
filename, required: filename-wN, optional: line width (in cm-1) of the gaussian (default isN = 15)-s, optional: shows thematplotlibwindow-n, optional: do not save the spectrum-e, optional: export the line spectrum in a csv-like fashion; filename of the export is input filename + "-mod.dat"
Script options
There are numerous ways to configure the spectrum in the script: Check# plot config section - configure here in the script.
Here, you can configure an absorption or transmittance plot for example.
You can even configure the script to plot of the single gaussian functions.
The delimiter for the line spectrum export can be changed by changing the value of export_delim =.
Code options
Colors, line thickness, line styles, level of peak detection and more can be changed in the code directly.Remarks
The spectrum always starts at zero and ends at the maximum wave number. If you need only a part of the spectrum, you can start the script with:python3 orca-ir.py filename -sExamples: