
python Circos
pyCircos
Circos is one of the most popular software for visualizing genomic similarities and features. However, its execution process is complicated and requires multiple original config files for the visualizations. Additionally, Circos is written in Perl, which limits its integration with other software for biological analysis. On the other hand, Python has been applied for various biological software packages. Therefore, by combining these packages, researchers can complete most of the required analysis. Nevertheless, Python lacks a library for drawing Circos plots, even though Circos software has been developed for more than a decade. Here, we provide a python Matplotlib based circular genome visualization package '"pyCircos." Users easily and quickly visualize genomic features and comparative genome analysis results by specifying annotated sequence files such as GenBank files.Join Our Team: Bioinformatics Researcher Wanted.
We are currently seeking a skilled researcher with expertise in bioinformatics to join our lab. For more details and to apply, please visit the following URL.Gallery
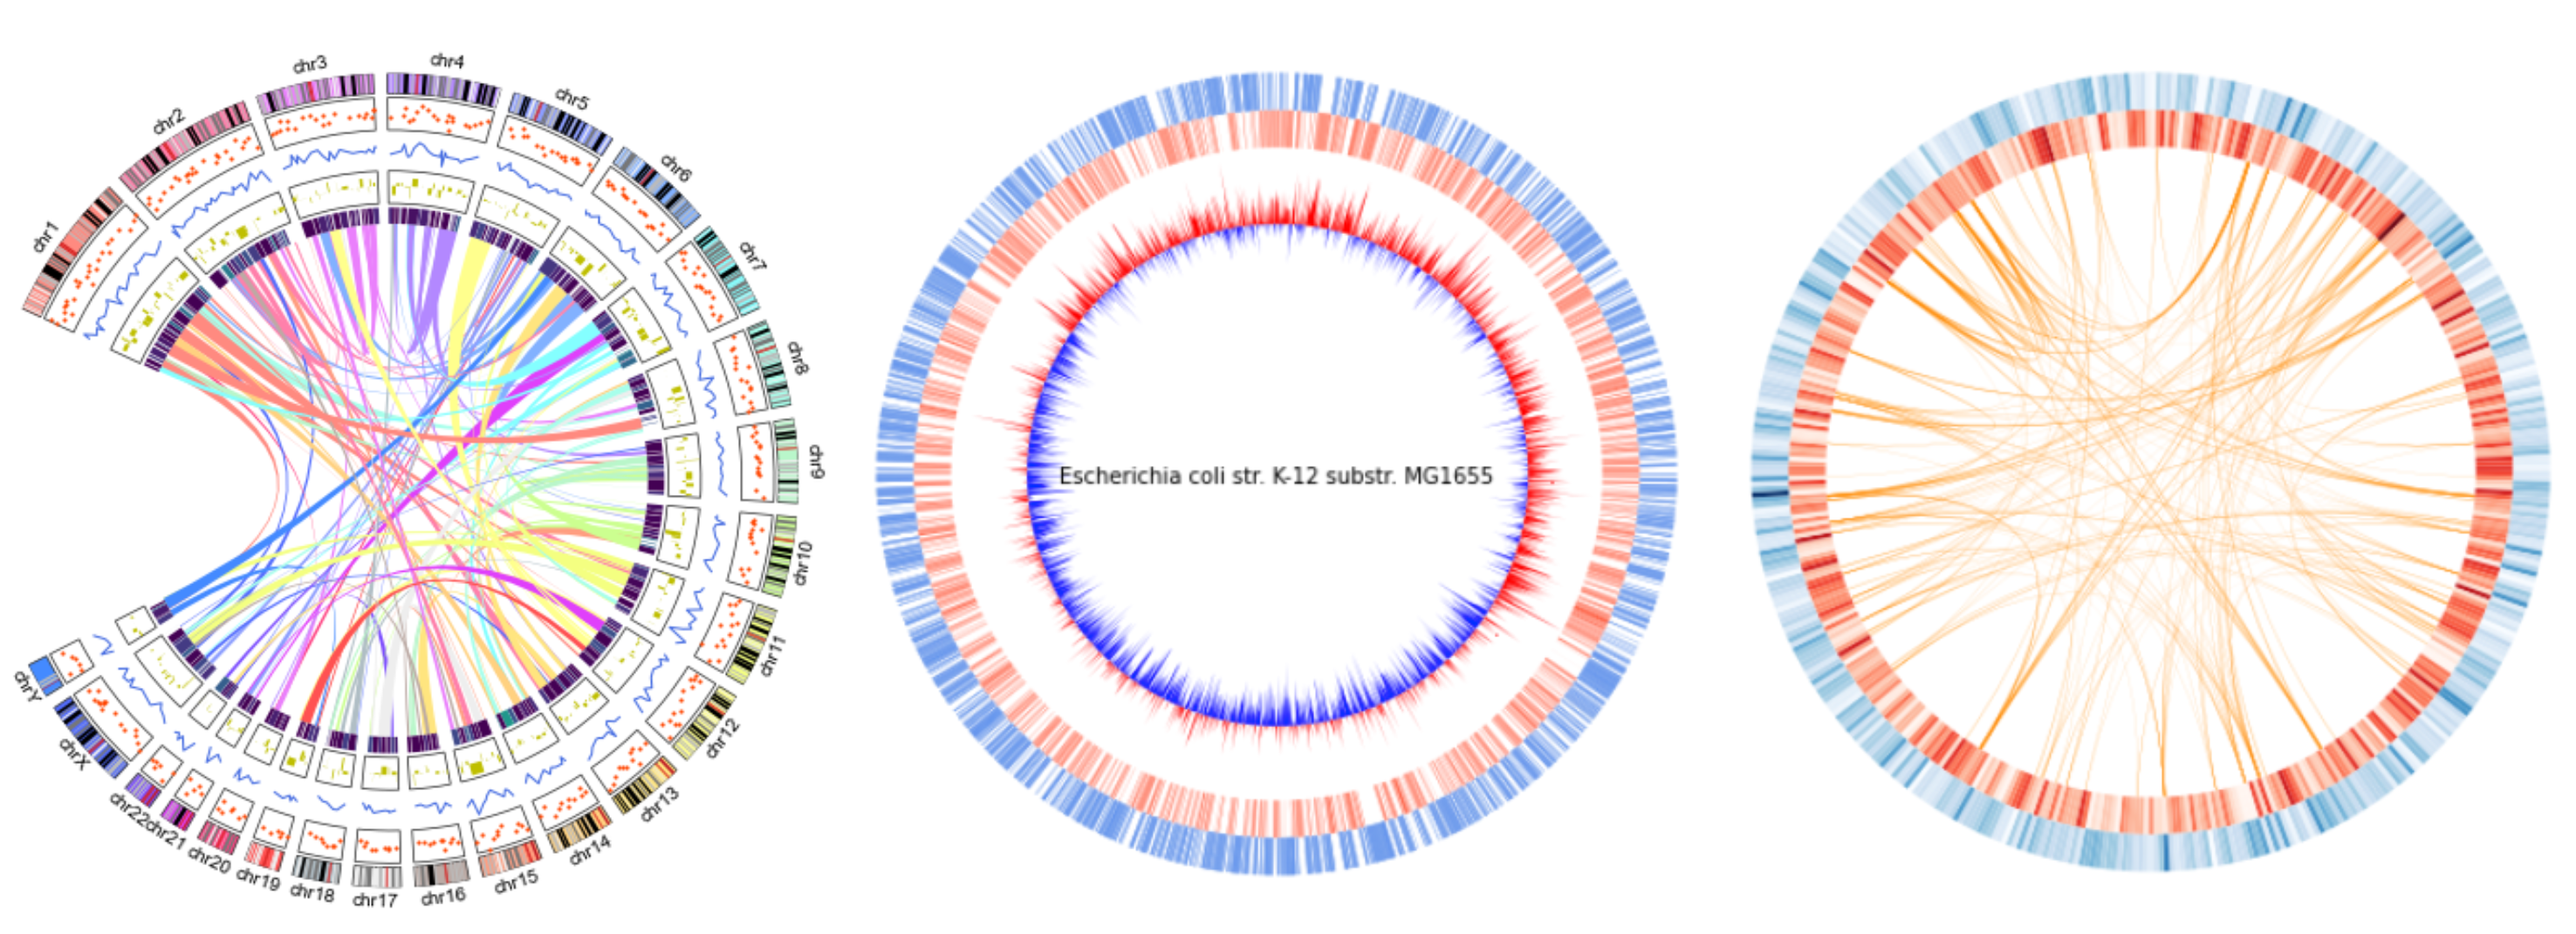
Dependencies
- python 3.7later
Installation
For normal users, we recommended you to install the official release as follows.pip install python-circos
If you want to use developmental version, it can be installed using the following single command: pip install git+https://github.com/ponnhide/pyCircos.git
Usage
pyCircos provides the “Gcircle class” and "Garc class". A "Gcircle" class object holds the dictionary of Garc class objefcts and provides functions to place Garc classs object on the circular map. Each Garc class object manages numeric and genomic data to be visualized on the circular map.
News
- Tutorial codes are moved to https://github.com/ponnhide/pyCircos-examples .
Version 0.3.0 is released.
- Tarc class and Tcircle class are added.
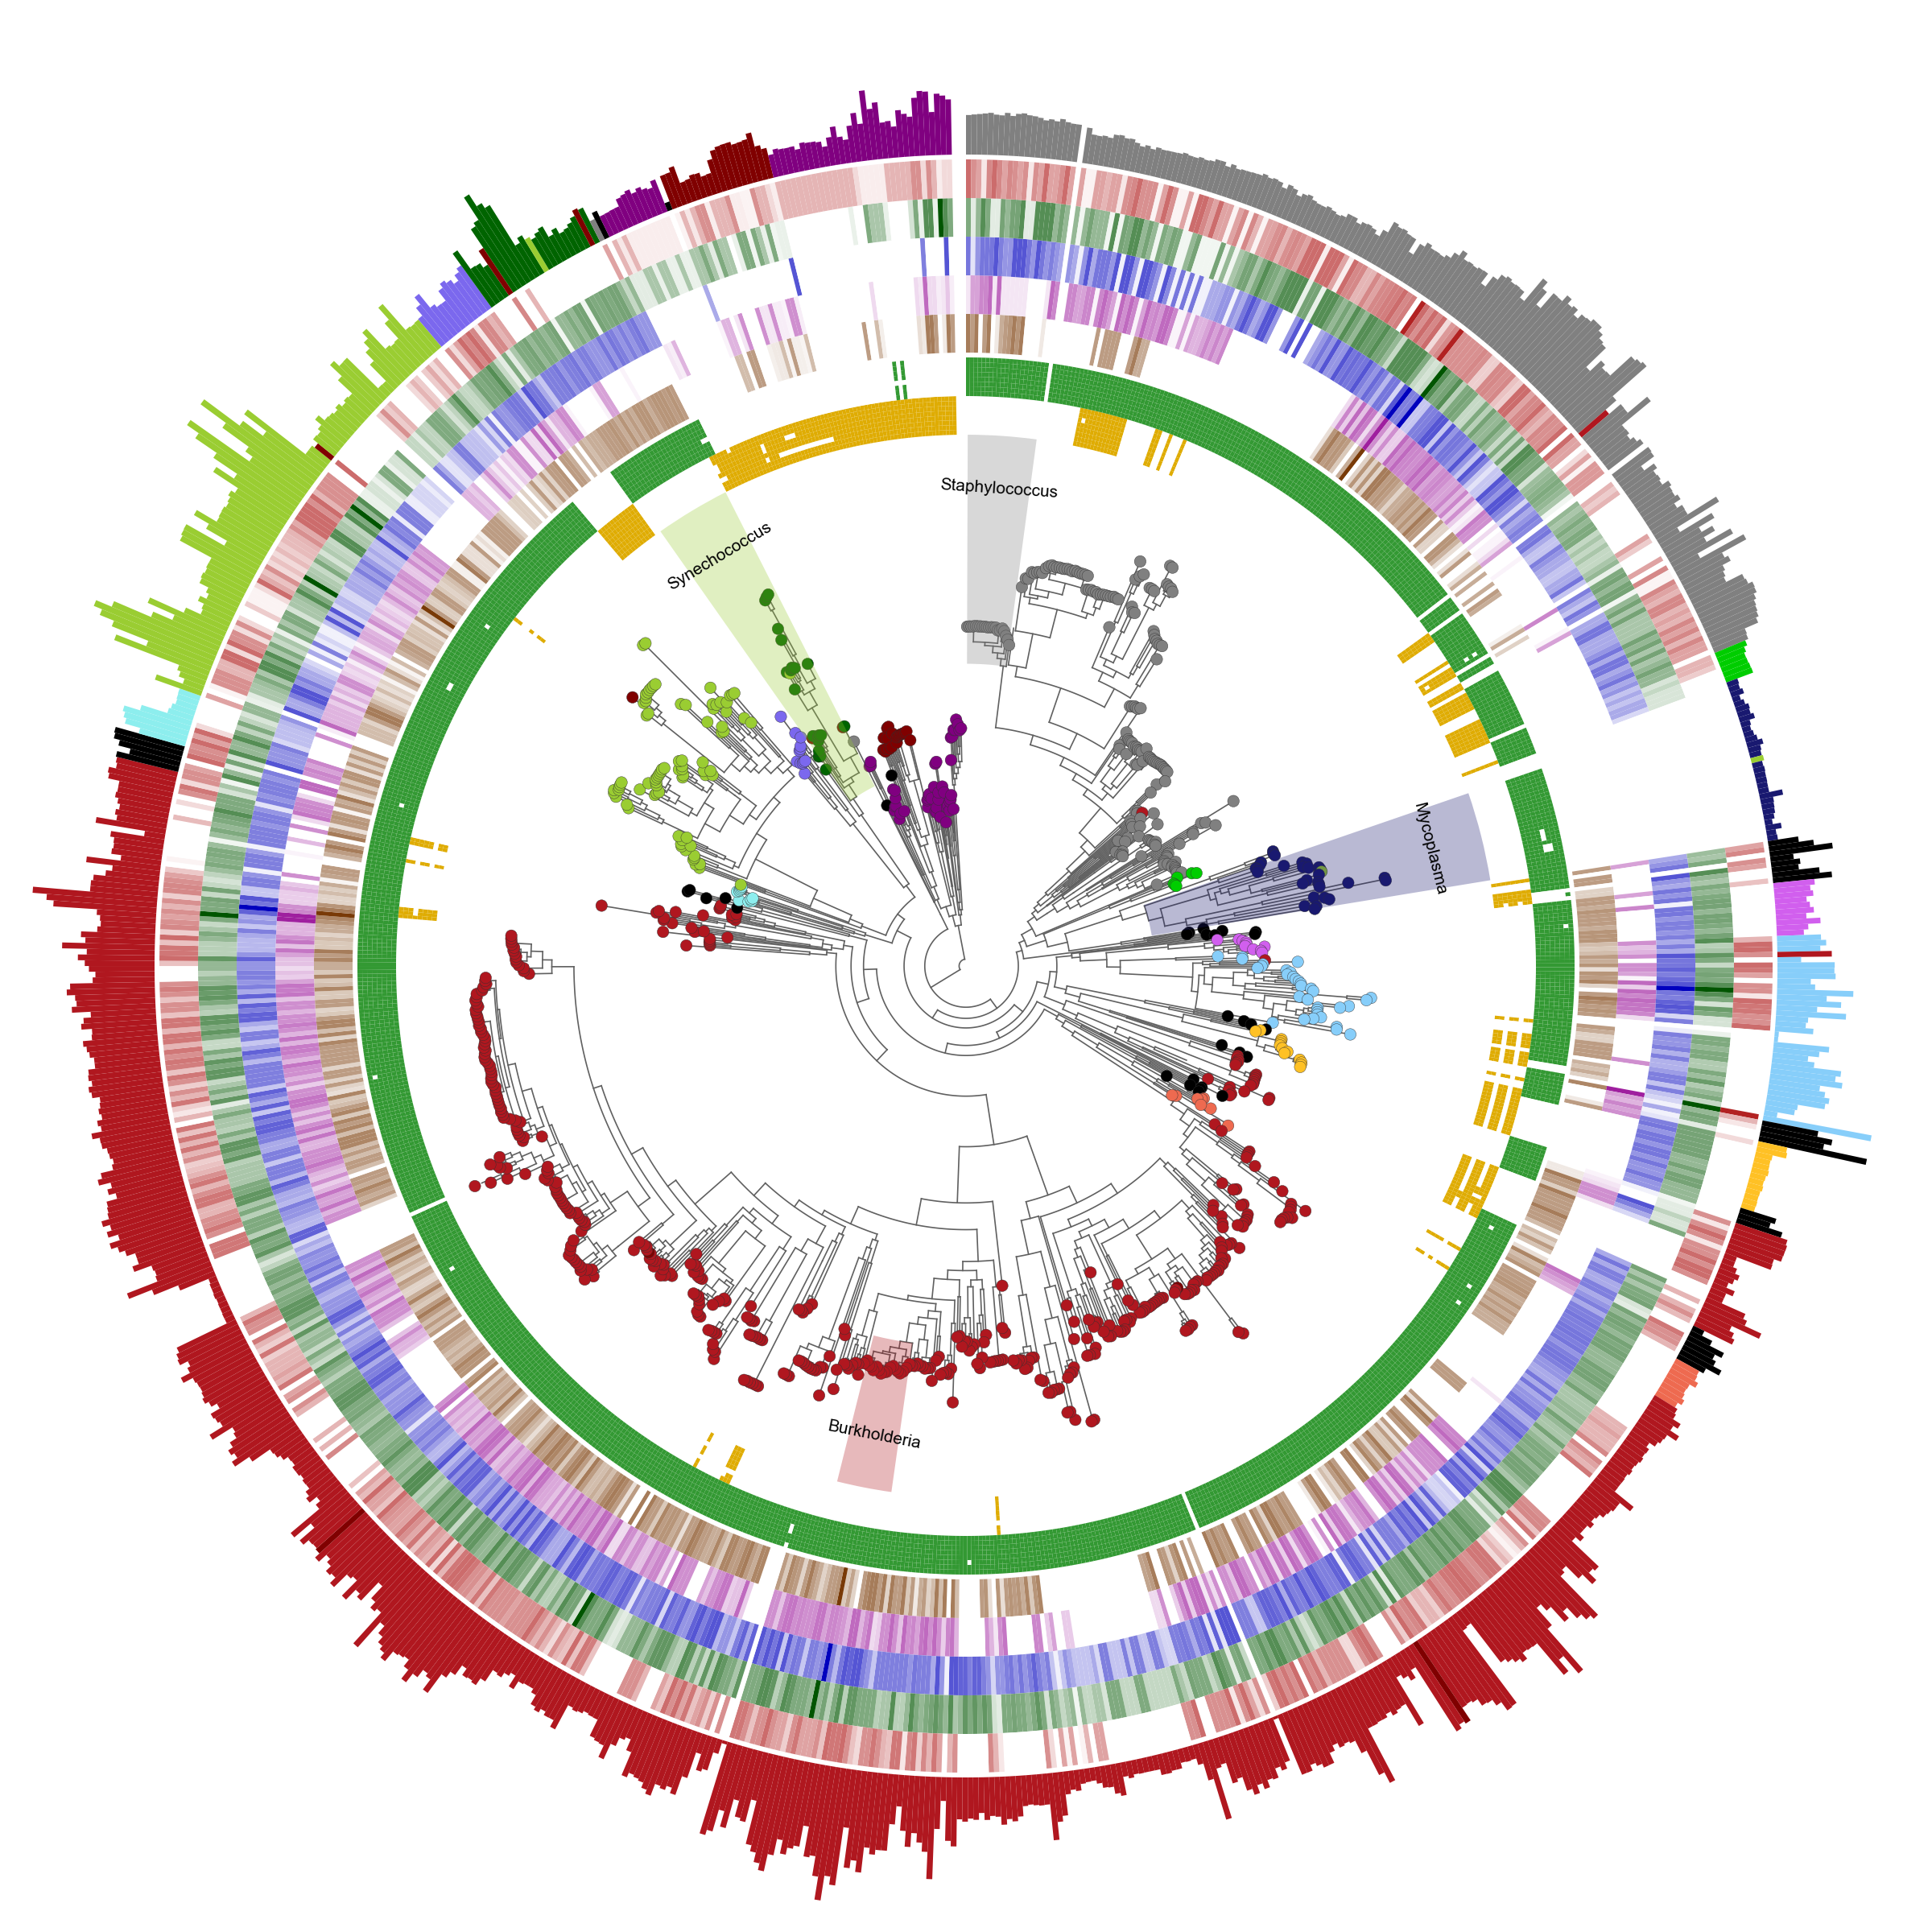
You can execute the example code to draw the circular phylogenetic tee on the Google colab.
Version 0.2.0 is released. The
fig parameter is added for Gcircle.init, so it is now possible to specify your own figure object.
If you want to arrange multiple circos plots, I reccomend to use patchworklib. Please see the following example code. https://colab.research.google.com/drive/1tkn7pxRqh9By5rTFqRbVNDVws-o-ySz9?usp=sharing
Example result of multiple circos plots 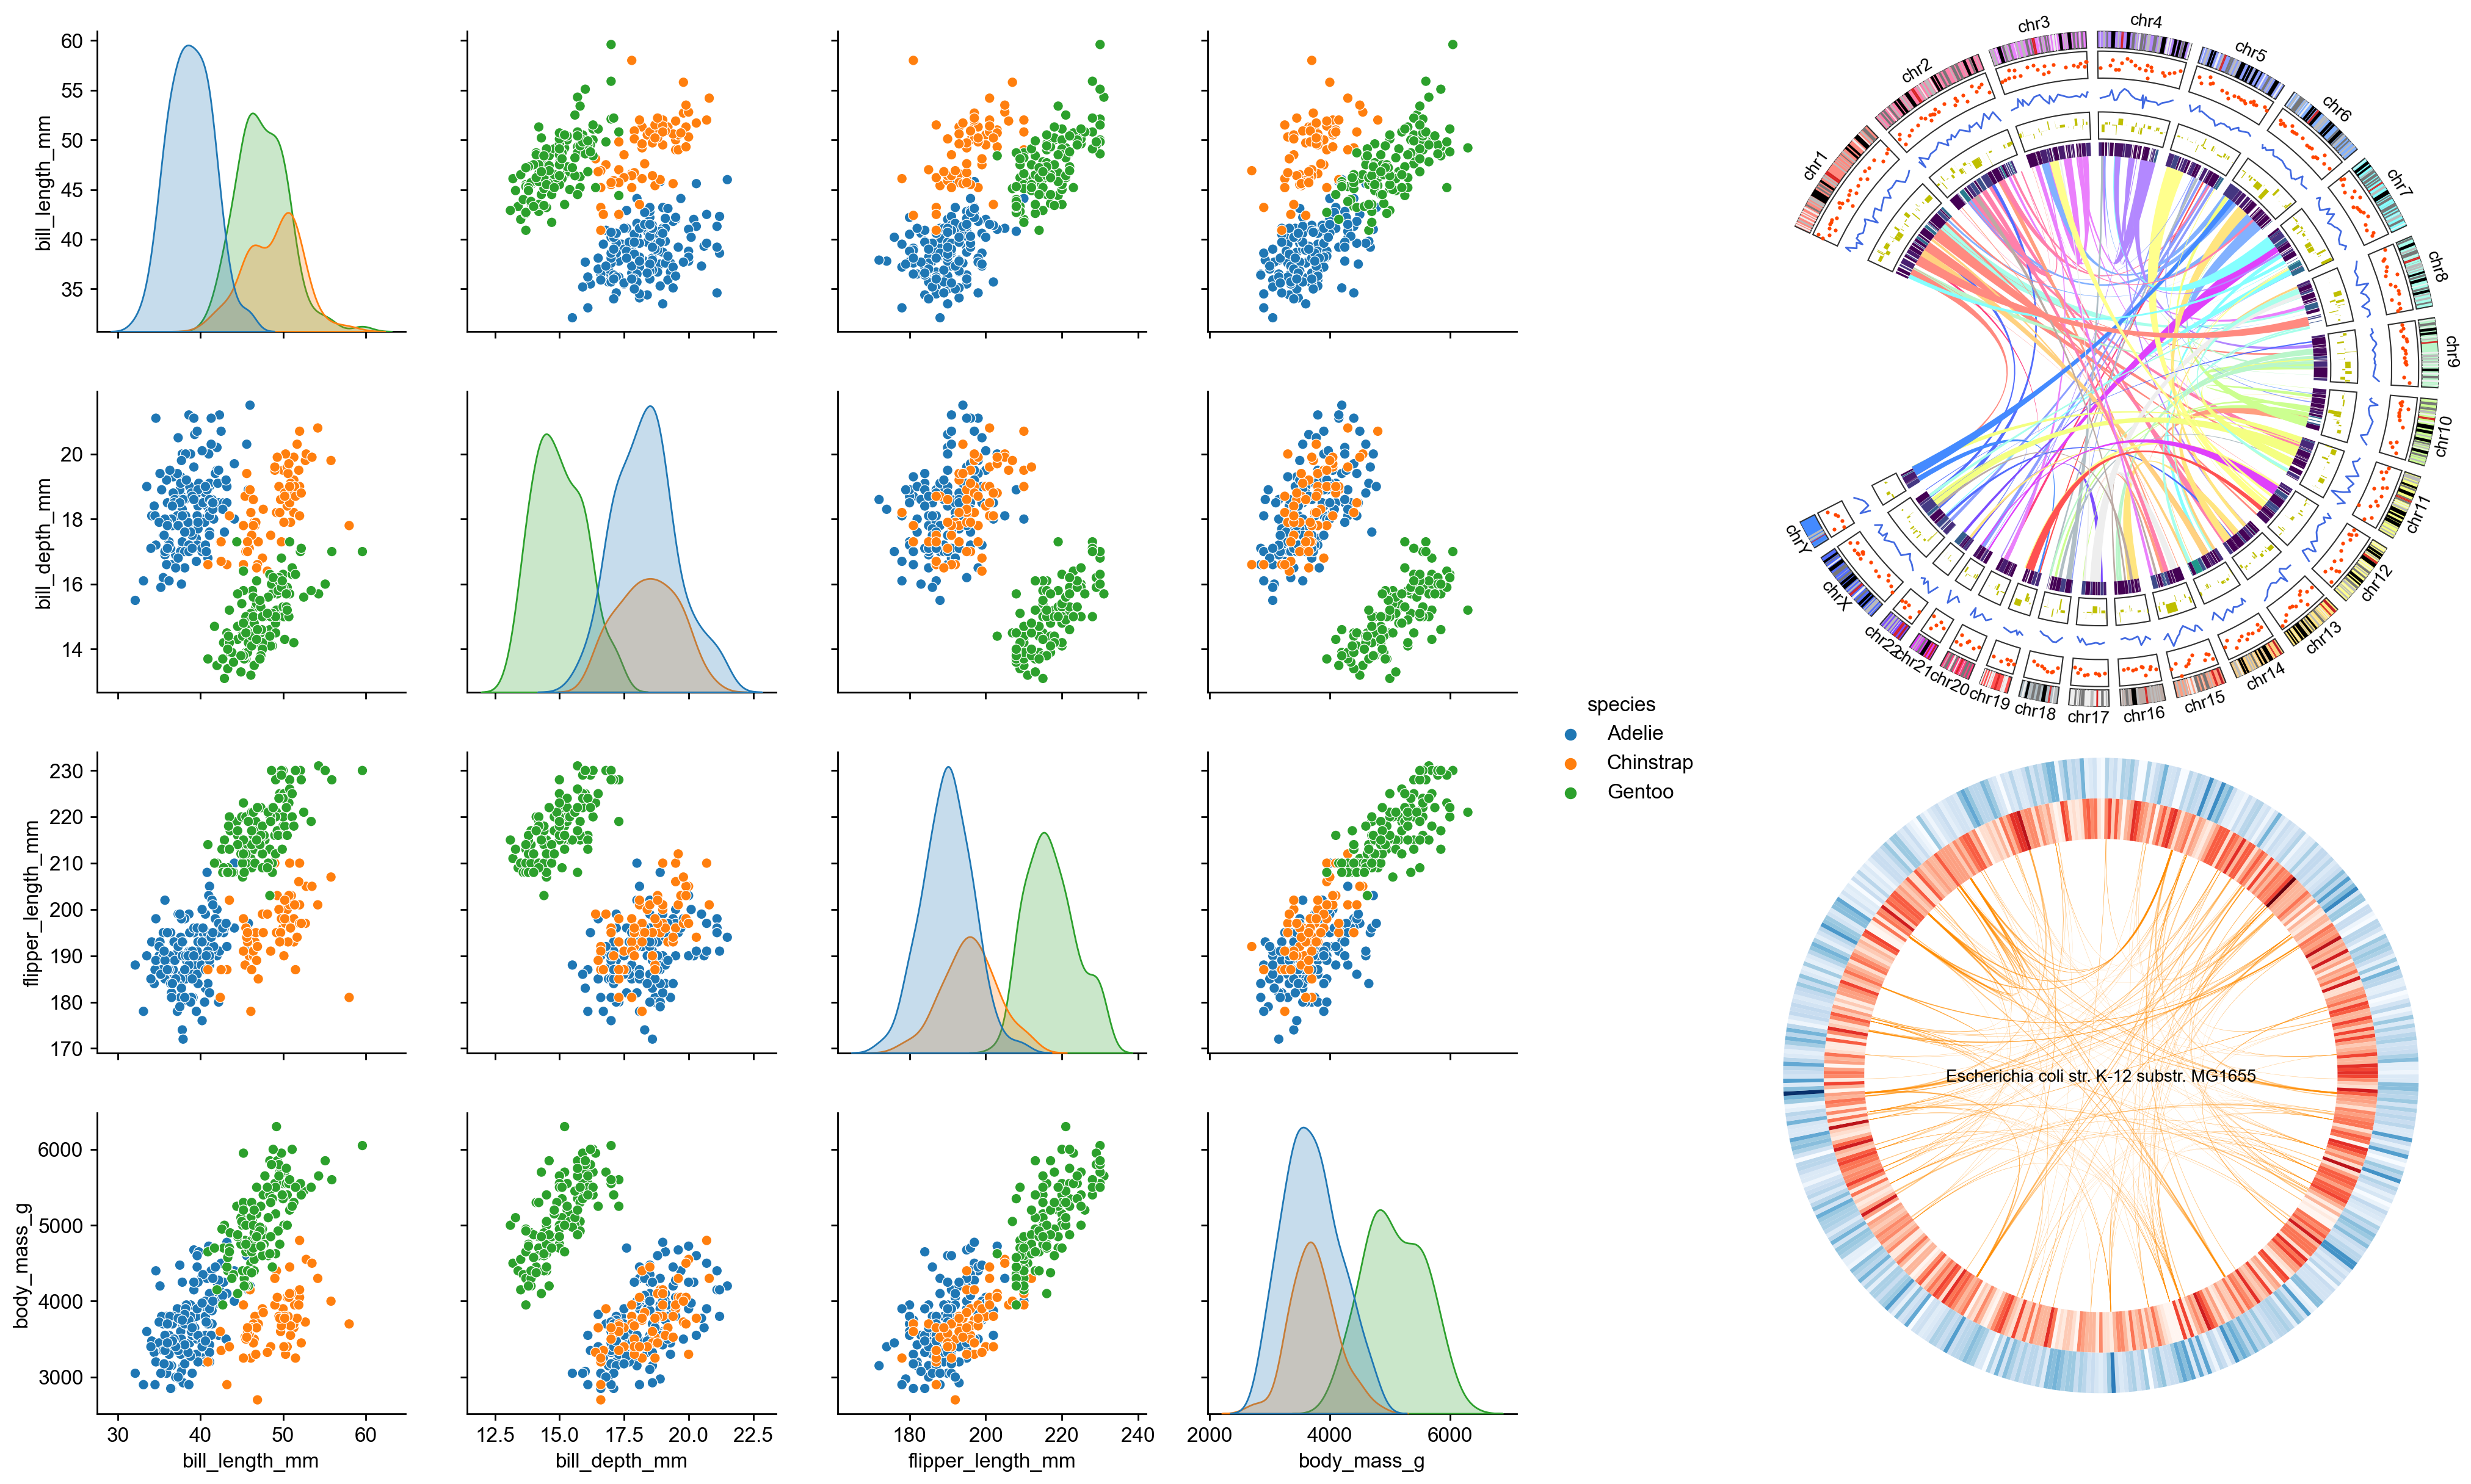
Gcircle class
A Gcircle class object provides a circle whose diameter is 1000 (a.u.) as a drawing space. Any graph (line plot, scatter plot, barplot, heatmap, and chordplot) can be placed on the space by specifying the raxis\range_ (from 0 to 1000) and the corresponding Garc class object.
Parameters
- .garc_dict: dict (default:None)
- .figsize: tuple (dfault:)
Methods
- .addgarc (garcobject=Garc class object)
- .set_garcs(start=0, end=360)
- .lineplot (garcid=str, data=list or numpy.ndarray , positions=list or numpy.ndarray, raxisrange=tuple, rlim=tuple, linestyle=str, linecolor=str or tuple, linewidth=int*)
- garc_id: str (defaut: None) ID of the Garc class object. The ID shoud be in Gcircle object.garc_dict. - data: list or numpy.ndarray (default: None) Numerical data to be drawn with line. - positions: list or numpy.ndarray (default: None) The x coordinates of the values in data on the Garc class object when the plot is drawn on the rectangular coordinates. Each coordinate value should be in the range 0 to size of the Garc class object specified by garc_id. By the method execution, the coordinates are converted to proper angle coordinates. If positions are not given, proper coordinates values are generated according to the length of data. - raxis_range: tuple (top=int, bottom=int) (default: (550, 650)) Radial axis range where line plot is drawn. - rlim: tuple (top=int, bottom=int) (default: (min(data), max(data))) The top and bottom r limits in data coordinates. If rlim value is not given, the maximum value and the minimum value in data will be set to top and bottom , respectively. - linestyle: str (default: "solid") Line style. Possible line styles can be reffered from https://matplotlib.org/stable/gallery/linesbarsand_markers/linestyles.html - linecolor: str or tuple representing color code (default: None) Color of the line plot. If linecolor value is not given, the color will be set according to the default color set of matplotlib. To specify the opasity for a line color, please use (r, g, b, a) or #XXXXXXXX format. - linewidth: float (default: 1) Line width.
return None
- .fillplot (garcid=str, data=list or numpy.ndarray , positions=list or numpy.ndarray, raxisrange=tuple, rlim=tuple, base_value=float, facecolor=str or tuple, linecolor=str or tuple, linewidth=int)
- garc_id :str (defaut: None) Same parameter with garc_id of lineplot(). - data: list or numpy.ndarray (default: None) Same parameter with data of lineplot(). - positions: list or numpy.ndarray (default: None) Same parameter with positions of lineplot(). - raxis_range: tuple (top=int, bottom=int) (default: (550, 650)) Same parameter with raxis_range of lineplot(). - rlim: tuple (top=int, bottom=int) (default: (min(data), max(data)) Same parameter with rlim of lineplot(). - base_value: float (default: 0) Base line height in data coordinates. The area between the base line and the data line is filled by facecolor. - facecolor: str or tuple representing color code (default: None) Color for filling. - edgecolor: str or tuple representing color code (default: "#303030") Edge color of the filled area - linewidth: float (default: 0) Edge line width. return None
- .scatterplot (garcid=str, data=list or numpy.ndarray , positions=list or numpy.ndarray, raxisrange=tuple, rlim=tuple, markershape=str, facecolor=str or tuple, edgecolor =str or tuple, linewidth=int, markersize=int)
- garc_id :str (defaut: None) Same parameter with garc_id of lineplot(). - data: list or numpy.ndarray (default: None) Numerical data to be drawn by scatter plots. - positions: list or numpy.ndarray (default: None) Same parameter with positions of lineplot(). - raxis_range: tuple (top=int, bottom=int) (default: (550, 650)) Same parameter with raxis_range of lineplot(). - rlim: tuple (top=int, bottom=int) (default: (min(data), max(data)) Same parameter with rlim of lineplot(). - makershape: str (default: "o") Marker shape. Possible marker shapes can be reffered from https://matplotlib.org/stable/gallery/linesbarsandmarkers/markerreference.html. - markersize: float or list of float (default: None) Size(s) of the marker(s). - facecolor: str, tuple representing color code or list of color code (default: None) Face color(s) of the markers. If value type is list, the lenght of facecolor should be the same as the data length. - edgecolor: str or tuple representing color code (default: None) Edge color of the markers - linewidth: float (default: 0) Edge line width of the markers return None
- .barplot (garcid=str, data=list or numpy.ndarray , positions=list or numpy.ndarray, width=float or list, raxisrange=tuple, rlim=tuple, base_value=int, faceolor=str or tuple, edgecolor=str or tuple)
- garc_id :str (defaut: None) Same parameter with garc_id of lineplot(). - data: list or numpy.ndarray (default: None) Numerical data to be drawn by bar plots. - positions: list or numpy.ndarray (default: None) Same parameter with positions of lineplot(). The center of the base bases become in positions. - width: float or list of float (default: garc\_object.size/len(data)) Width(s) of the bars. - raxis_range: tuple (top=int, bottom=int) (default: (550, 650)) Same parameter with raxis_range of lineplot(). - rlim: tuple (top=int, bottom=int) (default: (min(data), max(data)) Same parameter with rlim of lineplot(). - facecolor: str, tuple representing color code or list of color code (default: None) Facecolor(s) of the bars. If value type is list, the lenght of facecolor should be the same as the data length. - edgecolor: str or tuple representing color code (default: None) Edge color of the bars - linewidth: float (default: 1.0) Edge line width of the bars. return None
- .heatmap (garcid=str, data=list or numpy.ndarray, positions=list or numpy.ndarray, width=float or list, raxisrange=tuple, cmap=str, vmin=float, vmax=float)
return None
- .chordplot(arcloc1=tuple, arcloc2=tuple, facecolor=str or tuple, edgecolor=str or tuple, linewidth=int)
- arc_loc1: tuple (defaut: None) First data location of linked data. The tuple is composed of four parameters: arcid, edeposition1, edgeposition2, raxisposition edgeposition1 and edgeposition2 are the x coordinates on the Garc class object when the plot is drawn on the rectangular coordinates. raxis_position is base height for the drawing cord. - arc_loc2: tuple (defaut: None) Second data location of linked data. - facecolor: str or tuple representing color code (default: None) Face color of the link. - edgecolor: str or tuple representing color code (default: None) Edge color of the link. - linewidth: float (default: 0.0) Edge line width of the link. return None
- .featureplot (garcid=str, featuretype=str, soruce=list of Bio.SeqFeature object, raxis_range=tuple, faceolor=str or tuple)
Tcircle class
Tcircle class is the subclass of Gcircle. All methods implemented in the Gcircle class also can be used. Then, the two additional methods settarc, plottree and plot_highlight is provided in the Tcircle class.
Methods
- .add_tarc(tarc=str):
return None
- .plottree(tarcid=str, rlim=tuple, cladevisualdict=dict, highlightdict=dict, linecolor=str, linewidth=float):
return None
- .plottree(tarcid=str, highlight_dict=dict):
return None
Garc class
A Garc class object can be created by
()Parameters
- arc_id: str (default None)
- record: Bio.SeqRecord class object or NCBI accession number (default: None)
- size: float (default: 1000)
- interspace: float (default: 0)
- raxis_range: tuple (top=int, bottom=int) (default: (500, 550))
- facecolor: str or tuple representing color code (default: None)
- edgecolor: str or tuple representing color code (default: "#303030")
- linewidth: int (default: 0)
- label: str (default: arc_id)
- labelposition: int (default:0)
- labelsize: int (default:0)
- label_visible: bool (defaule: False)
Methods
The Garc class object provides some analytical methods to support users analyze genomic characters.- .calcdensity(positions=list, windowsize=int)
- .calcnnratio(n1=str, n2=str, windowsize=int, step_size=int)
- .calcnnskew(n1=str, n2=str, windowsize=int, step_size=int)
Example code
Prease see the notebooks in the 'tutorial' directrory. I also provide the executable tutorial codes in Google Colaboratory.- tutorial1: https://colab.research.google.com/drive/1xmAnv7AHWUTA2HWfjqV1lFWkFMSLJHG0?usp=sharing
- tutorial2: https://colab.research.google.com/drive/1RYSo4aXpDIZlSQ9EhO2kPCeF8FOwyvXv?usp=sharing
- tutorial3: https://colab.research.google.com/drive/1EPxCQCgOouVxtXcGyxu2ZqQvfucVnOJ-?usp=sharing
- tutorial4 (Drawing pylogenetic tree): https://colab.research.google.com/drive/140m2jpQpgSZwSlP-3u3Oj8IcJUbP2NGD?usp=sharing


