
Streamlining statistical analysis by using plotting keywords in Python.



plotastic: Bridging Plotting and Statistics
[//]:<== Installation =========================================================>
📦 Installation
Install from PyPi:
bash
pip install plotastic
Install from GitHub: (experimental, check CHANGELOG.md)
bash
pip install git+https://github.com/markur4/plotastic.git
Requirements
- Python >= 3.11 (not tested with earlier versions)
- pandas == 1.5.3 (pingouin needs this)
- seaborn <= 0.12.2 (later versions reworked hue)
📷 Example Gallery
(click to unfold)
🐁 Click on Images for Code! 🐁
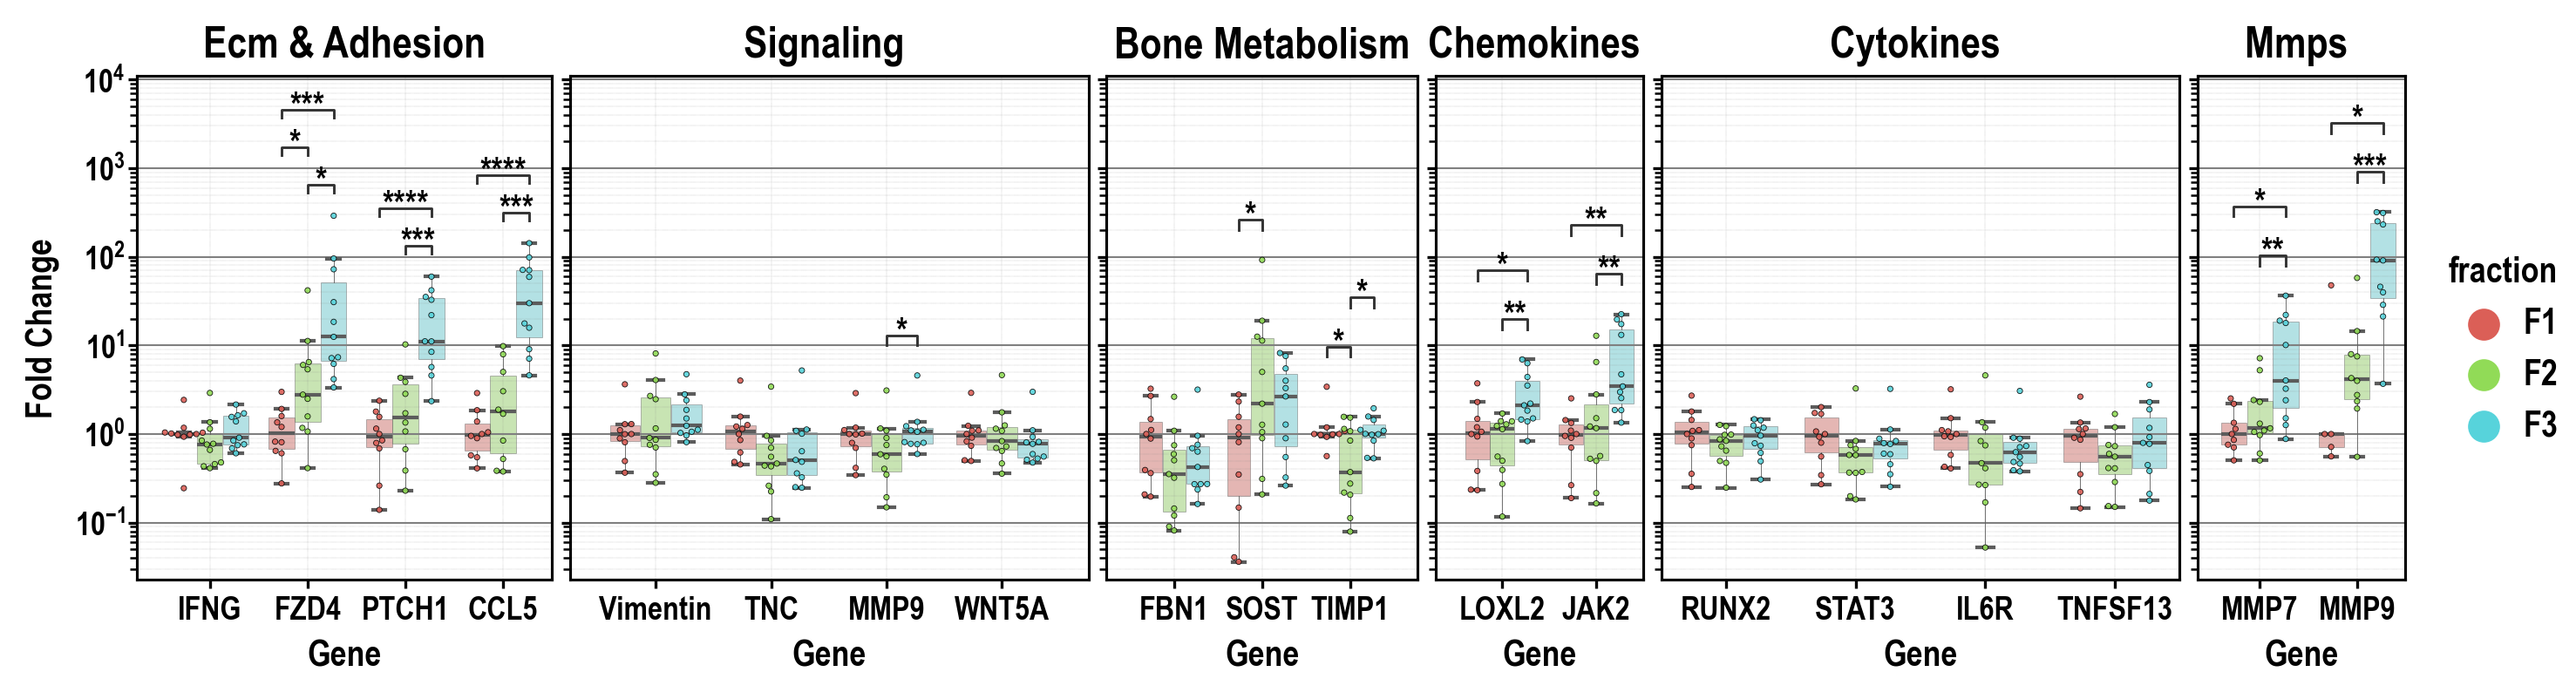
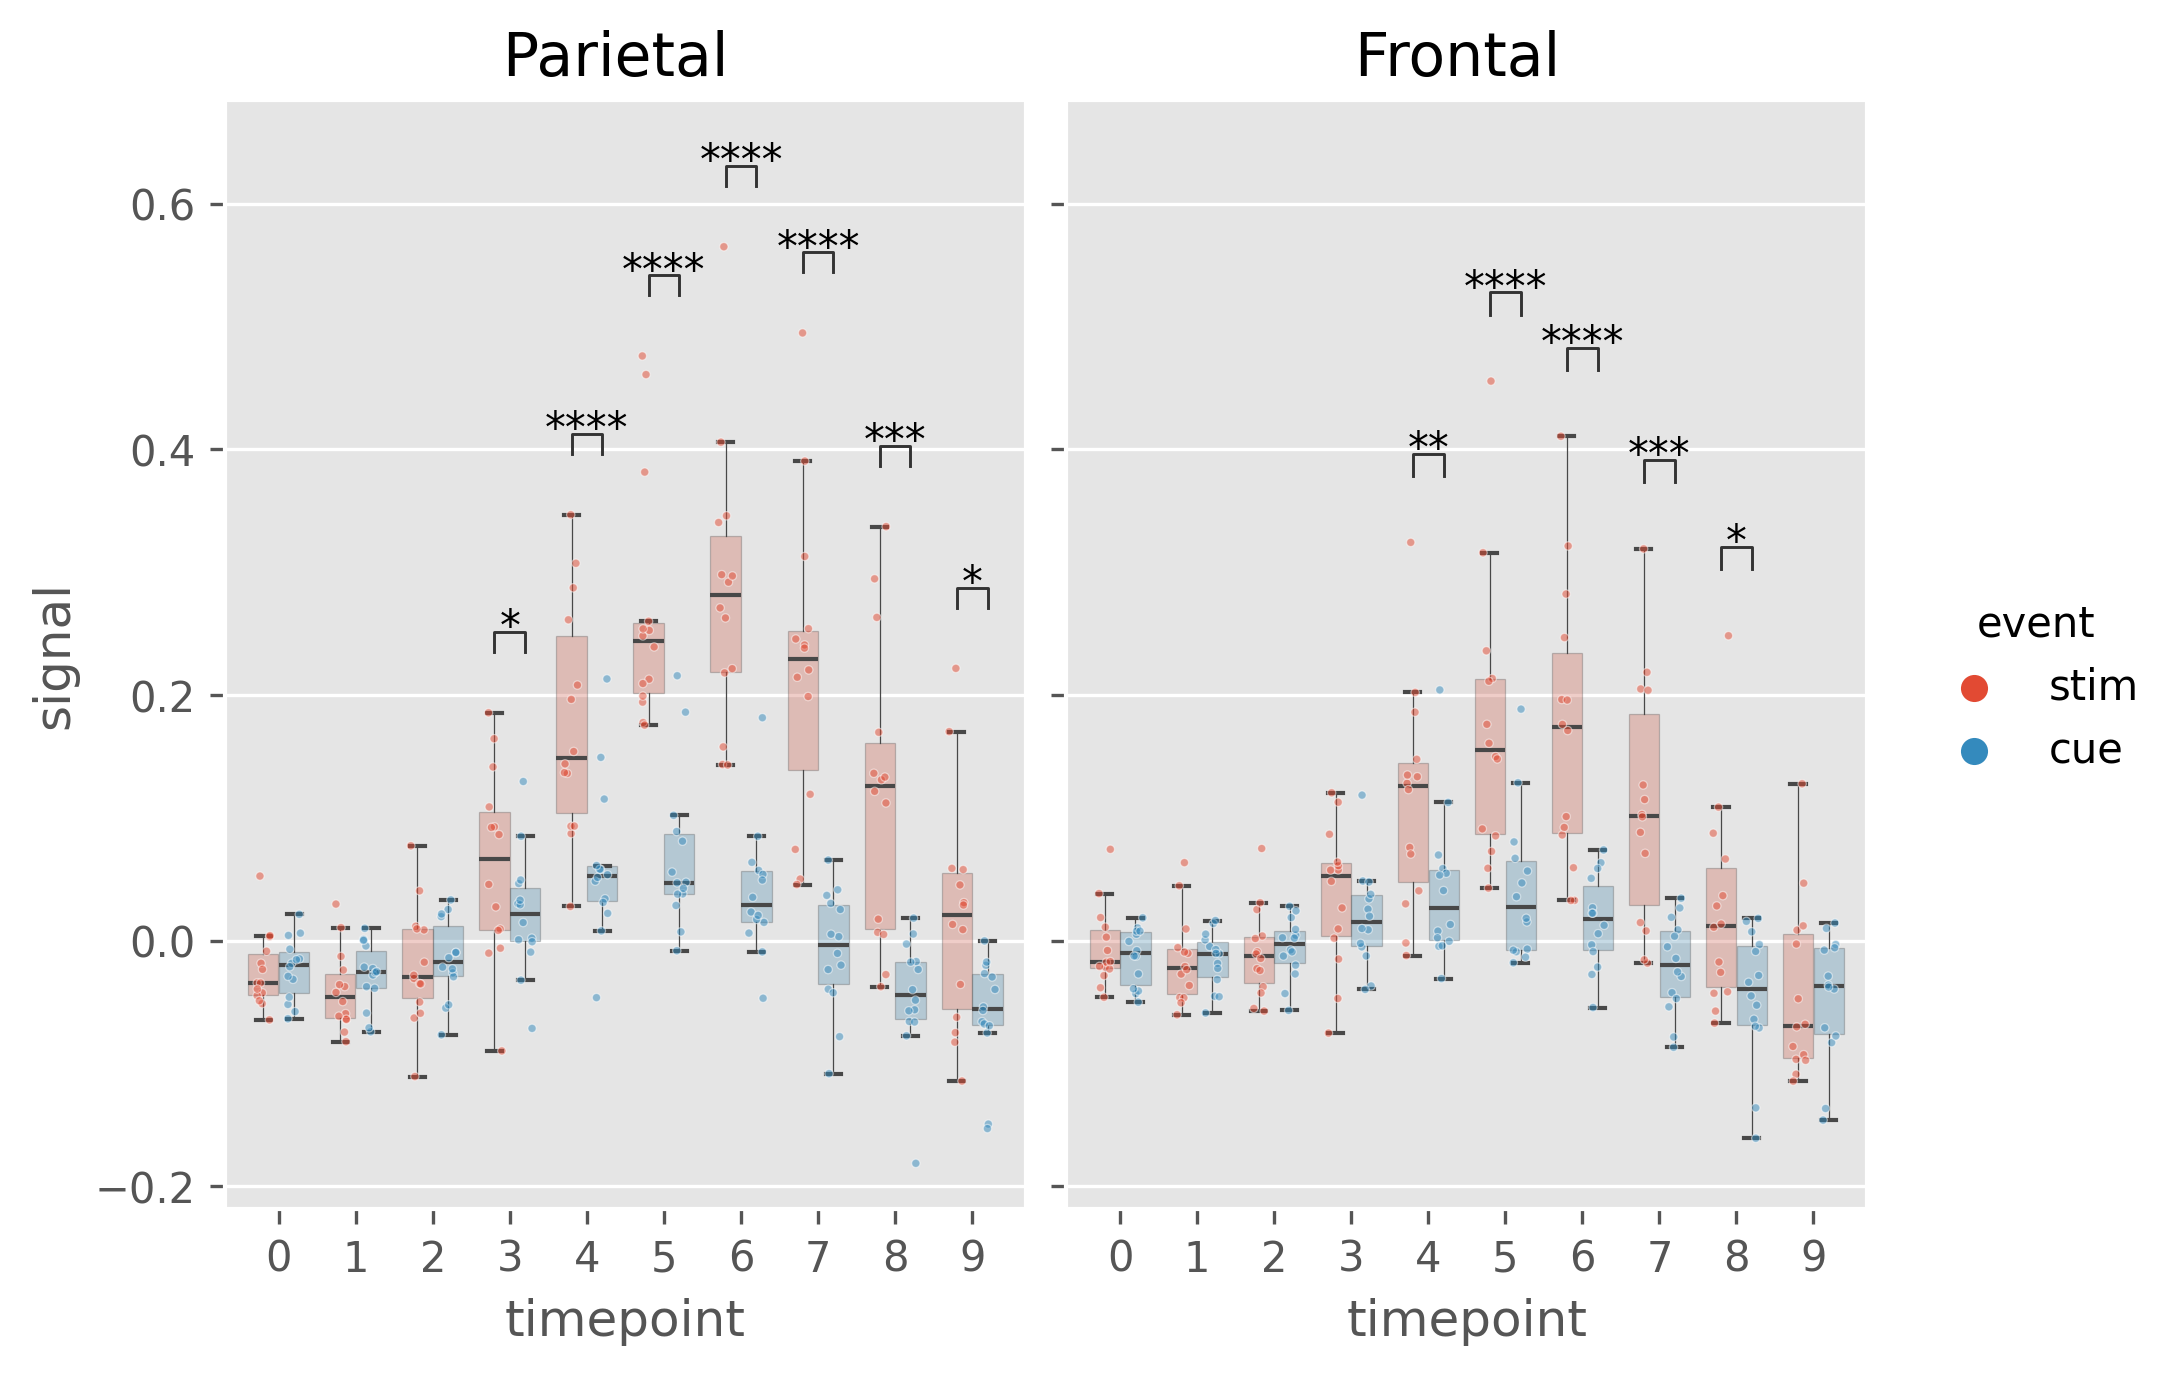
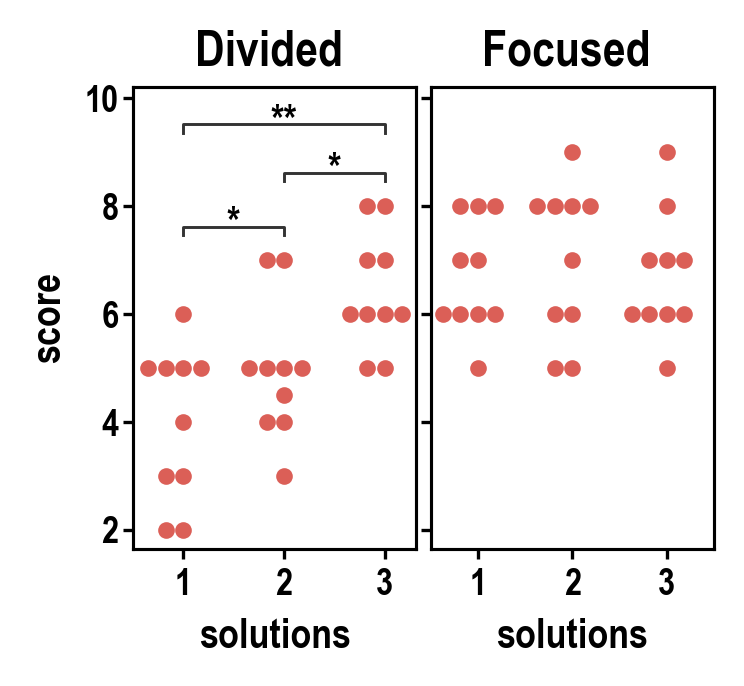
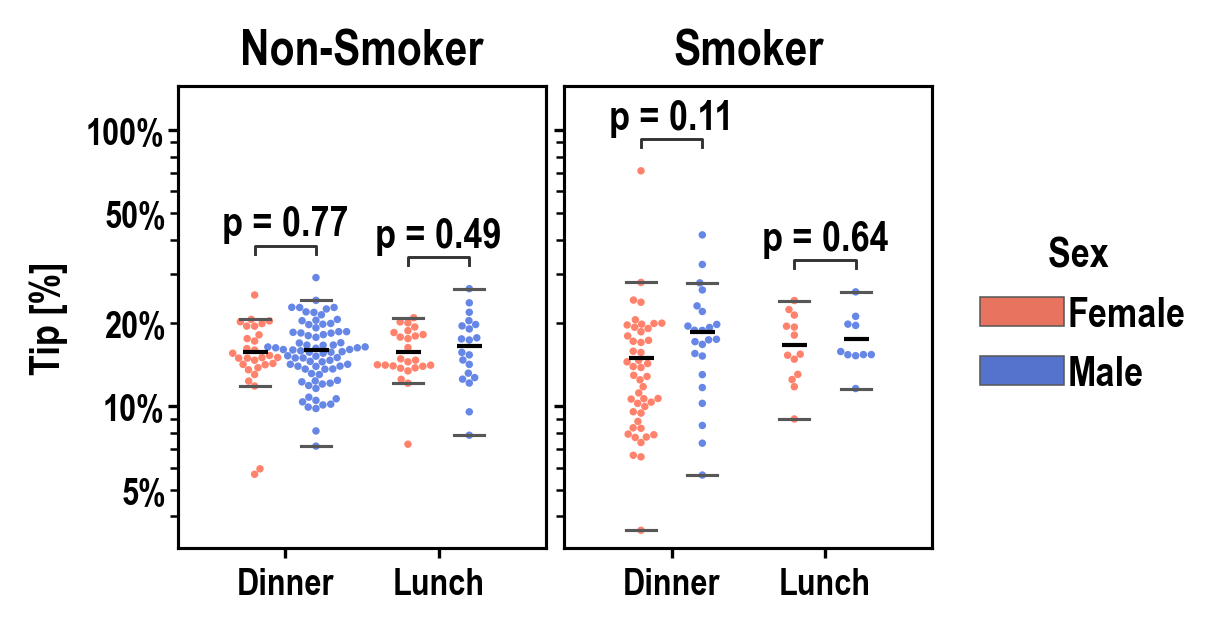
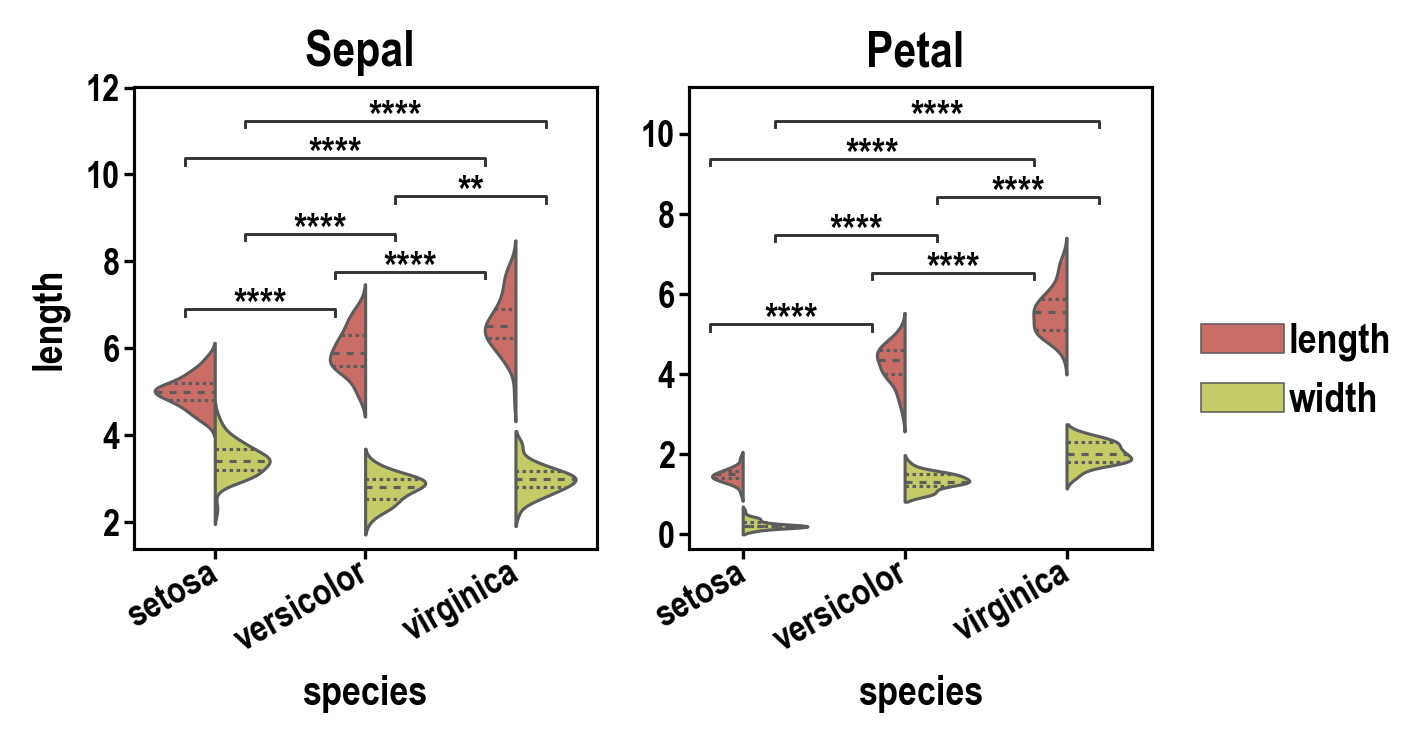

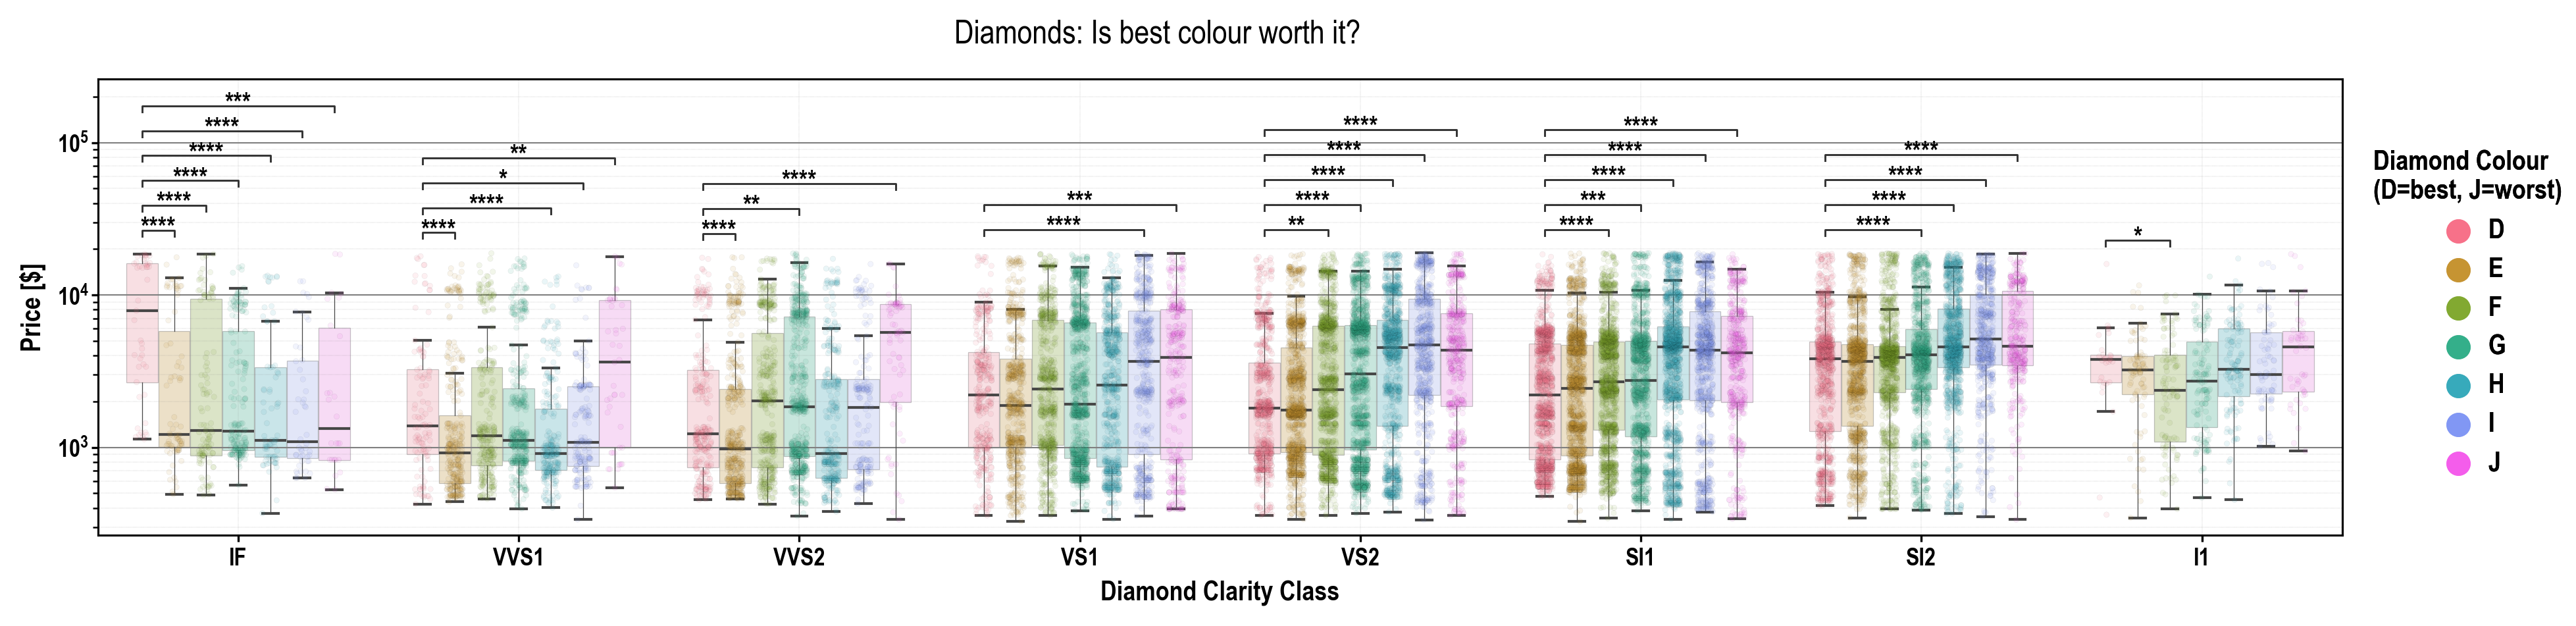
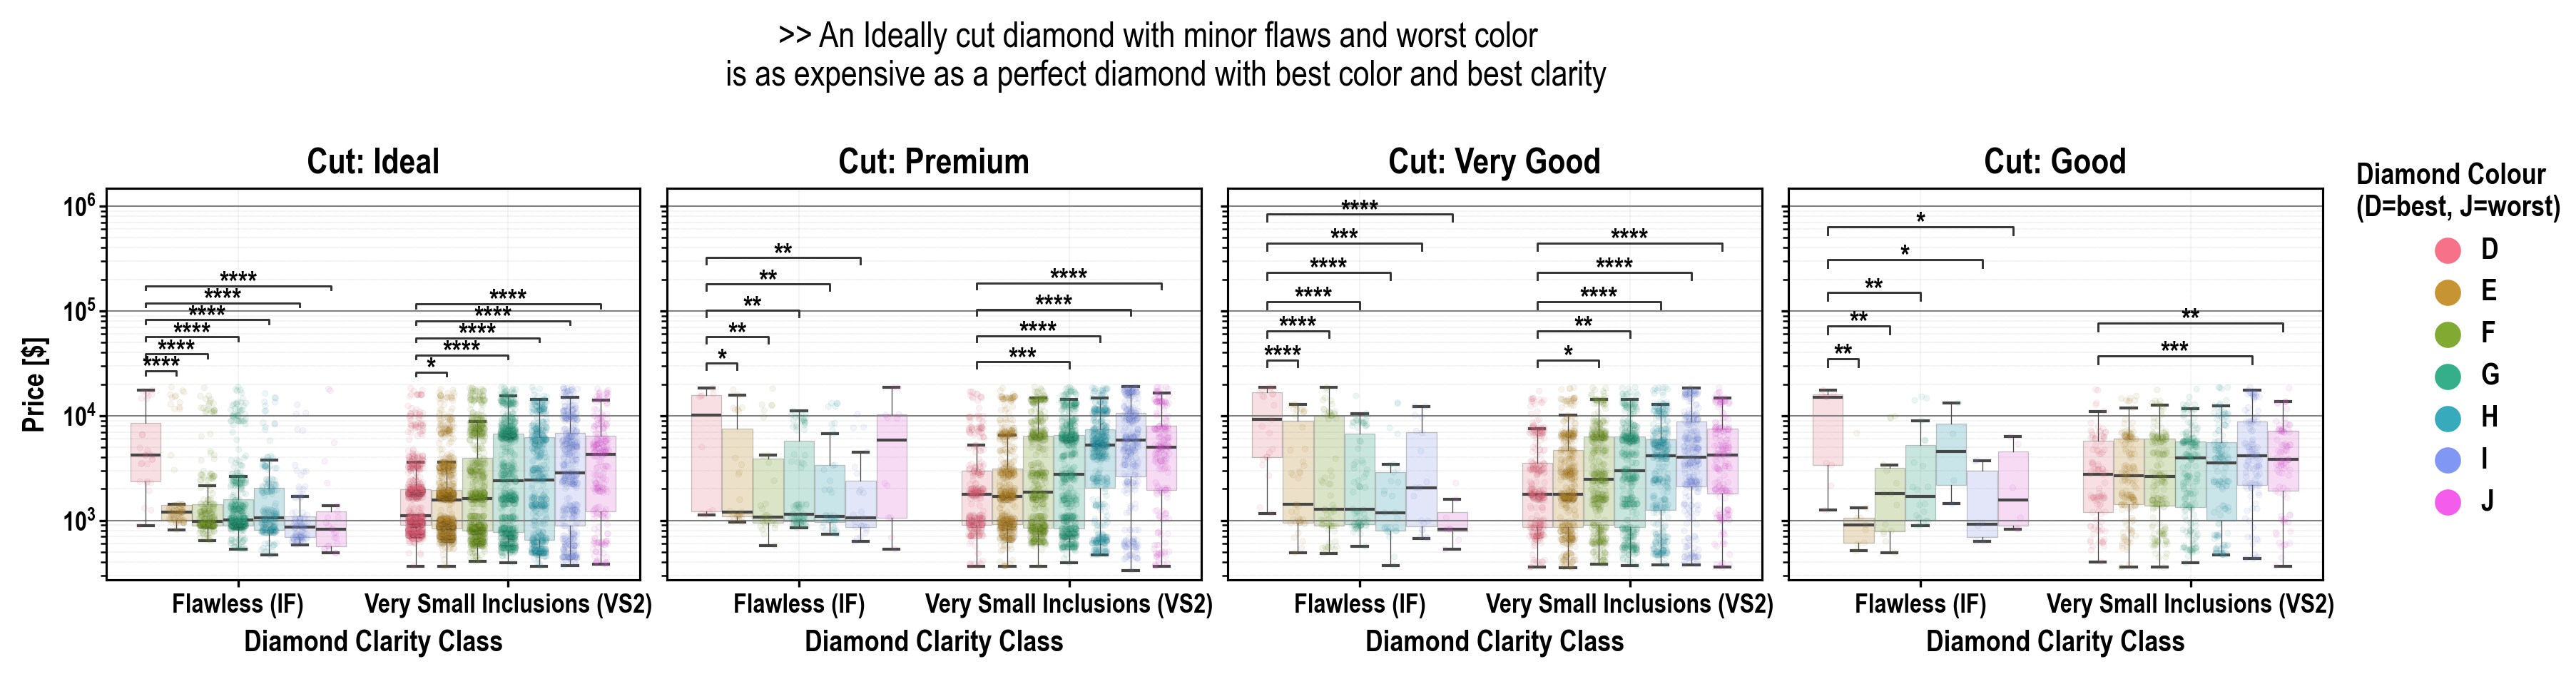
[//]:<-- end of Example Gallery 📷 -->
[//]:<== Information ==========================================================>
🧑🏫 About plotastic
[//]:<-------------------------------------------------------------------------> 🤔 Summary
plotastic addresses the challenges of transitioning from exploratory data analysis to hypothesis testing in Python's data science ecosystem. Bridging the gap between seaborn and pingouin, this library offers a unified environment for plotting and statistical analysis. It simplifies the workflow with a user-friendly syntax and seamless integration with familiar seaborn parameters (y, x, hue, row, col). Inspired by seaborn's consistency, plotastic utilizes a DataAnalysis object to intelligently pass parameters to pingouin statistical functions. The library systematically groups the data according to the needs of statistical tests and plots, conducts visualisation, analyses and supports extensive customization options. In essence, plotastic establishes a protocol for configuring statical analyses through plotting parameters. This approach streamlines the process, translating seaborn parameters into statistical terms, providing researchers and data scientists with a cohesive and user-friendly solution in python.!
Workflow:
- 🧮 Import & Prepare your pandas DataFrame
- 🔀 Make a DataAnalysis Object
DataAnalysis(DataFrame, dims={x, y, hue, row, col})
- Check for empty data groups, differing samplesizes, NaN-count, etc.
automatically
- ✅ Explore Data
DataAnalysis.catplot()
- 🔨 Adapt Data
- ✨ Perform Statistical Tests ✨
pg.pairwise_tests()
- 📊 Plot figure
- 💿 Save all results at once!
self.data
- One Figure in self.fig, self.axes
- Multiple statistical results: self.results
- Use DataAnalysis.save_statistics() to save all results to
different sheets collected in one .xlsx filesheet per test
[//]:<-- end of 🤔 Summary -->
[//]:<-------------------------------------------------------------------------> 📊 Translating Plots into Statistics!
In Principle:
- Categorical data is separable into
seaborn's categorization
- These dimensions are assigned to statistical terms:
- For each level of row or col (or for each combination of
Example with ANOVA:
- Imagine this example data:
- Each category is assigned to a place of a plot, and when calling
# dims is short for dimensions
      dims = dict(          # STATISTICAL TERM:
          y = "tip",        # y-axis, dependent variable
          x = "day",        # x-axis, independent variable (within-subject factor)
          hue = "gender",   # color,  independent variable (within-subject factor)
          col = "smoker",   # axes,   grouping variable
          row = "age-group" # axes,   grouping variable
)- We perform statistical testing groupwise:
[//]:
[//]:<-------------------------------------------------------------------------> ❗️ Disclaimer about Statistics
This software was inspired by ...
- ... Intuitive Biostatistics - Fourth Edition (2017); Harvey
- ... *Introduction to Statistical Learning with applications in
- ... talking to other scientists struggling with statistics
✅ plotastic can help you with...
- ... gaining some practical experience when learning statistics
- ... quickly gain statistical implications about your data without
- ... making first steps towards a full statistical analysis
- ... plotting publication grade figures (check statistics results with
- ... publication grade statistical analysis IF you really know what
- ... quickly test data transformations (log)
🚫 plotastic can NOT ...
- ... replace a professional statistician
- ... teach you statistics, you need some basic knowledge (but is
- ... test for multicolinearity (Absence of multicolinearity is required
- ... perform stringent correction for multiple testing (e.g.
🟡 Be critical and responsible with your statistical analysis!
- Expect Errors: Don't trust automated systems like this one!
- Document your work in ridiculous detail:
- Check results with professionnals:
[//]:
[//]:<== Features =============================================================>
✅ Feature List
- ✅: Complete and tested
- 👍: Complete
- 📆: Planned or unfinished (no date)
- 🤷: Maybe..? (Rather not...)
- 🚫: Not planned, don't want
- 😣: Help Please..?
[//]:<-------------------------------------------------------------------------> Plotting
- 👍 Make and Edit Plots: Implemented ✅
- 📆 QQ-Plot
- 📆 Kaplan-Meyer-Plot
- 🤷 Interactive Plots (where you click stuff and adjust scale etc.)
- 🚫 Support for
seaborn.FacetGrid
plotastic uses matplotlib figures and fills its axes
with seaborn plot functions. In my opinion, that's the best solution
that offers the best adaptibility of every plot detail while bieng
easy to maintain*
- 🚫 Support for
seaborn.objects(same as Facetgrid)
- 😣 NEED HELP WITH: The hidden state of
matplotlib
DataAnalysis.fig attribute. As
simple as that sounds, matplotlib does weird stuff, not applying
changes after editing the plot.*
- *It'd be cool if I could control the changes to a DataAnalysis
object better (e.g. using inplace=True like with pd.DataFrames).
But I never figured out how to control matplotlib figure generation,
even with re-drawing the figure with canvas. It's a mess and I
wasted so much time already.*
[//]:
[//]:<-------------------------------------------------------------------------> Multi-Layered Plotting
- ✅ Box-plot + swarm
- 👍 Box-plot + strip
- 📆 Violin + swarm/strip
[//]:<-------------------------------------------------------------------------> Statistics
- Assumption testing
- Omnibus tests
- PostHoc
pg.pairwise_tests()
- *Works with all primary options. That includes all parametric,
non-parametric, paired, unpaired, etc. tests (t-test, paired t-test,
MWU, Wilcoxon, etc.)*
- ✅ Annotate Stars into plots (\, \\*, etc.)
- Specific pairs can be included/excluded from annotation
- 📆 Make correction for multiple testing go over complete DataFrame
and not Facet-wise:
- Bivariate
[//]:
[//]:<-------------------------------------------------------------------------> Analysis Pipelines
*Idea: Put all those statistical tests into one line. I might work on this only after everything's implemented and working confidently and well!*
- 🤷
between_samples(parametric=True): ANOVA + Tukey (if Normality
- 🤷
between_samples(parametric=False): Kruskal-Wallis + Dunn - 🤷
within_samples(parametric=True): RM-ANOVA + multiple paired
- 🤷
within_samples(parametric=False): Friedman + multiple Wilcoxon
[//]:<==end of ✅ Feature List ==>
[//]:<=========================================================================> 🌳 Class Diagram
- 🛑 Not everything shown here is implemented and not everything that's
- 🐁 Open the raw .svg in your browser and click on a class to see its source code!

📔 How To Use
[//]:<=========================================================================>
Documentations
- Example Gallery
- Data
- Plotting
Quick Example
[//]:<=========================================================================> [//]:<.ipynb Notebooks taken from HOWTOUSE.ipynb> [//]:
Import plotastic and example Data
import matplotlib.pyplot as plt
import plotastic as plst
Import Example Data (Long-Format)
DF, dims = plst.loaddataset("fmri", verbose = False)
DF.head()
| | subject | timepoint | event | region | signal | |---:|:----------|------------:|:--------|:---------|---------:| | 0 | s7 | 9 | stim | parietal | 0.059 | | 1 | s8 | 9 | stim | parietal | 0.17 | | 2 | s0 | 0 | stim | frontal | -0.021 | | 3 | s1 | 0 | stim | parietal | -0.064 | | 4 | s13 | 9 | stim | parietal | 0.013 |
Assign each column to a dimension (y, x, hue, col, row):
dims = dict(
    y = "signal",    # y-axis, dependent variable
    x = "timepoint", # x-axis, independent variable & within-subject factor
    hue = "event",   # color,  grouping variable & within-subject factor
    col = "region"   # axes,   grouping variable
)
Initialize DataAnalysis Object
DA = plst.DataAnalysis(
    data=DF,           # Dataframe, long format
    dims=dims,         # Dictionary with y, x, hue, col, row
    subject="subject", # Datapoints are paired by subject (optional)
    verbose=False,     # Print out info about the Data (optional)
)
Perform Statistics
No arguments need to be passed, although**kwargs, are passed
to respective pingouin functions.
DA.check_normality()  # Normal Distribution?
DA.check_sphericity() # Sphericity?
DA.omnibusrmanova() # Repeated Measures ANOVA
DA.test_pairwise()    # Post-hoc tests
Save Results:
Output is one excel file containing results of all performed tests (normality, anova, t-tests, etc.) in different sheetsDA.save_statistics("example.xlsx")Annotate post-hoc results into plot:
(DA
 .plotboxstrip()   # Pre-built plotting function initializes plot
 .annotatepairwise( # Annotate results from DA.testpairwise()
     include="__HUE" # Use only significant pairs across each hue
     )
)
Saving the plot like matplotlib!
plt.savefig("example.png", dpi=200, bbox_inches="tight")
🧪 Testing
(click to unfold)
- Run
- Download/Clone repository
- Install development tools
pip install .[dev]- Run tests
pytest ./tests- To include a coverage report runpytest ./tests -cov--cov-report=htmland open./htmlcov/index.htmlwith your browser.
🤝 Community Guidelines
(click to unfold)
When interacting with the community, you must adhere to the Code of Conduct
Contribute
I am grateful for pull requests!
- Make sure to understand the code (e.g. see Class diagram in this Readme)
- Run tests before submitting a pull request
Reporting Issues & Problems
If you need help, please open an issue on this repository.
- Please provide a minimal example to reproduce the problem.
Support
If you need help, please open an issue on this repository.
[//]:<=========================================================================>
✍🏻 Cite These!
(click to unfold)
Kuric et al., (2024). plotastic: Bridging Plotting and Statistics in Python. Journal of Open Source Software, 9(95), 6304, https://doi.org/10.21105/joss.06304
Vallat, R. (2018). Pingouin: statistics in Python. Journal of Open Source Software, 3(31), 1026, https://doi.org/10.21105/joss.01026
Waskom, M. L., (2021). seaborn: statistical data visualization. Journal of Open Source Software, 6(60), 3021, https://doi.org/10.21105/joss.03021.
@article{Kuric2024, doi = {10.21105/joss.06304}, url = {https://doi.org/10.21105/joss.06304}, year = {2024}, publisher = {The Open Journal}, volume = {9}, number = {95}, pages = {6304}, author = {Martin Kuric and Regina Ebert}, title = {plotastic: Bridging Plotting and Statistics in Python}, journal = {Journal of Open Source Software} }@article{Waskom2021, doi = {10.21105/joss.03021}, url = {https://doi.org/10.21105/joss.03021}, year = {2021}, publisher = {The Open Journal}, volume = {6}, number = {60}, pages = {3021}, author = {Michael L. Waskom}, title = {seaborn: statistical data visualization}, journal = {Journal of Open Source Software} } @article{Vallat2018, title = "Pingouin: statistics in Python", author = "Vallat, Raphael", journal = "The Journal of Open Source Software", volume = 3, number = 31, pages = "1026", month = nov, year = 2018 }
[//]:


