
A stand alone, light-weight web server for building, sharing graphs created in ipython. Build for data science, data analysis guys. Aiming at building an interactive visualization, collaborated dashboard, and real-time streaming graph.
Feel free to give a star to my new repo, great thanks Awesome-FinTech
Hi, there
I'm so glad that this repo still draws you guys' attention until today. but actually I won't spend any time on it and I've got a much better way to draw dynamic plots in ipython notebook, and I've just post a blog about how to make it in notebooks (including source code and demo notebook).
which looks like bellow:

Please check it here: http://litaotao.github.io/dynamic-charts-matplotlib-alternative-ipython-notebook-python-drawing-js
Thank you guys again, and if possible, please don't cancel your stars, ha~ha, any problems and questions when using the new method will get answered as long as you put it under that post.
thanks again, taotao~



Inspired by IPython, built with love
IPython-Dashboard
A stand alone, light-weight web server for building, sharing graphs created in IPython. Build for data science, data analysis guys. Aiming at building an interactive visualization, collaborated dashboard, and real-time streaming graph.Screenshot and Demo
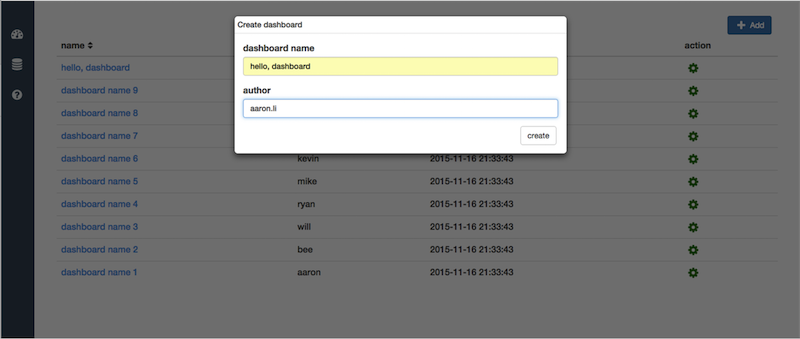
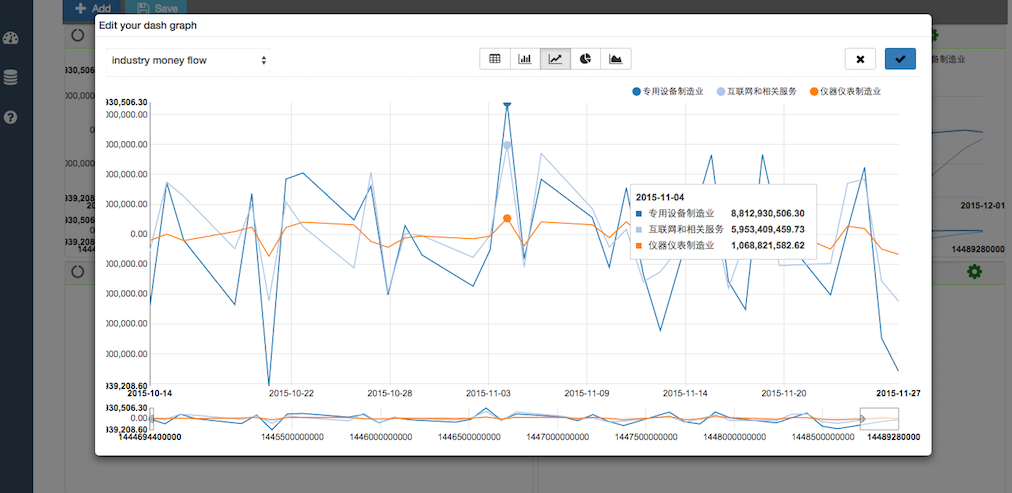
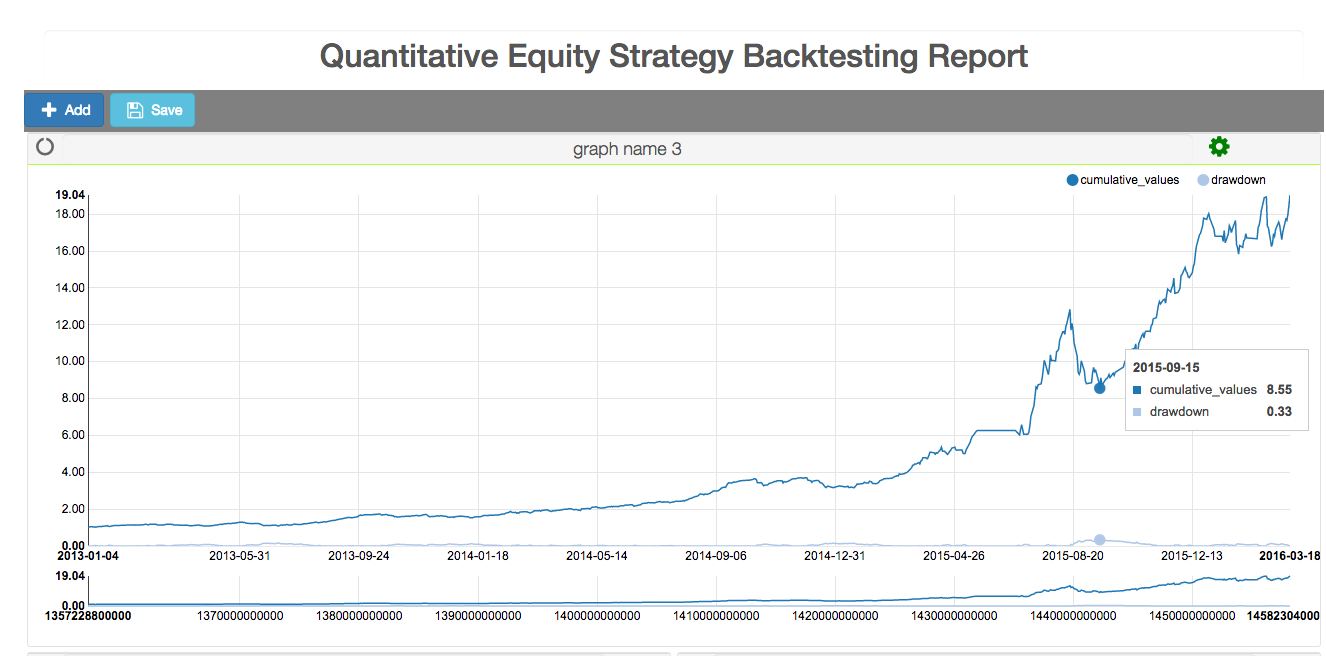
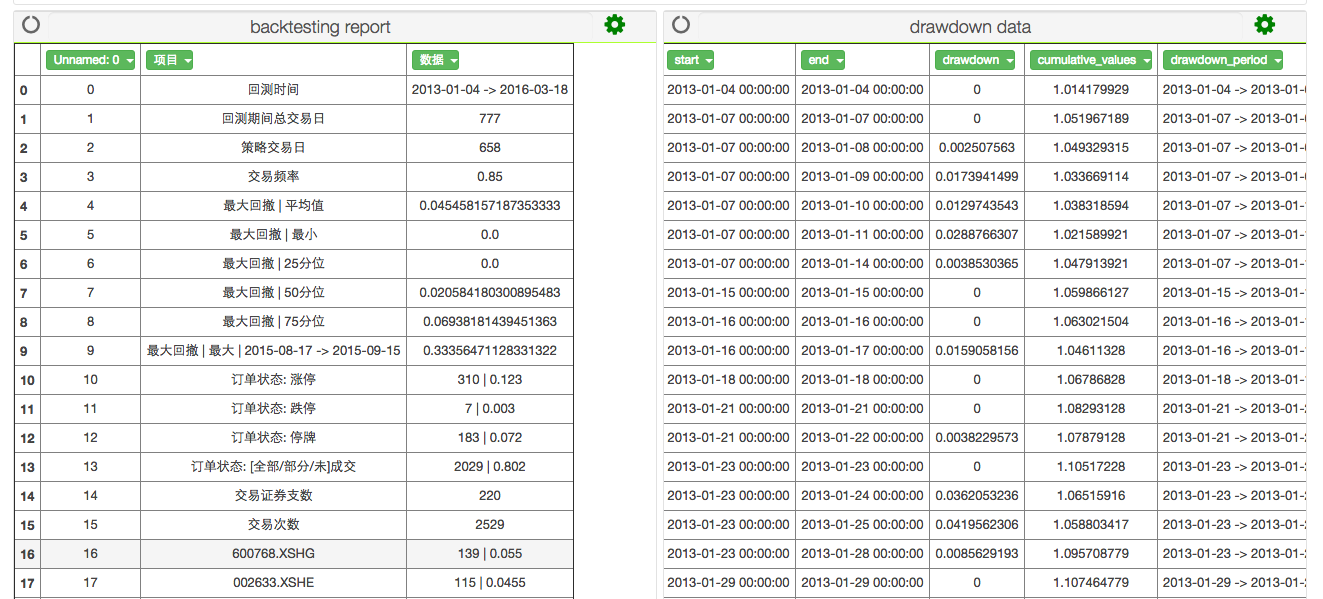
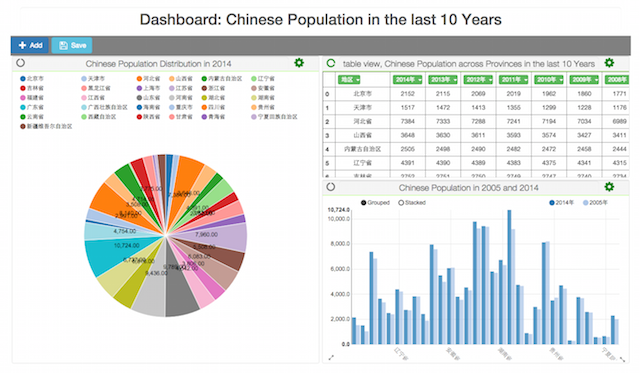
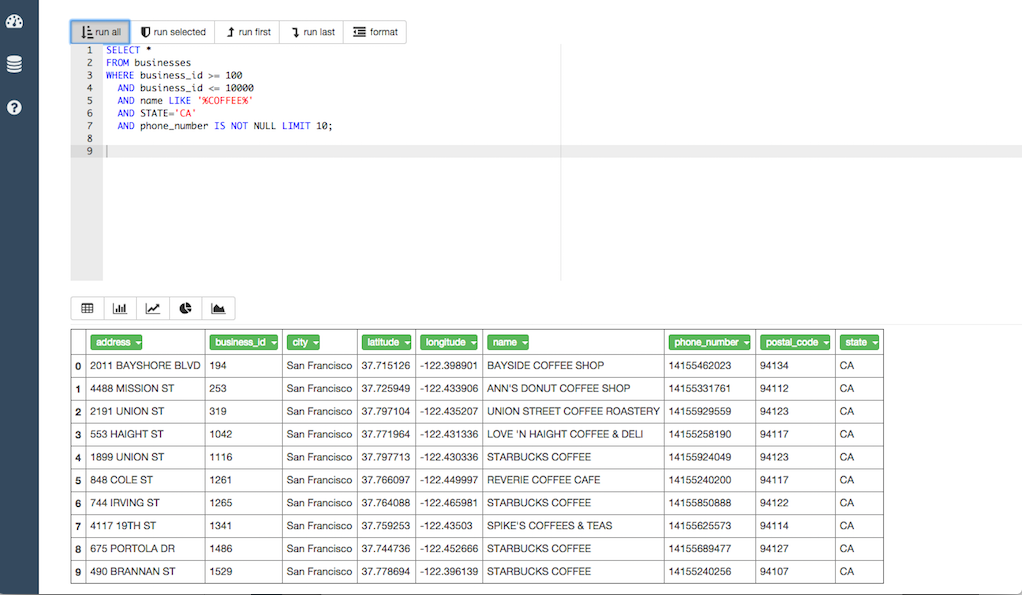
Usage
- Install prerequisite
pip install ipython-dashboard --upgrade
+ install redis 2.6+ : install guide
+ [option, if you need run sql]install mysql : brew install mysql or apt-get install mysql
+ install IPython-Dashboard requirements [unneeded sometimes]:
- cd ~/your python package path/IPython-Dashboard
- pip install -r requirements.txt
- [
option, if you need run sql]Config mysql
mysql.server start
+ login in mysql using root : mysql -u root
+ create a user and grant privileges;
- take a look at current database user
mysql> SELECT User,Host FROM mysql.user;
        +------+-----------+
        | User | Host      |
        +------+-----------+
        | root | 127.0.0.1 |
        | root | ::1       |
        |      | localhost |
        | root | localhost |
        |      | mac007    |
        | root | mac007    |
        +------+-----------+
        6 rows in set (0.00 sec)
- create a user for IPython-Dashboard
mysql> create user 'ipd'@'localhost' identified by 'thanks';
        Query OK, 0 rows affected (0.00 sec)
mysql> grant all privileges on . to ipd@localhost;         Query OK, 0 rows affected (0.00 sec)
mysql> SELECT User,Host FROM mysql.user;         +------+-----------+         | User | Host      |         +------+-----------+         | root | 127.0.0.1 |         | root | ::1       |         |      | localhost |         | ipd  | localhost |         | root | localhost |         |      | mac007    |         | root | mac007    |         +------+-----------+         7 rows in set (0.00 sec)
mysql> flush privileges;         Query OK, 0 rows affected (0.00 sec)
nosetests -s dashboard.tests.testCreateData:testcreatemysql_data- Create logging path
mnt currently: /mnt/ipython-dashboard/logs
+ make sure the log folder is write-able, using chmod and ls -l to confirm.
chenshan@mac007:/mnt/ipython-dashboard$ls -l
    total 0
drwxrwxrwx 9 root wheel 306 Dec 15 22:09 logs- Config IPython-Dashboard server :
IPython-Dashboard/dashboard/config.py
apphost='ipaddress:port'
- Start redis and IPython-Dashboard server
chenshan@mac007:~/Desktop/github/IPython-Dashboard$redis-server &
chenshan@mac007:~/Desktop/github/IPython-Dashboard$dash-server --help     usage: dash-server [-h] [-H HOST] [-p PORT] [-d DEBUG]
Start your IPython-Dashboard server ...
optional arguments:       -h, --help            show this help message and exit       -H HOST, --host HOST  server host, default localhost       -p PORT, --port PORT  server port, default 9090       -d DEBUG, --debug DEBUG                             server port, default true
chenshan@mac007:~/Desktop/github/IPython-Dashboard$dash-server     Namespace(debug=True, host='0.0.0.0', port=9090)      * Running on http://0.0.0.0:9090/      * Restarting with reloader     Namespace(debug=True, host='0.0.0.0', port=9090)
- Do your exploring
Goal
- support raw html visualization
- support python object visualization
- Editable
- Real-time fresh when rendering a variable python object
- Can be shared, both public and private [ need password ]
- In the notebook, can share an object to a dashboard [ that's visualize that object in that dashboard ]
Use Case
- exploring in notebook, share/send the result/summary to people, without the details.
- share some data in a private notebook.
- disappointed with the complicated code when drawing a graceful/staic graph using matplotlib/seaborn/mpld3 etc.
- want an interactive graph, allow people to zoom in/out, resize, get hover tips, change graph type easily.
- want a real-time graph.
- want an collaborated graph/dashboard.

Run tests
just run sudo nosetests --with-coverage --cover-package=dashboard under this repo
taotao@mac007:~/Desktop/github/IPython-Dashboard$sudo nosetests --with-coverage --cover-package=dashboard
Password:
../Users/chenshan/Desktop/github/IPython-Dashboard/dashboard/tests/testCreateData.py:69: Warning: Can't create database 'IPD_data'; database exists
  conn.cursor().execute('CREATE DATABASE IF NOT EXISTS {};'.format(config.sql_db))
/Users/chenshan/Desktop/github/IPython-Dashboard/dashboard/server/utils.py:135: Warning: Unknown table 'ipd_data.businesses'
  cursor.execute(sql)
/Library/Python/2.7/site-packages/pandas/io/sql.py:599: FutureWarning: The 'mysql' flavor with DBAPI connection is deprecated and will be removed in future versions. MySQL will be further supported with SQLAlchemy engines.
  warnings.warn(MYSQLWARNING, FutureWarning)
...
Name                                    Stmts   Miss  Cover   Missing

dashboard.py                               13      0   100%
dashboard/client.py                         1      0   100%
dashboard/client/sender.py                 11      3    73%   26-27, 33
dashboard/conf.py                           0      0   100%
dashboard/conf/config.py                   29      0   100%
dashboard/server.py                         0      0   100%
dashboard/server/resources.py               0      0   100%
dashboard/server/resources/dash.py         35     10    71%   36, 55-56, 67-69, 86-89
dashboard/server/resources/home.py         40     12    70%   25, 28-30, 83-91
dashboard/server/resources/sql.py          27     11    59%   30, 52-75
dashboard/server/resources/status.py        8      1    88%   19
dashboard/server/resources/storage.py      13      5    62%   26-28, 43-47
dashboard/server/utils.py                  79     18    77%   20-24, 78-80, 82-83, 86, 96, 99-100, 126-127, 140-142
dashboard/server/views.py                  21      1    95%   16

TOTAL                                     277     61    78%

Ran 5 tests in 9.885s
OK taotao@mac007:~/Desktop/github/IPython-Dashboard$
Change Log
- future
- V 0.1.6 : optimize-chart [ current develop version ]
- SQL Editor + optimize page + render sql result as graph
- V 0.1.5 : sql-server-log [ current stable version ]
- SQL Editor + sql server develop : render sql result as table view


