
A text embedding viewer for the Jupyter environment
Last updated Oct 10, 2025
21
Stars
1
Forks
1
Issues
0
Stars/day
Attention Score
5
Language breakdown
TypeScript 72.1%
Python 19.4%
Jupyter Notebook 4.4%
CSS 1.9%
Shell 1.8%
HTML 0.4%
▸ Files
click to expand
README
canica
canica is an interactive tool to visualize embeddings. Its main current goal is to explore text datasets, representing the input embeddings in a 2D tSNE plot.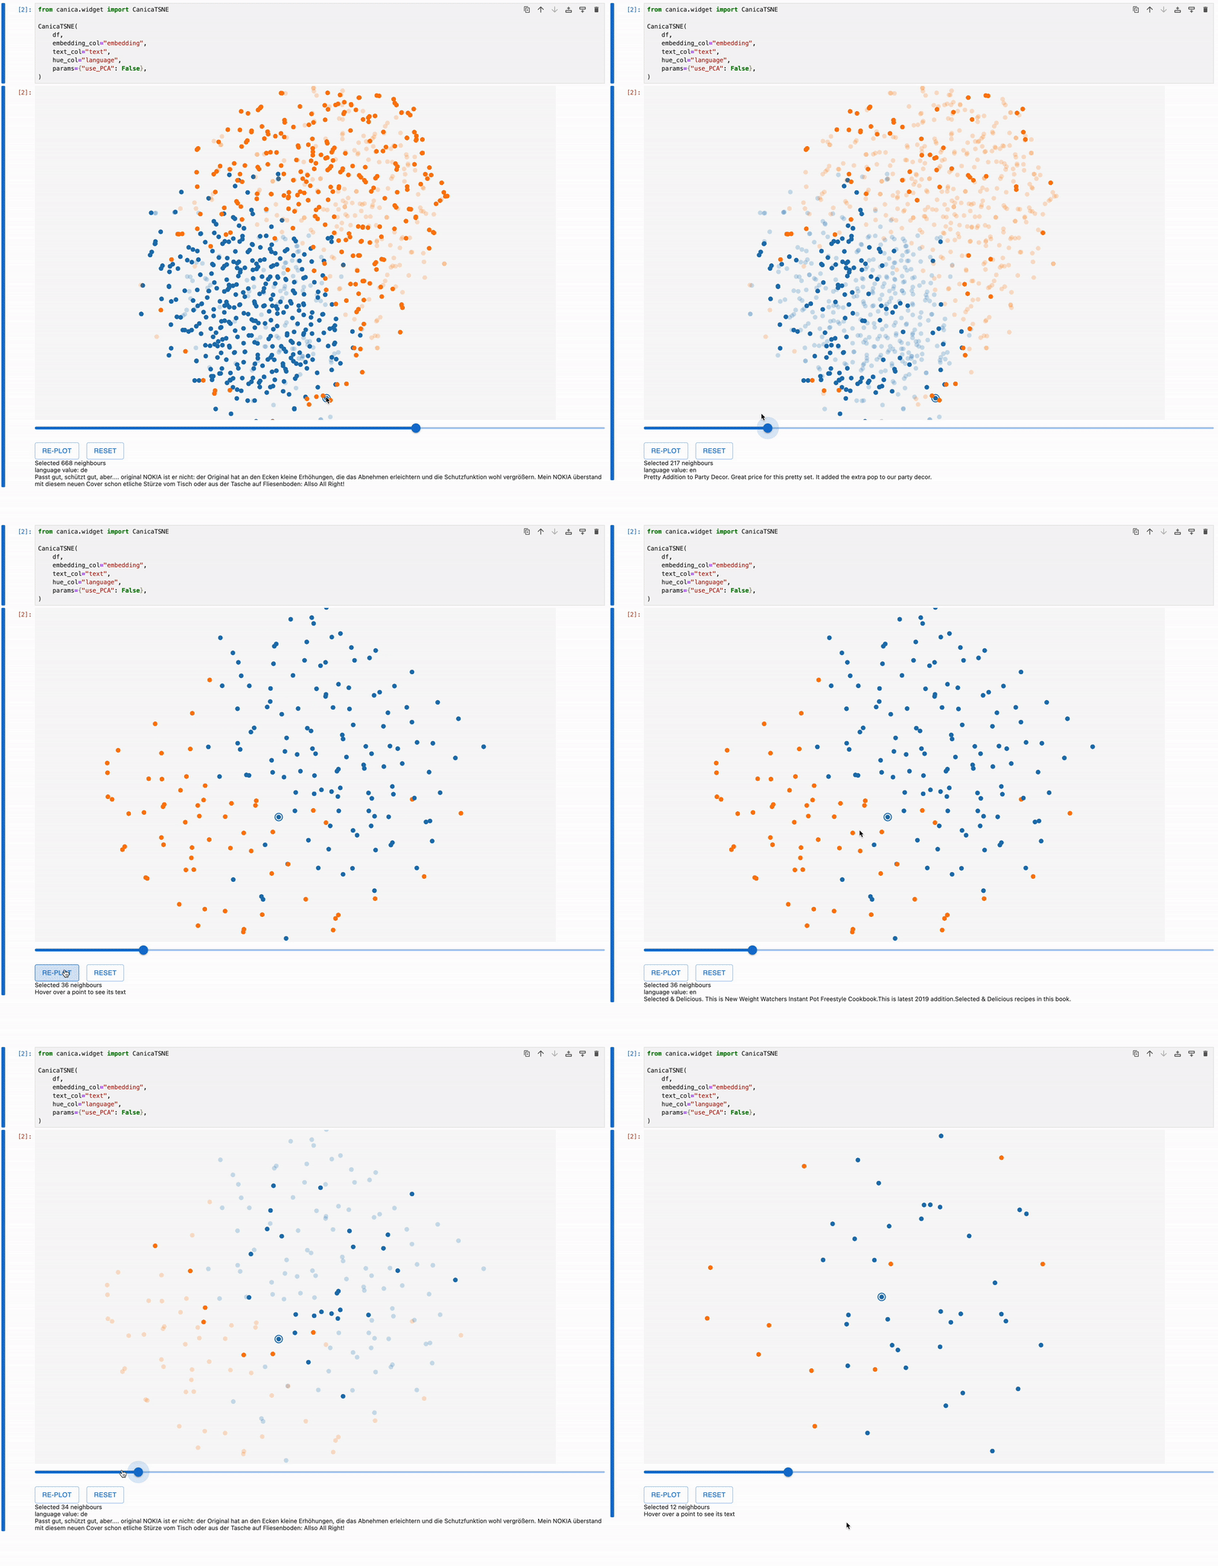
How to install
Justpip install canicaAnd start using the CanicaTSNE and CanicaUMAP class in your notebooks.
How to use
canica is designed to work mainly as a data exploration tool embedded as a widget inside of a jupyter notebook. These are the instructions to explore a dataset in a notebook (the tutorial notebook provides more information).In a notebook, load a pandas DataFrame and make sure that at least one column contains the embeddings you want to plot. In a cell, run:
from canica.widget import CanicaTSNE CanicaTSNE(df, embeddingcol="embeddingcol", textcol="textcol", huecol="somescore")df is the pandas DataFrame, "embeddingcol" is a column in df containing embeddings and huevar is another column that will be represented using colours (currently it has to be a numerical column with values between 0 and 1). You can also use CanicaUMAP instead of CanicaTSNE to use UMAP.
This will show the canica embedding explorer and will enable interactive exploration of your dataset. Have a look at the tutorial notebook to see it working.


