
Prettified base graphics
Prettified Base Graphics



Anyone who uses R Base graphics, have a 100 and 1 tweaks that they use to make the figures more presentable. This package aims to capture the tweaks in one place.
Installation
The package is still being developed and the graphs are subject to change. The package is on CRAN and can be installed in the usual way
r
install.packages("prettyB")
To install the dev version, try
r
devtools::install_github("jumpingrivers/prettyB")
The package can then be loaded in the usual way
r
library("prettyB")
Usage
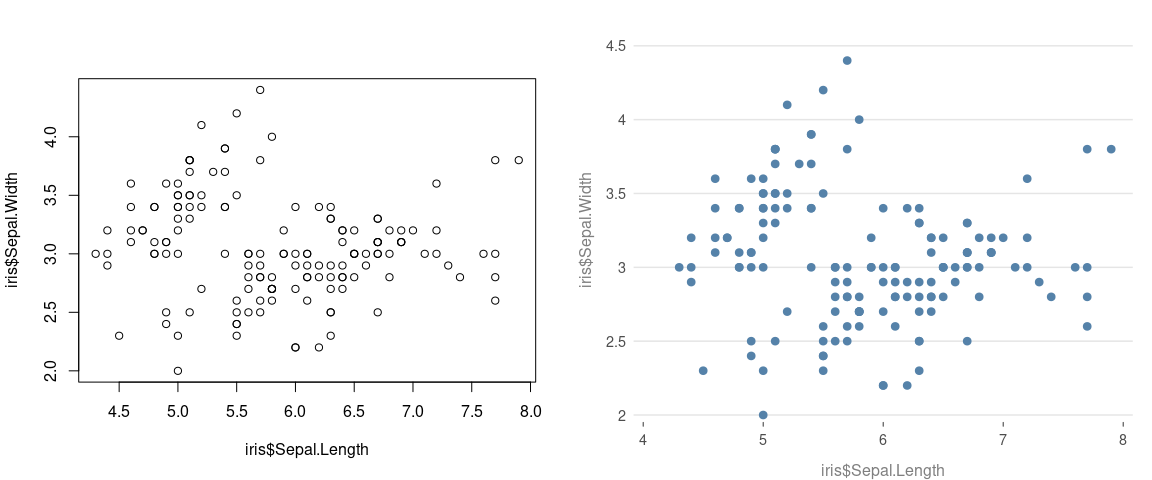
All plotting functions work exactly as before, with the same inputs. The difference is that the defaults have been changed. For example, compare
r
op = par(mfrow = c(1, 2))
plot(iris$Sepal.Length, iris$Sepal.Width)
plot_p(iris$Sepal.Length, iris$Sepal.Width)
#>
When you first call a prettyB, it changes the underlying par() and palette(). You can reset this via
r
prettyB::reset_prettyB()
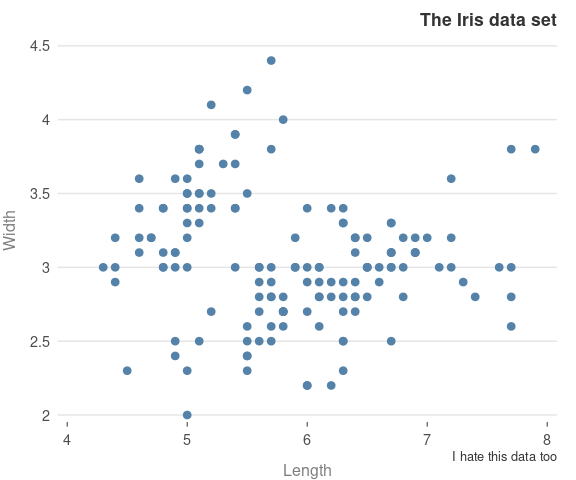
The core idea of prettyB is that no new arguments are introducted to the plot functions. This means, that no changes to existing code are required
r
plot_p(iris$Sepal.Length, iris$Sepal.Width,
     xlab = "Length", ylab = "Width",
     main = "The Iris data set",
     sub = "I hate this data too")
#>
Other plots
The package also prettifies other functions
- Histograms
r
    z = rt(100, 4)
    hist(z, main = "The t-distribution")
    hist_p(z, main = "The t-distribution")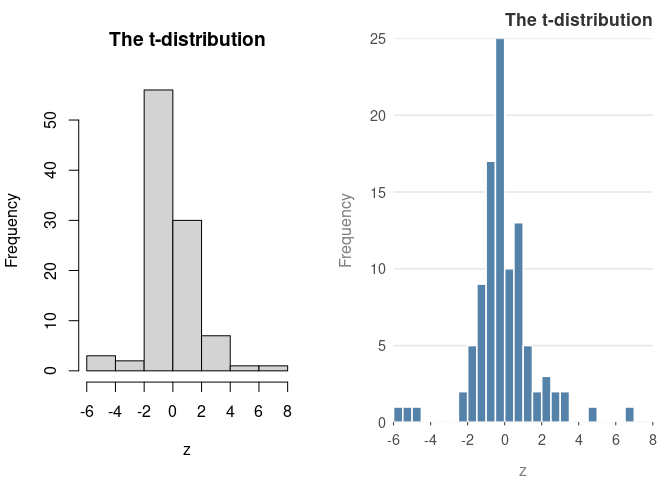
- barplots
r
    barplot(VADeaths, main = "Death Rates in Virginia")
    barplot_p(VADeaths, main = "Death Rates in Virginia")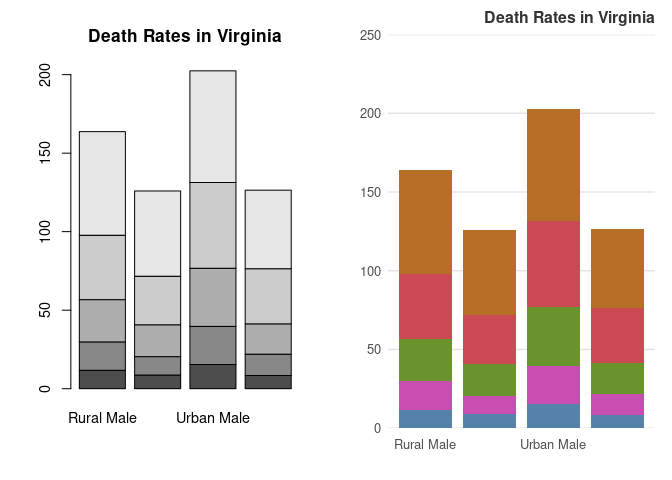
Package Rationale
This package is not a replacement for ggplot2 or other R related plotting packages. Instead, it has a few simple aims
- provide package authors a low dependency method of making their
- provide academics with a way of generating nice plots, but not worry
- provide a simple way for improving the look and feel of plots in
Since the generated plots by prettyB use standard base graphics, with no new arguments, this makes plots future proof. As a fall-back, just remove the _p.
I picked up the general style a few years ago, but the book Fundamentals of Data Visualization has made it a bit more consist. The author also provided a free online version.
Other information
- If you have any suggestions or find bugs, please use the github
- Feel free to submit pull requests
Development of this package was supported by Jumping Rivers


