
Golang charting and graphing library
go-analyze/charts


Our library focuses on generating beautiful charts and graphs within Go. Graphs are used to show a lot of different types of data, needing to be represented in a unique way in order to convey the meaning behind the data. This Go module attempts to use sophisticated defaults to try and render this data in a simple way, while still offering intuitive options to update the graph rendering as you see fit.
Functionality
Currently supported chart types: line, scatter, bar, horizontal bar, pie, doughnut, radar, heat map, candlestick, funnel, violin and table.
New users should check out the Features Overview on our Wiki to see commonly used features for each chart type, as well as linking to specific examples for the feature.
We also have an extensive catalog of examples. Reference the README within the examples directory to see a list of our example implementations of each chart type and configurations.
Themes
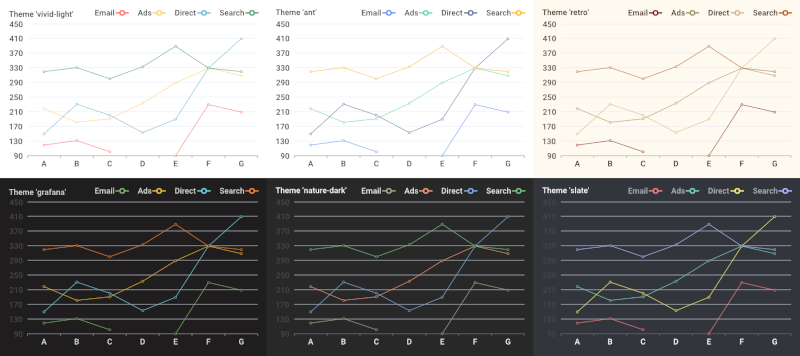
Our library offers a wide range of themes, the examples below are only a small subset of what we offer. See our Themes list in Feature Overview to see our complete theme list.
Line Chart
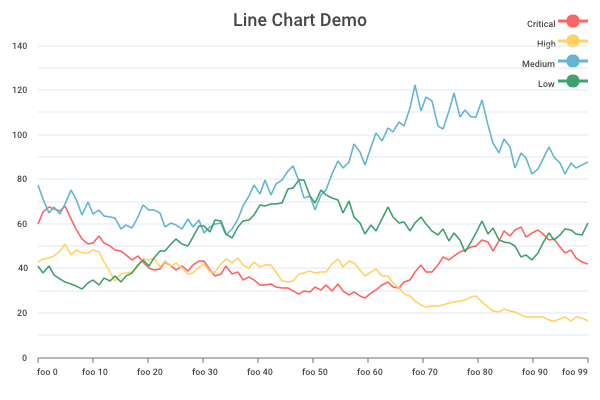
Line Chart Feature List: https://github.com/go-analyze/charts/wiki/Feature-Overview#line-charts
import (
	"github.com/go-analyze/charts"
)
func main() { 	// values specified where the first index is for each data series or source, and the second index is for each sample. 	values := [][]float64{ 		{	// Email 			120, // Mon 			132, // Tue 			101, // Wed 			134, // Thu 			90,  // Fri 			230, // Sat 			210, // Sun 		}, 		{ 			// values for 'Search Engine' go here 		}, 	} 	opt := charts.NewLineChartOptionWithData(values) 	opt.Title = charts.TitleOption{ 		Text: "Line Chart Demo", 	} 	opt.XAxis.Labels = []string{ 		// The 7 labels here match to the 7 values above 		"Mon", "Tue", "Wed", "Thu", "Fri", "Sat", "Sun", 	} 	opt.Legend = charts.LegendOption{ 		SeriesNames: []string{ 			"Email", "Search Engine", 		}, 	} 	// other options as desired...
p := charts.NewPainter(charts.PainterOptions{ 		Width:        600, 		Height:       400, 	}) 	err := p.LineChart(opt) 	// ... err check 	buf, err := p.Bytes() 	// ...
Top Line Chart Examples:
- line_chart-1-basic - Basic line chart with some simple styling changes and a demonstration of
nullvalues. - line_chart-2-symbols - Basic line chart which sets a different symbol for each series item.
- line_chart-3-smooth - Basic line chart with thick smooth lines drawn.
- line_chart-4-mark - Line chart with included mark points and mark lines.
- line_chart-6-stacked - Line chart with "Stacked" series enabled, making each series a layer on the chart and the top line showing the sum.
- linechart-8-dualy_axis - Basic line chart with two series, one rendered to the left axis and one to a second y-axis on the right.
Scatter Chart
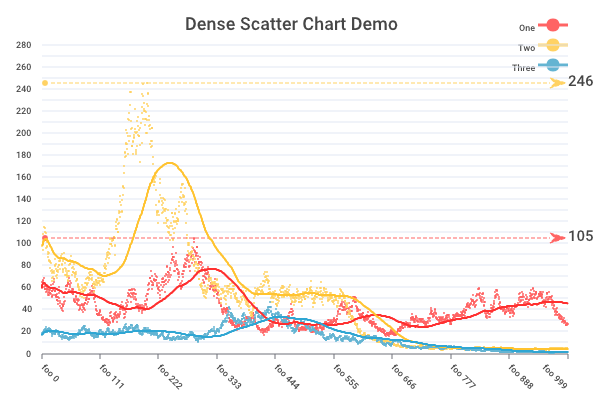
Scatter Chart Feature List: https://github.com/go-analyze/charts/wiki/Feature-Overview#scatter-charts
import (
	"github.com/go-analyze/charts"
)
func main() { 	opt := charts.NewScatterChartOptionWithData([][]float64{ 		{120, 132, 101, charts.GetNullValue(), 90, 230, 210}, 		{ / values for search engine go here / }, 	}) 	opt.Title.Text = "Scatter" 	opt.XAxis.Labels = []string{ 		// The 7 labels here match to the 7 values above 		"Mon", "Tue", "Wed", "Thu", "Fri", "Sat", "Sun", 	} 	opt.Legend.SeriesNames = []string{"Email", "Search Engine"} 	// set other field options as desired...
p := charts.NewPainter(charts.PainterOptions{ 		Width:        600, 		Height:       400, 	}) 	err := p.ScatterChart(opt) 	// ... err check 	buf, err := p.Bytes() 	// ...
Top Scatter Chart Examples:
- scatter_chart-1-basic - Basic scatter chart with some simple styling changes and a demonstration of
nullvalues. - scatterchart-3-dense_data - Scatter chart with dense data, trend lines, and more custom styling configured.
Bar Chart
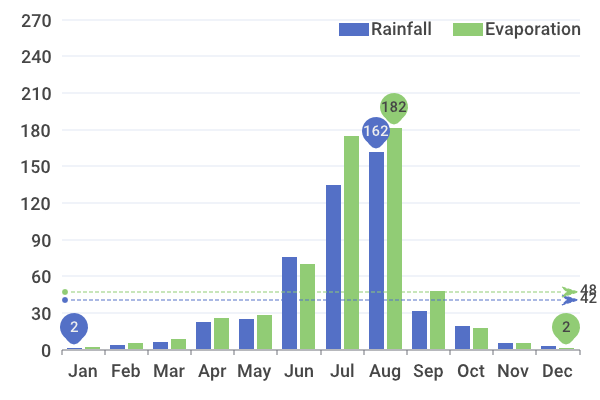
Bar Chart Feature List: https://github.com/go-analyze/charts/wiki/Feature-Overview#bar-charts
import (
	"github.com/go-analyze/charts"
)
func main() { 	// values specified where the first index is for each data series or source, and the second index is for each sample. 	values := [][]float64{ 		{   // Rainfall data 			2.0, 4.9, 7.0, 23.2, 25.6, 76.7, 135.6, 162.2, 32.6, 20.0, 6.4, 3.3, 		}, 		{ 			// 'Evaporation' data goes here 		}, 	} 	opt := charts.NewBarChartOptionWithData(values) 	opt.XAxis.Labels = []string{ 		// A label for each position in the values above 		"Jan", "Feb", "Mar", "Apr", "May", "Jun", "Jul", "Aug", "Sep", "Oct", "Nov", "Dec", 	} 	opt.Legend = charts.LegendOption{ 		SeriesNames: []string{ 			"Rainfall", "Evaporation", 		}, 		Offset:       charts.OffsetRight, 	} 	// Example of adding a mark line across the bars, or mark points for specific values 	opt.SeriesList[0].MarkLine.AddLines(charts.SeriesMarkTypeAverage) 	opt.SeriesList[0].MarkPoint.AddPoints(charts.SeriesMarkTypeMax, charts.SeriesMarkTypeMin) 	// other options as desired...
p := charts.NewPainter(charts.PainterOptions{ 		Width:        600, 		Height:       400, 	}) 	err := p.BarChart(opt) 	// ... err check 	buf, err := p.Bytes() 	// ...
Top Bar Chart Examples:
- bar_chart-1-basic - Basic bar chart.
- bar_chart-4-mark - Bar chart with included mark points and mark lines.
Horizontal Bar Chart
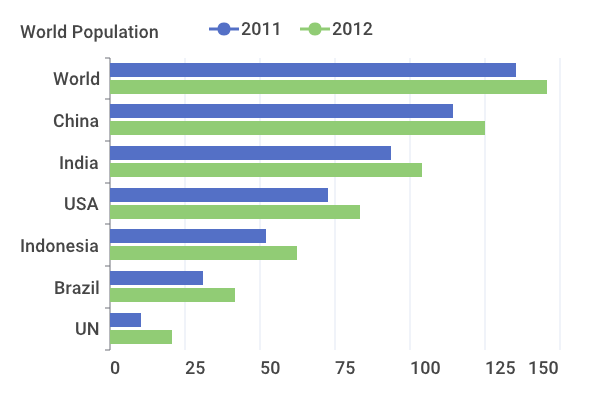
Horizontal Bar Chart Feature List: https://github.com/go-analyze/charts/wiki/Feature-Overview#horizontal-bar-charts
Horizontal bar charts are configured with BarChartOption and Horizontal: true. The category axis runs vertically and the value axis runs along the bottom.
Top Horizontal Bar Chart Examples:
- horizontalbar_chart-1-basic - Basic horizontal bar chart.
Pie Chart
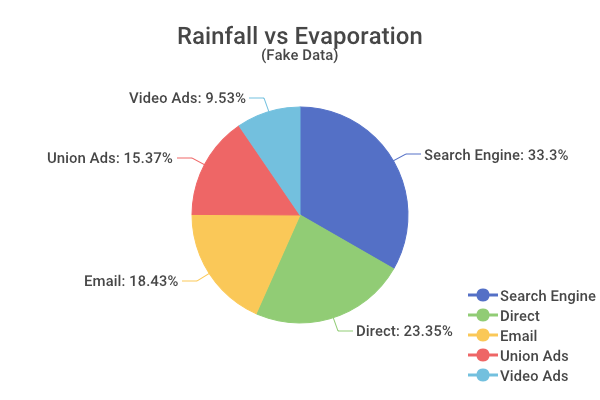
Pie Chart Feature List: https://github.com/go-analyze/charts/wiki/Feature-Overview#pie-charts
import (
	"github.com/go-analyze/charts"
)
func main() { 	values := []float64{ 		1048, // Search Engine 		735,  // Direct 		580,  // Email 		484,  // Union Ads 		300,  // Video Ads 	} 	opt := charts.NewPieChartOptionWithData(values) 	opt.Title = charts.TitleOption{ 		Text:             "Pie Chart", 		Offset:           charts.OffsetCenter, 	} 	opt.Legend.SeriesNames = []string{ 		"Search Engine", "Direct", "Email", "Union Ads", "Video Ads", 	} 	// other options as desired...
p := charts.NewPainter(charts.PainterOptions{ 		Width:        600, 		Height:       400, 	}) 	err := p.PieChart(opt) 	// ... err check 	buf, err := p.Bytes() 	// ...
Top Pie Chart Examples:
- pie_chart-1-basic - Pie chart with a variety of customization demonstrated including positioning the legend in the bottom right corner.
- pie_chart-2-radius - Pie chart which varies the series radius by the percentage of the series.
Doughnut Chart
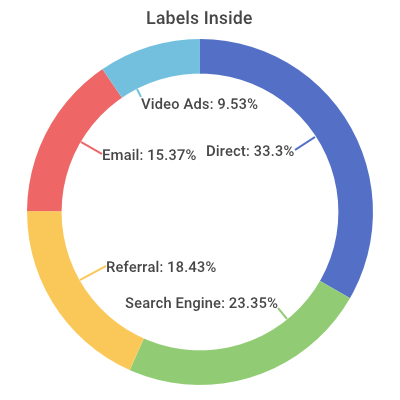
Doughnut Chart Feature List: https://github.com/go-analyze/charts/wiki/Feature-Overview#doughnut-charts
Top Doughnut Chart Examples:
- doughnut_chart-1-basic - Basic doughnut chart.
- doughnut_chart-2-styles - A variety of styles shown for doughnut charts.
Radar Chart
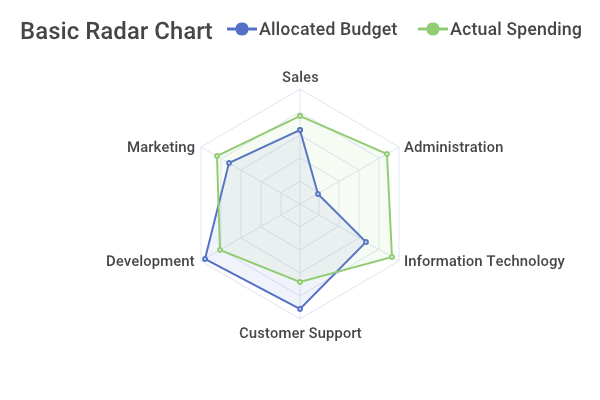
Radar Chart Feature List: https://github.com/go-analyze/charts/wiki/Feature-Overview#radar-charts
Top Radar Chart Examples:
- radar_chart-1-basic - Basic radar chart.
Heat Map Chart
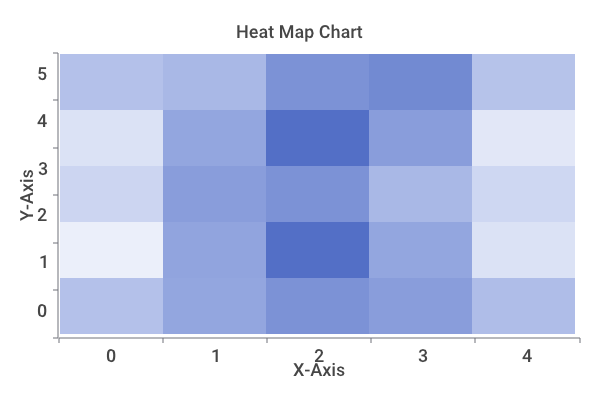
Heat Map Chart Feature List: https://github.com/go-analyze/charts/wiki/Feature-Overview#heat-map-charts
Top Heat Map Chart Examples:
- heat_map-1-basic - Basic heat map chart.
Table

Table Feature List: https://github.com/go-analyze/charts/wiki/Feature-Overview#tables
Top Table Examples:
- table-1 - Table with a variety of table specific configuration and styling demonstrated.
Candlestick Chart
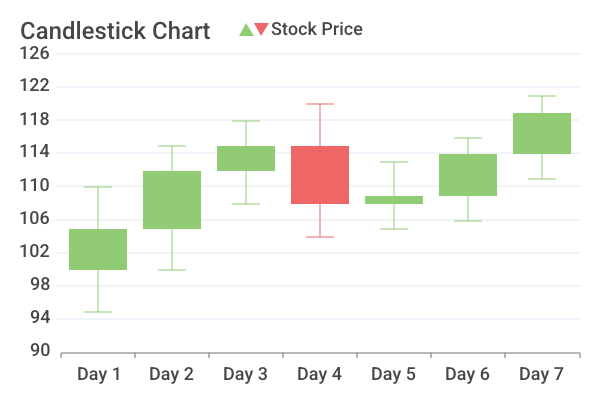
Candlestick Chart Feature List: https://github.com/go-analyze/charts/wiki/Feature-Overview#candlestick-charts
import (
	"github.com/go-analyze/charts"
)
func main() { 	ohlcData := []charts.OHLCData{ 		{Open: 100.0, High: 110.0, Low: 95.0, Close: 105.0}, 		{Open: 105.0, High: 115.0, Low: 100.0, Close: 112.0}, 		{Open: 112.0, High: 118.0, Low: 108.0, Close: 115.0}, 		// ... more OHLC data 	}
opt := charts.NewCandlestickOptionWithData(ohlcData) 	opt.Title.Text = "Candlestick Chart" 	opt.XAxis.Labels = []string{ 		"Day 1", "Day 2", "Day 3", // ... matching data points 	}
p := charts.NewPainter(charts.PainterOptions{ 		Width:  800, 		Height: 600, 	}) 	err := p.CandlestickChart(opt) 	// ... err check 	buf, err := p.Bytes() 	// ...
Top Candlestick Chart Examples:
- candlestick_chart-1-basic - Basic OHLC data visualization with a candlestick chart.
- candlestick_chart-4-patterns - Automatic pattern detection.
- candlestick_chart-5-aggregation - Time-based aggregation of candlestick data.
Funnel Chart
Funnel Chart Feature List: https://github.com/go-analyze/charts/wiki/Feature-Overview#funnel-charts
import (
	"github.com/go-analyze/charts"
)
func main() { 	values := []float64{ 		100, // Show 		80,  // Click 		60,  // Visit 		40,  // Inquiry 		20,  // Order 	} 	opt := charts.NewFunnelChartOptionWithData(values) 	opt.Title.Text = "Funnel Chart" 	opt.Legend.SeriesNames = []string{ 		"Show", "Click", "Visit", "Inquiry", "Order", 	}
p := charts.NewPainter(charts.PainterOptions{ 		Width:        600, 		Height:       400, 	}) 	err := p.FunnelChart(opt) 	// ... err check 	buf, err := p.Bytes()
Top Funnel Chart Examples:
- funnel_chart-1-basic - Basic funnel chart.
Violin Chart
import (
	"github.com/go-analyze/charts"
)
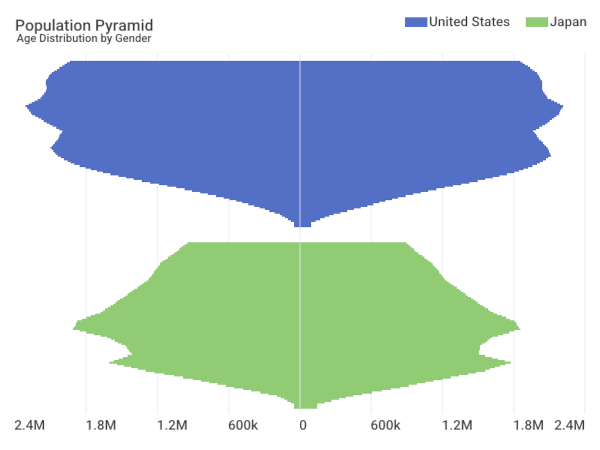
func main() { 	samples := [][]float64{normalData, skewedData, bimodalData, tightData} 	opt, err := charts.NewViolinChartOptionWithSamples(samples, 80) 	// ... err check 	opt.Title.Text = "Distribution Shapes" 	opt.Legend.SeriesNames = []string{"Normal", "Skewed", "Bimodal", "Tight"} 	for i := range opt.SeriesList { 		opt.SeriesList[i].MarkLine.AddLines(charts.SeriesMarkTypeMedian, charts.SeriesMarkTypeAverage) 	}
p := charts.NewPainter(charts.PainterOptions{ 		Width:        800, 		Height:       400, 	}) 	err = p.ViolinChart(opt) 	// ... err check 	buf, err := p.Bytes()
Top Violin Chart Examples:
- violin_chart-1-basic - Population pyramid comparing US and Japan age demographics.
- violin_chart-1-samples - KDE from sample data with median and average mark lines.
ECharts Render
import (
	"github.com/go-analyze/charts"
)
func main() { 	buf, err := charts.RenderEChartsToPNG({ 		"title": { 			"text": "Line Chart" 		}, 		"xAxis": { 			"data": ["Mon", "Tue", "Wed", "Thu", "Fri", "Sat", "Sun"] 		}, 		"series": [ 			{ 				"data": [150, 230, 224, 218, 135, 147, 260] 			} 		] 	}) 	// snip...
Current Project Status
Forked from vicanso/go-charts and the archived wcharczuk/go-chart, our project introduces enhancements for rendering challenging datasets. We aim to build upon their solid foundation to offer a more versatile and user-friendly charting solution.
API Stability
This project follows ZeroVer versioning, and will never release a v1. Instead, middle digit increases (e.g., v0.1.X to v0.2.0) indicate breaking changes such as Go version updates or API modifications. Patch version increases (e.g., v0.2.0 to v0.2.1) indicate bug fixes and feature expansions, which are generally safe to apply.
We're committed to refining the API, incorporating feedback and new ideas to enhance flexibility and ease of use. We detail needed API changes on our wiki Version Migration Guide.
Changes
Notable improvements in our fork include:
- Expanded Features: We continue to develop and extend this library. Recent additions include scatter charts with trend lines, a wide range of built-in themes, stacked series, improved support for eCharts configurations, and smooth line rendering.
- Intuitive Configuration: Our goal is to ensure configuration options are clear and easy to use. In addition to refining the Go API, we have expanded our documentation in both GoDocs and the Wiki.
- Expanded Testing: We are committed to comprehensive test coverage. Increased test coverage has led to significant bug fixes, ensuring better reliability across a wide range of configurations.
wcharczuk/go-chart Changes
If you're migrating from wcharczuk/go-chart, you should be able to migrate with minimal modifications. The wcharczuk/go-chart codebase has been integrated into our chartdraw package. Any necessary changes are documented in our wcharczuk/go‐chart Migration Guide.


