
A project to visualize time range series data using the Sankey diagram.
Last updated Jul 1, 2026
95
Stars
3
Forks
0
Issues
0
Stars/day
Attention Score
34
Topics
Language breakdown
No language data available.
▸ Files
click to expand
README
Timeline-Sankey
A project to visualize time range series data using the Sankey diagram.
Features
- Visualization layout:
- Interactions:
Preview
You can play with the demo by tweaking any parameters on right side of the page.
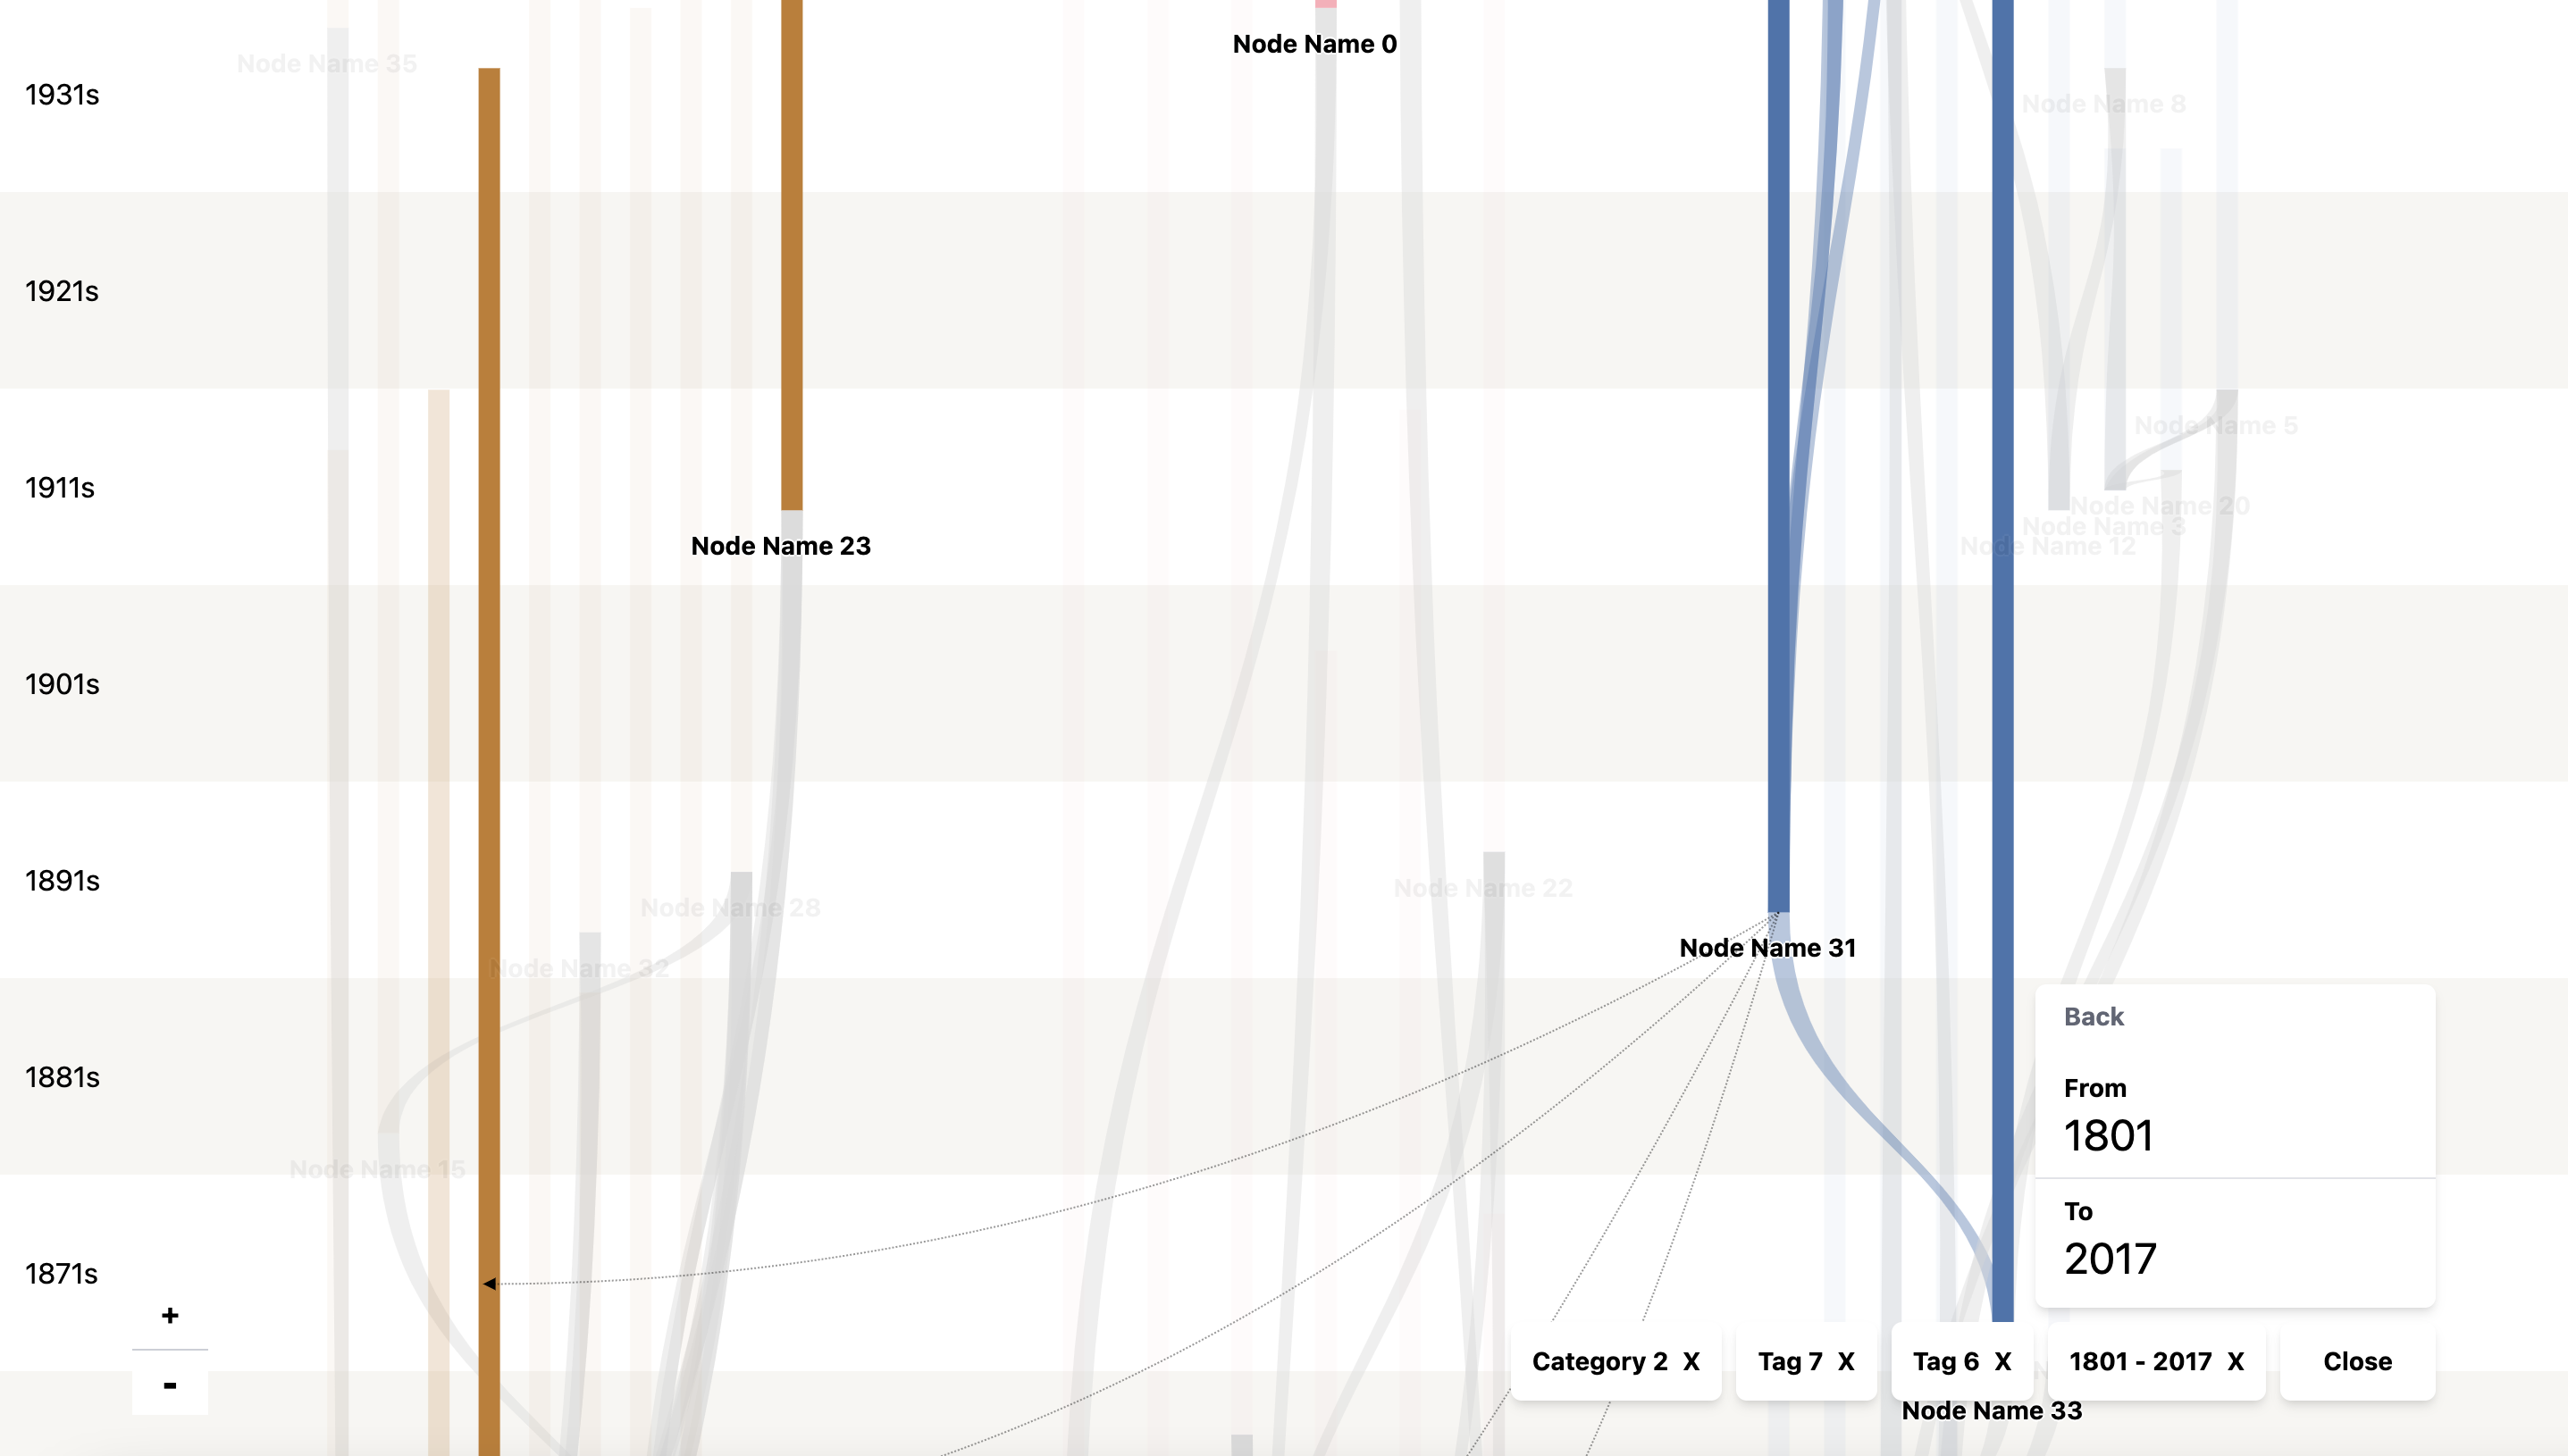
Desktop View
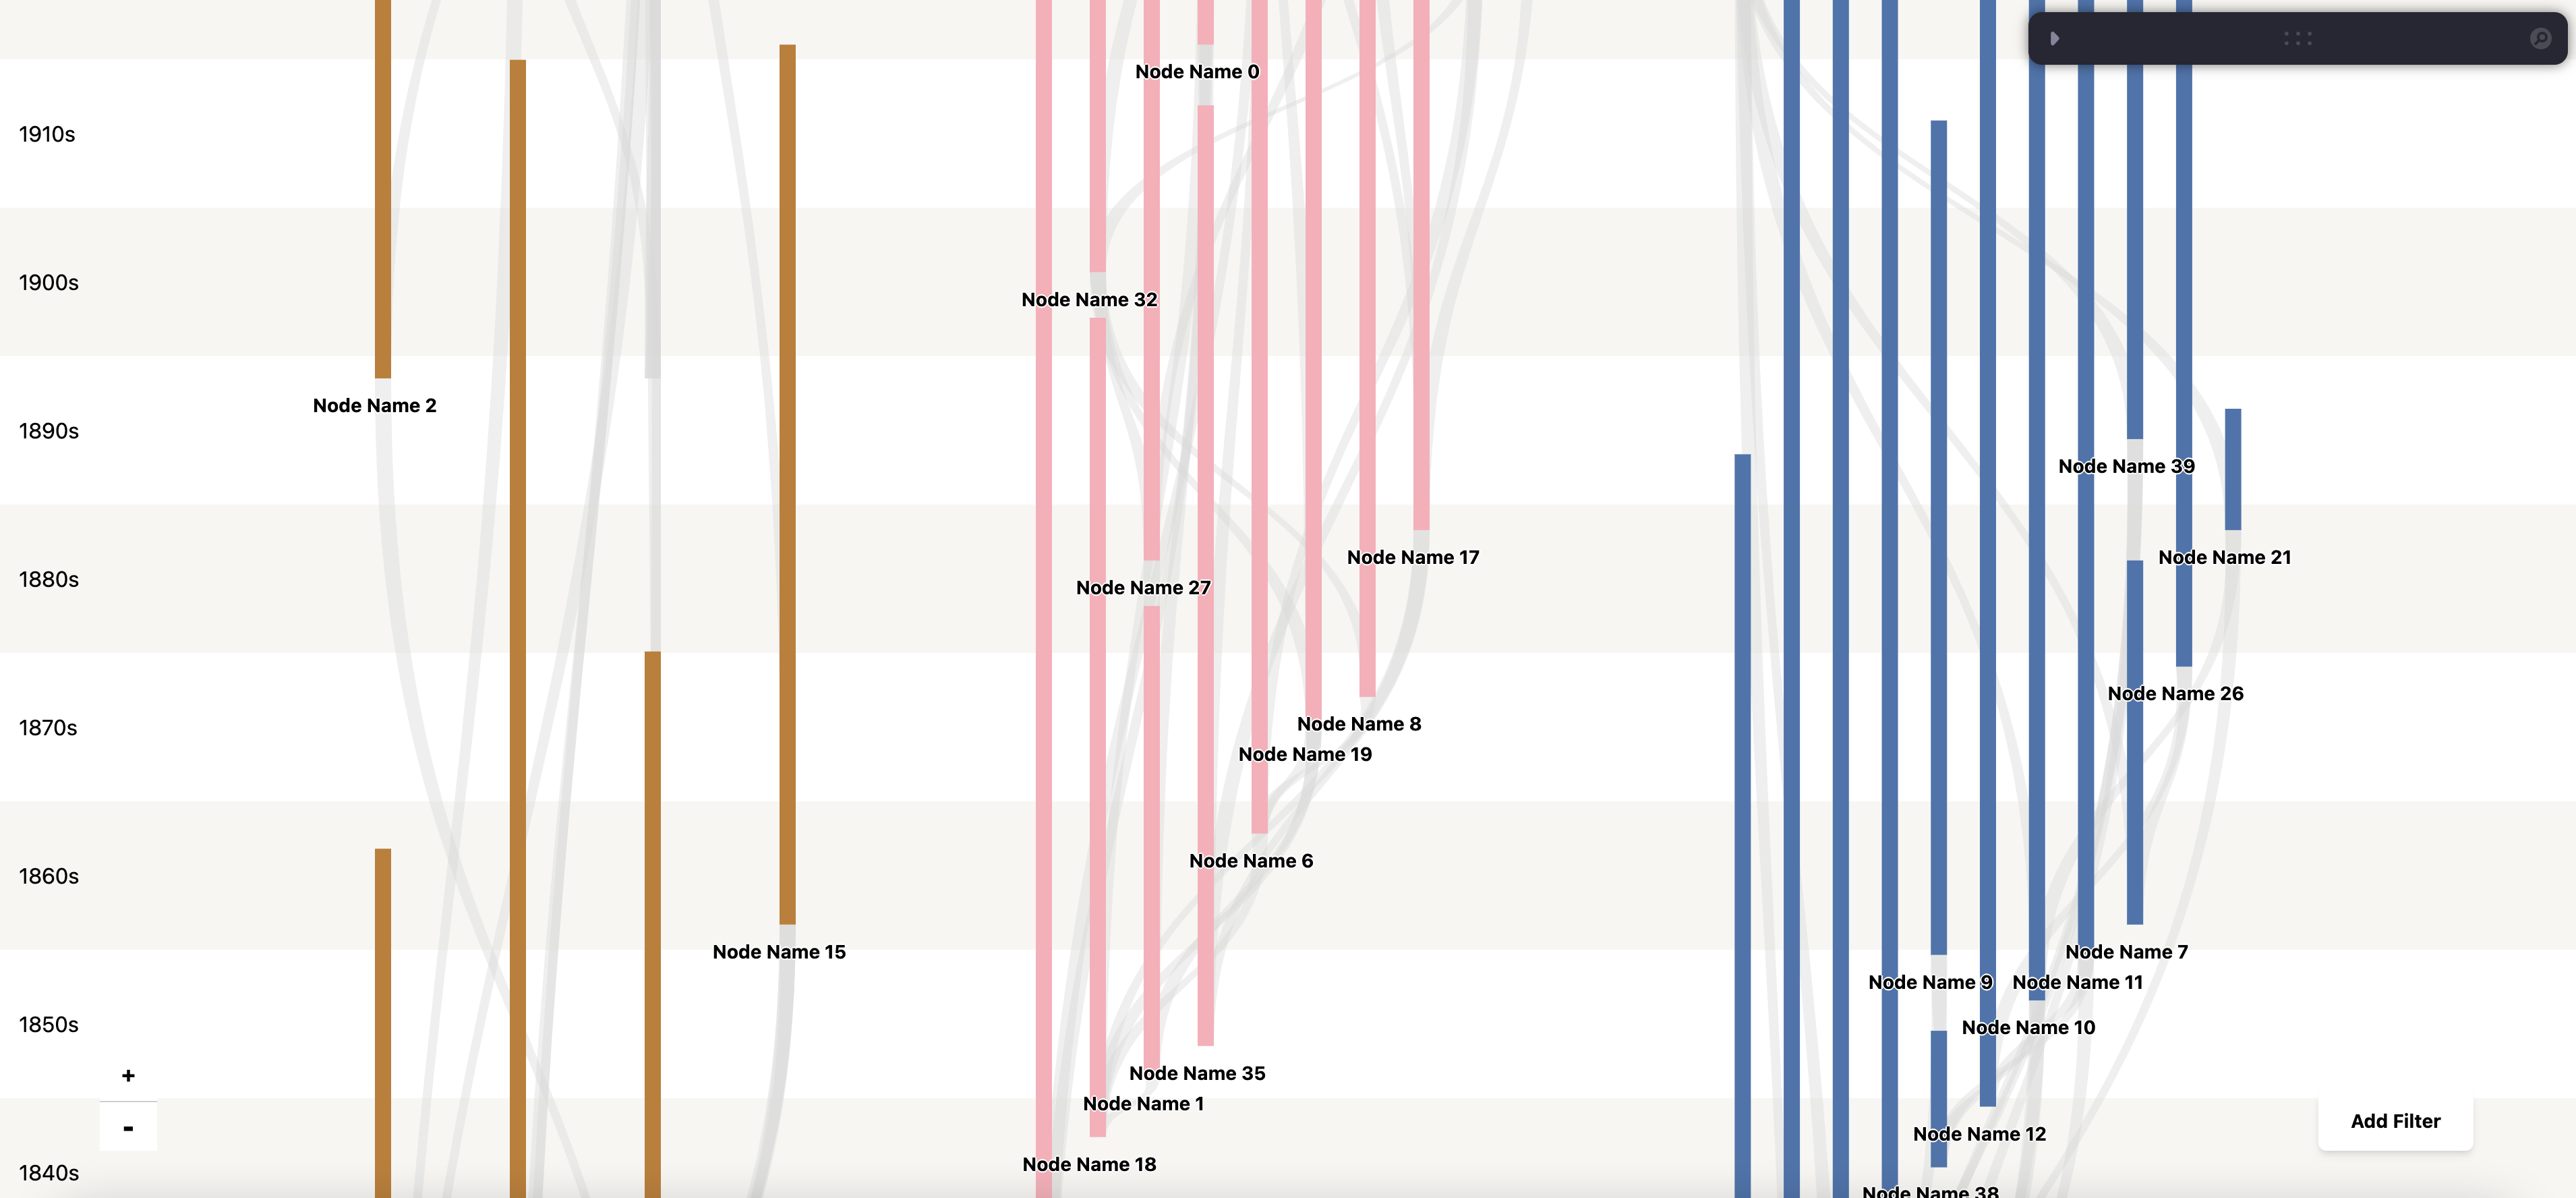
Interaction on desktop view
Mobile View
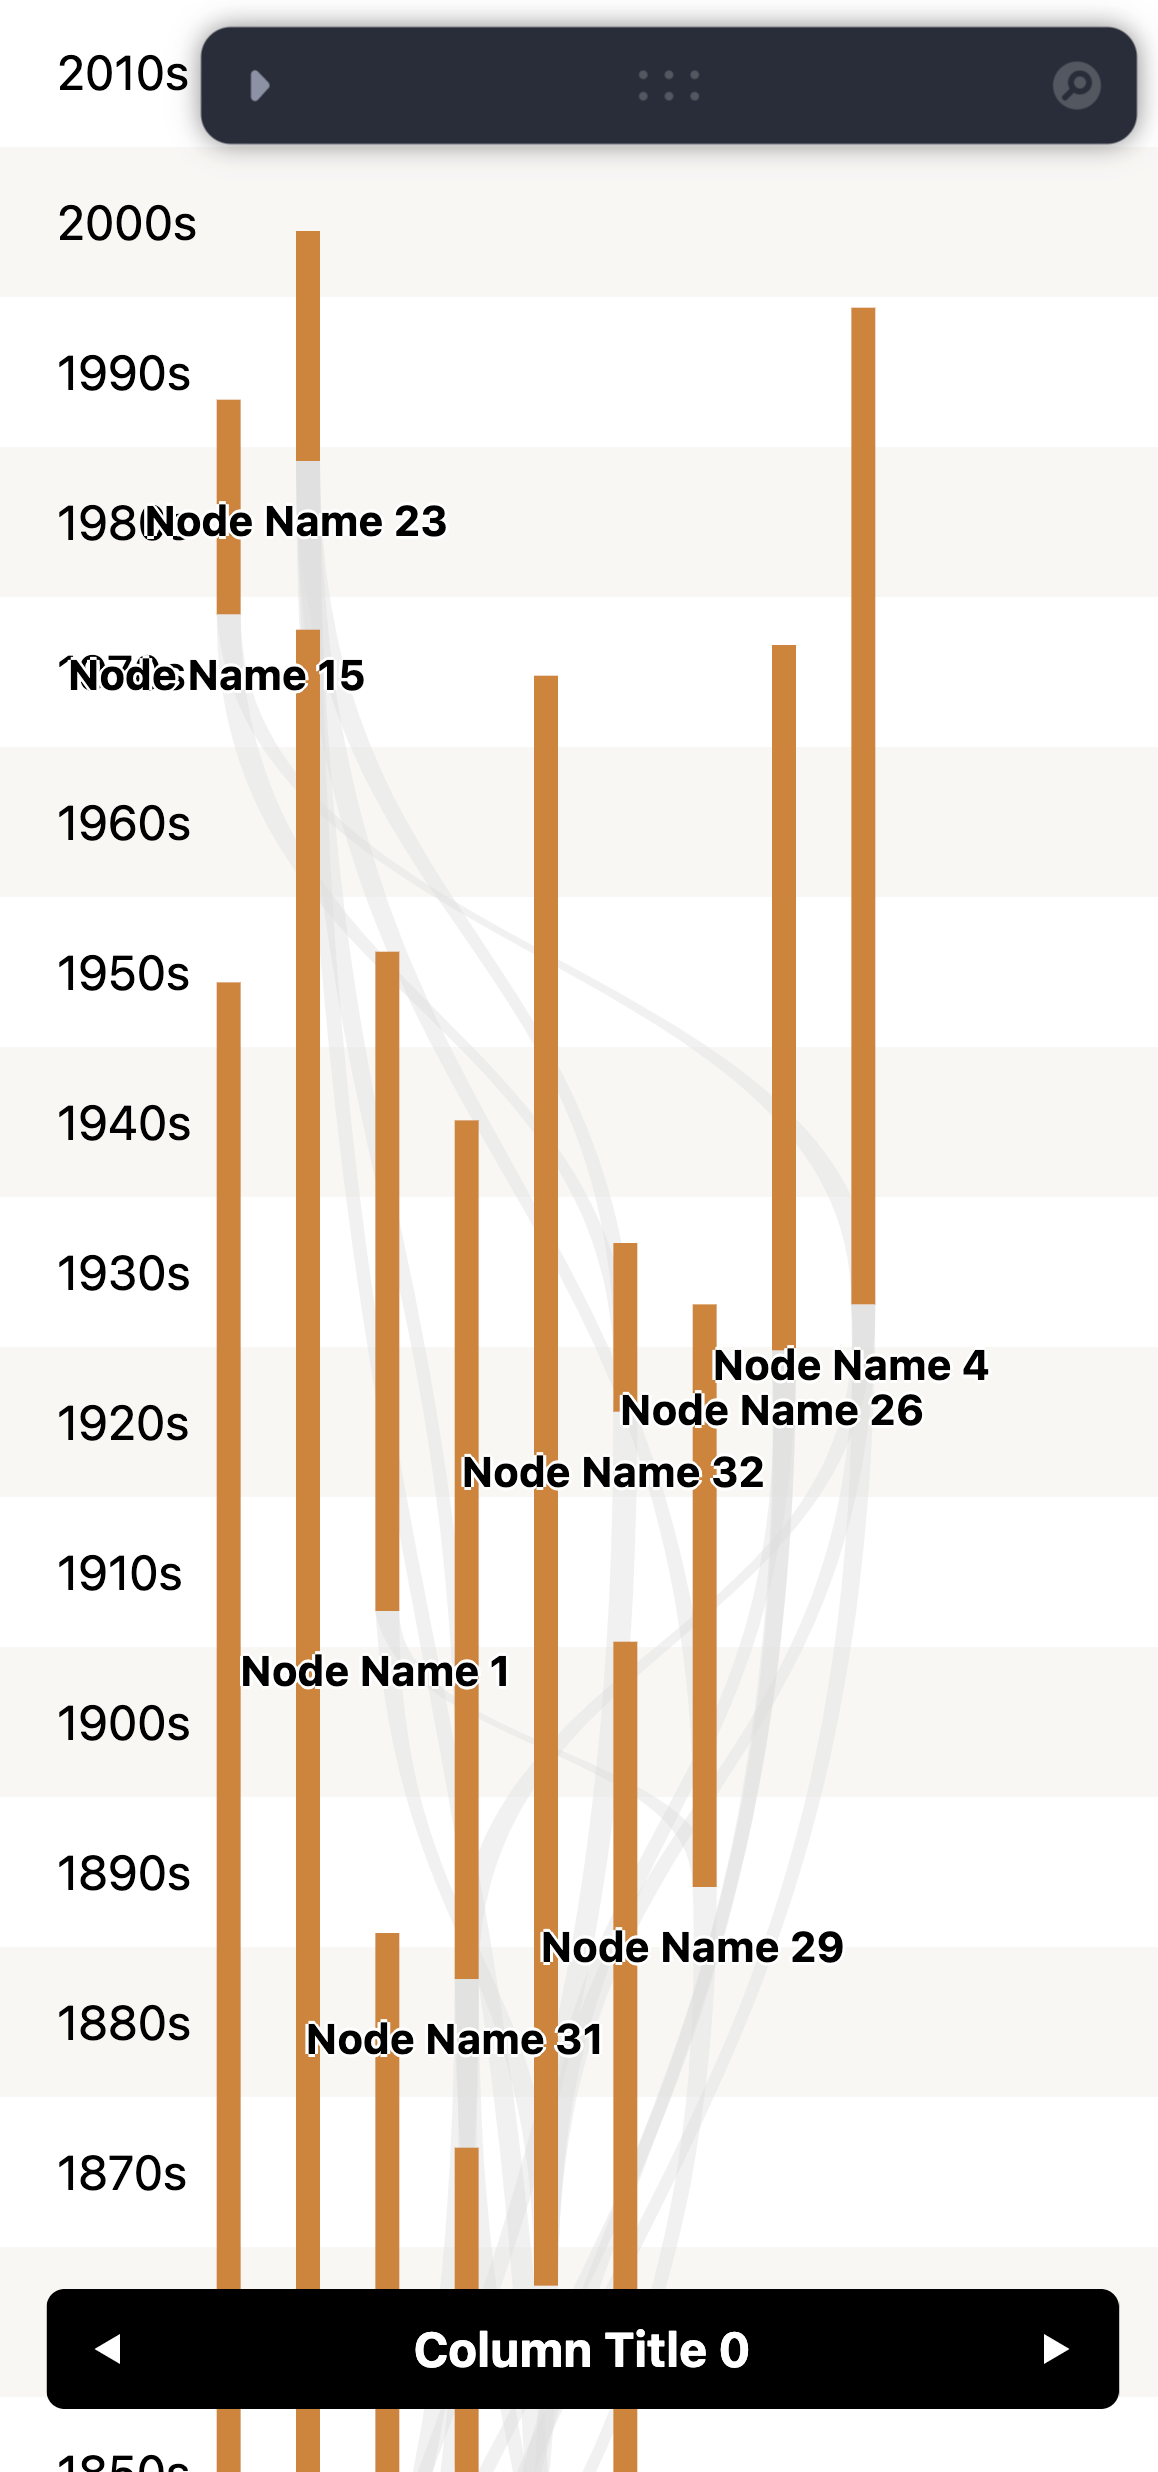
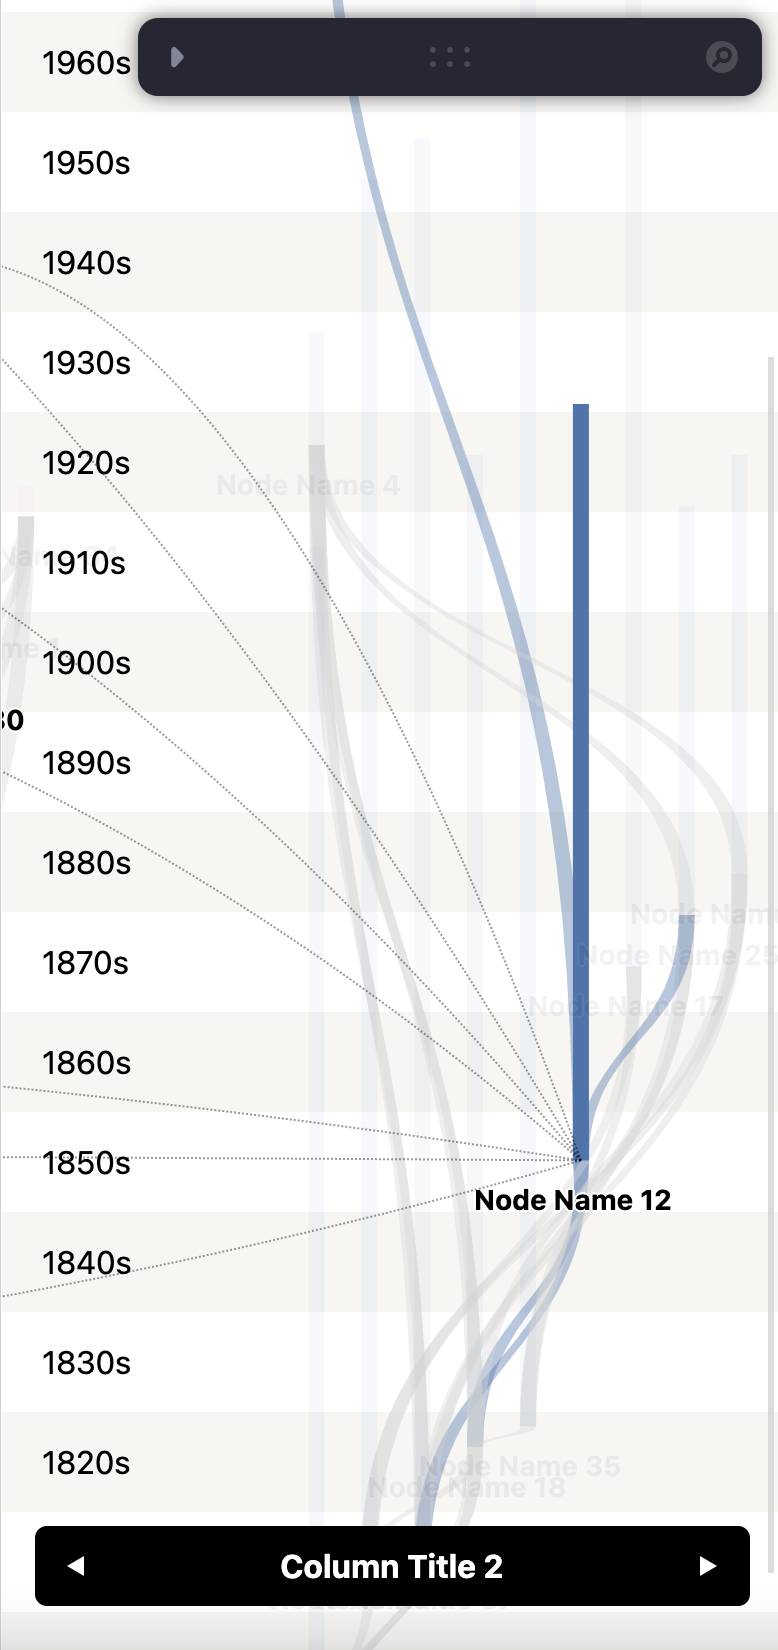
More preview images can be found in the preview folder.
Docs
This is not a library, but all parameters are exposed as public properties and which can be changed on the demo page. You can also go through the index.tsx to see all properties.
Visualization Algorithm
- Simple calculation of node position witnin each series(grid, column) to make them side by side as much as possible. So it's not a classical Sankey diagram algorithm like which d3 is using
- Connect nodes with links then
- Calculate node properties when interacting or filtering


