
fastquant — Backtest and optimize your ML trading strategies with only 3 lines of code!
fastquant :nerd_face:


Bringing backtesting to the mainstream
fastquant allows you to easily backtest investment strategies with as few as 3 lines of python code. Its goal is to promote data driven investments by making quantitative analysis in finance accessible to everyone.
To do this type of analysis without coding, you can also try out Hawksight, which was just recently launched! :smile:
If you want to interact with us directly, you can also reach us on the Hawksight discord. Feel free to ask about fastquant in the #feedback-suggestions and #bug-report channels.
Features
- Easily access historical stock data
- Backtest and optimize trading strategies with only 3 lines of code
* - Both Yahoo Finance and Philippine stock data data are accessible straight from fastquant
Check out our blog posts in the fastquant website and this intro article on Medium!
Installation
Python
pip install fastquant
or
python -m pip install fastquant
Get stock data
All symbols from Yahoo Finance and Philippine Stock Exchange (PSE) are accessible viagetstockdata.
Python
from fastquant import getstockdata
df = getstockdata("JFC", "2018-01-01", "2019-01-01")
print(df.head())
          dt  close
  2019-01-01  293.0
  2019-01-02  292.0
  2019-01-03  309.0
  2019-01-06  323.0
  2019-01-07  321.0
Get crypto data
The data is pulled from Binance, and all the available tickers are found here.Python
from fastquant import getcryptodata
crypto = getcryptodata("BTC/USDT", "2018-12-01", "2019-12-31")
crypto.head()
            open    high     low     close    volume
dt
2018-12-01  4041.27  4299.99  3963.01  4190.02  44840.073481
2018-12-02  4190.98  4312.99  4103.04  4161.01  38912.154790
2018-12-03  4160.55  4179.00  3827.00  3884.01  49094.369163
2018-12-04  3884.76  4085.00  3781.00  3951.64  48489.551613
2018-12-05  3950.98  3970.00  3745.00  3769.84  44004.799448
Backtest trading strategies
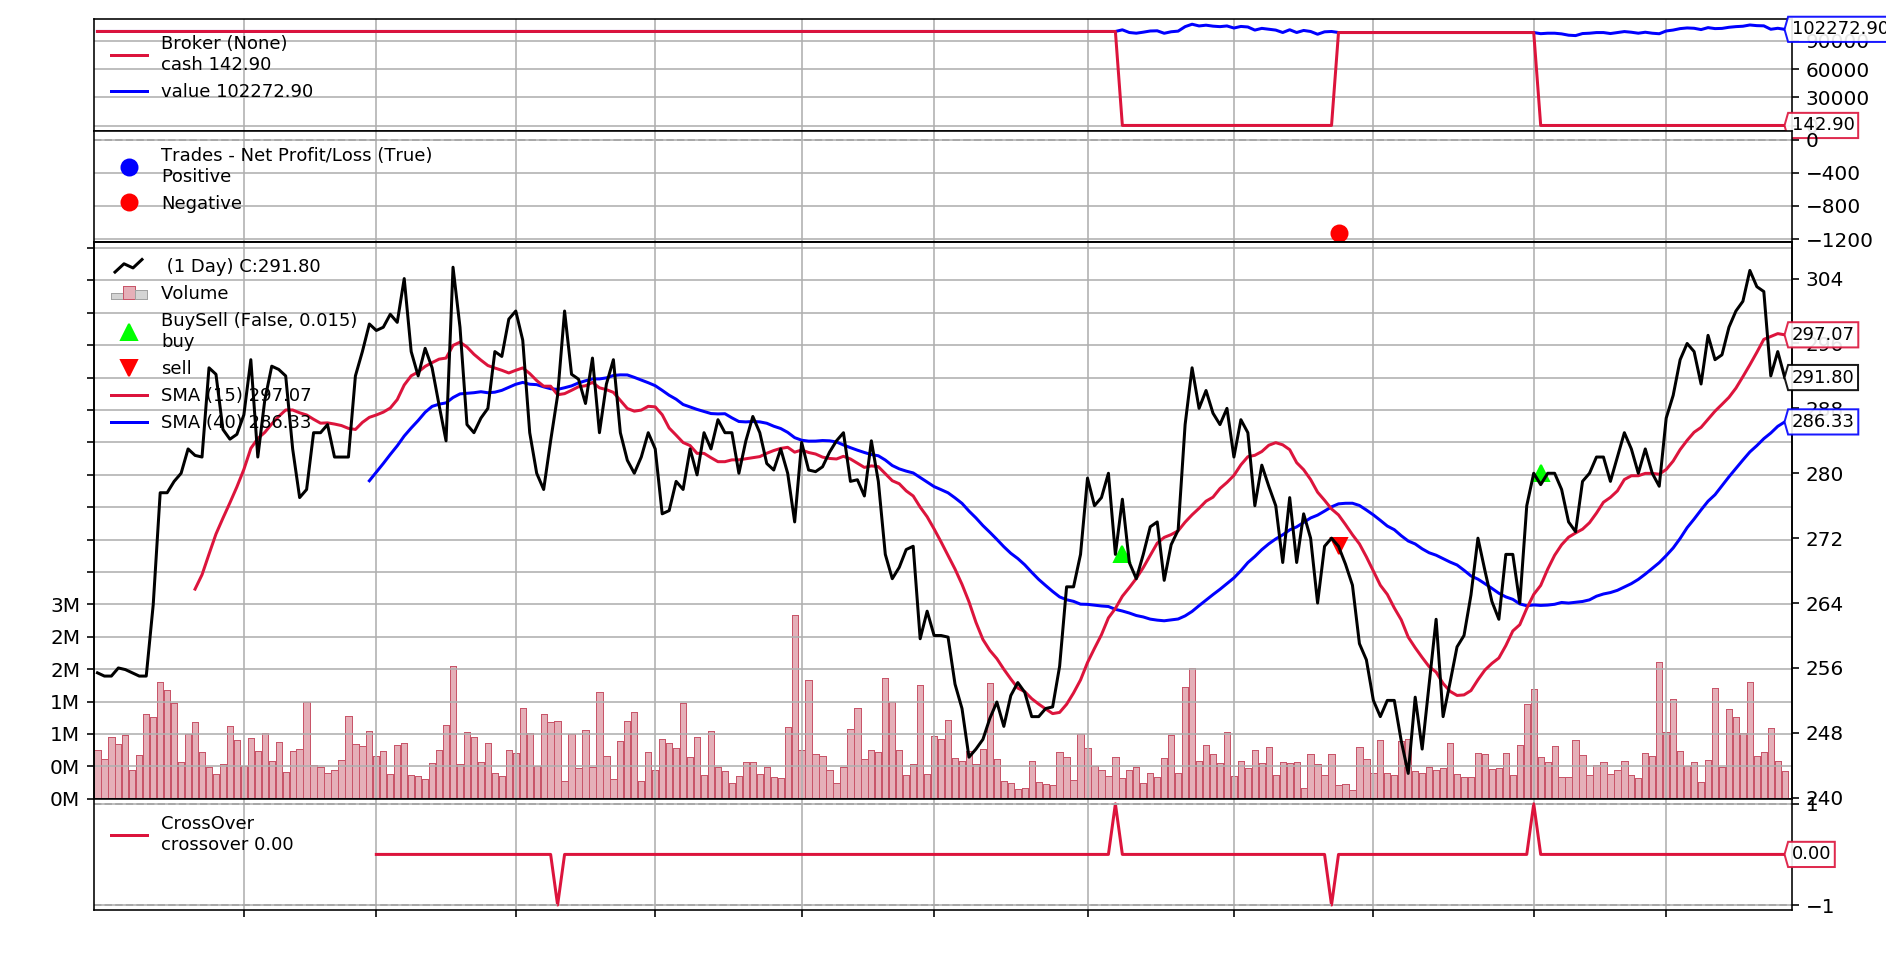
Simple Moving Average Crossover (15 day MA vs 40 day MA)
Daily Jollibee prices from 2018-01-01 to 2019-01-01from fastquant import backtest
backtest('smac', df, fastperiod=15, slowperiod=40)
Starting Portfolio Value: 100000.00
Final Portfolio Value: 102272.90
Want to do this without coding at all?
If you want to make this kind of analysis even more simple without having to code at all (or want to avoid the pain of doing all of the setup required), you can signup for free and try out Hawksight - this new no-code tool I’m building to democratize data driven investments.
Hoping to make these kinds of powerful analyses accessible to more people!
Optimize trading strategies with automated grid search
fastquant allows you to automatically measure the performance of your trading strategy on multiple combinations of parameters. All you need to do is to input the values as iterators (like as a list or range).
Simple Moving Average Crossover (15 to 30 day MA vs 40 to 55 day MA)
Daily Jollibee prices from 2018-01-01 to 2019-01-01from fastquant import backtest
res = backtest("smac", df, fastperiod=range(15, 30, 3), slowperiod=range(40, 55, 3), verbose=False)
Optimal parameters: {'initcash': 100000, 'buyprop': 1, 'sellprop': 1, 'executiontype': 'close', 'fastperiod': 15, 'slowperiod': 40}
Optimal metrics: {'rtot': 0.022, 'ravg': 9.25e-05, 'rnorm': 0.024, 'rnorm100': 2.36, 'sharperatio': None, 'pnl': 2272.9, 'final_value': 102272.90}
print(res[['fastperiod', 'slowperiod', 'final_value']].head())
# fastperiod slowperiod final_value #0 15 40 102272.90 #1 21 40 98847.00 #2 21 52 98796.09 #3 24 46 98008.79 #4 15 46 97452.92
Library of trading strategies
| Strategy | Alias | Parameters | | --- | --- | --- | | Relative Strength Index (RSI) | rsi | rsiperiod, rsiupper, rsi_lower | | Simple moving average crossover (SMAC) | smac | fastperiod, slowperiod | | Exponential moving average crossover (EMAC) | emac | fastperiod, slowperiod | | Moving Average Convergence Divergence (MACD) | macd | fastperod, slowupper, signalperiod, smaperiod, dir_period | | Bollinger Bands | bbands | period, devfactor | | Buy and Hold | buynhold | N/A | | Sentiment Strategy | sentiment | keyword , page_nums, senti | | Custom Prediction Strategy | custom | upperlimit, lowerlimit, custom_column | | Custom Ternary Strategy | ternary | buyint, sellint, custom_column |
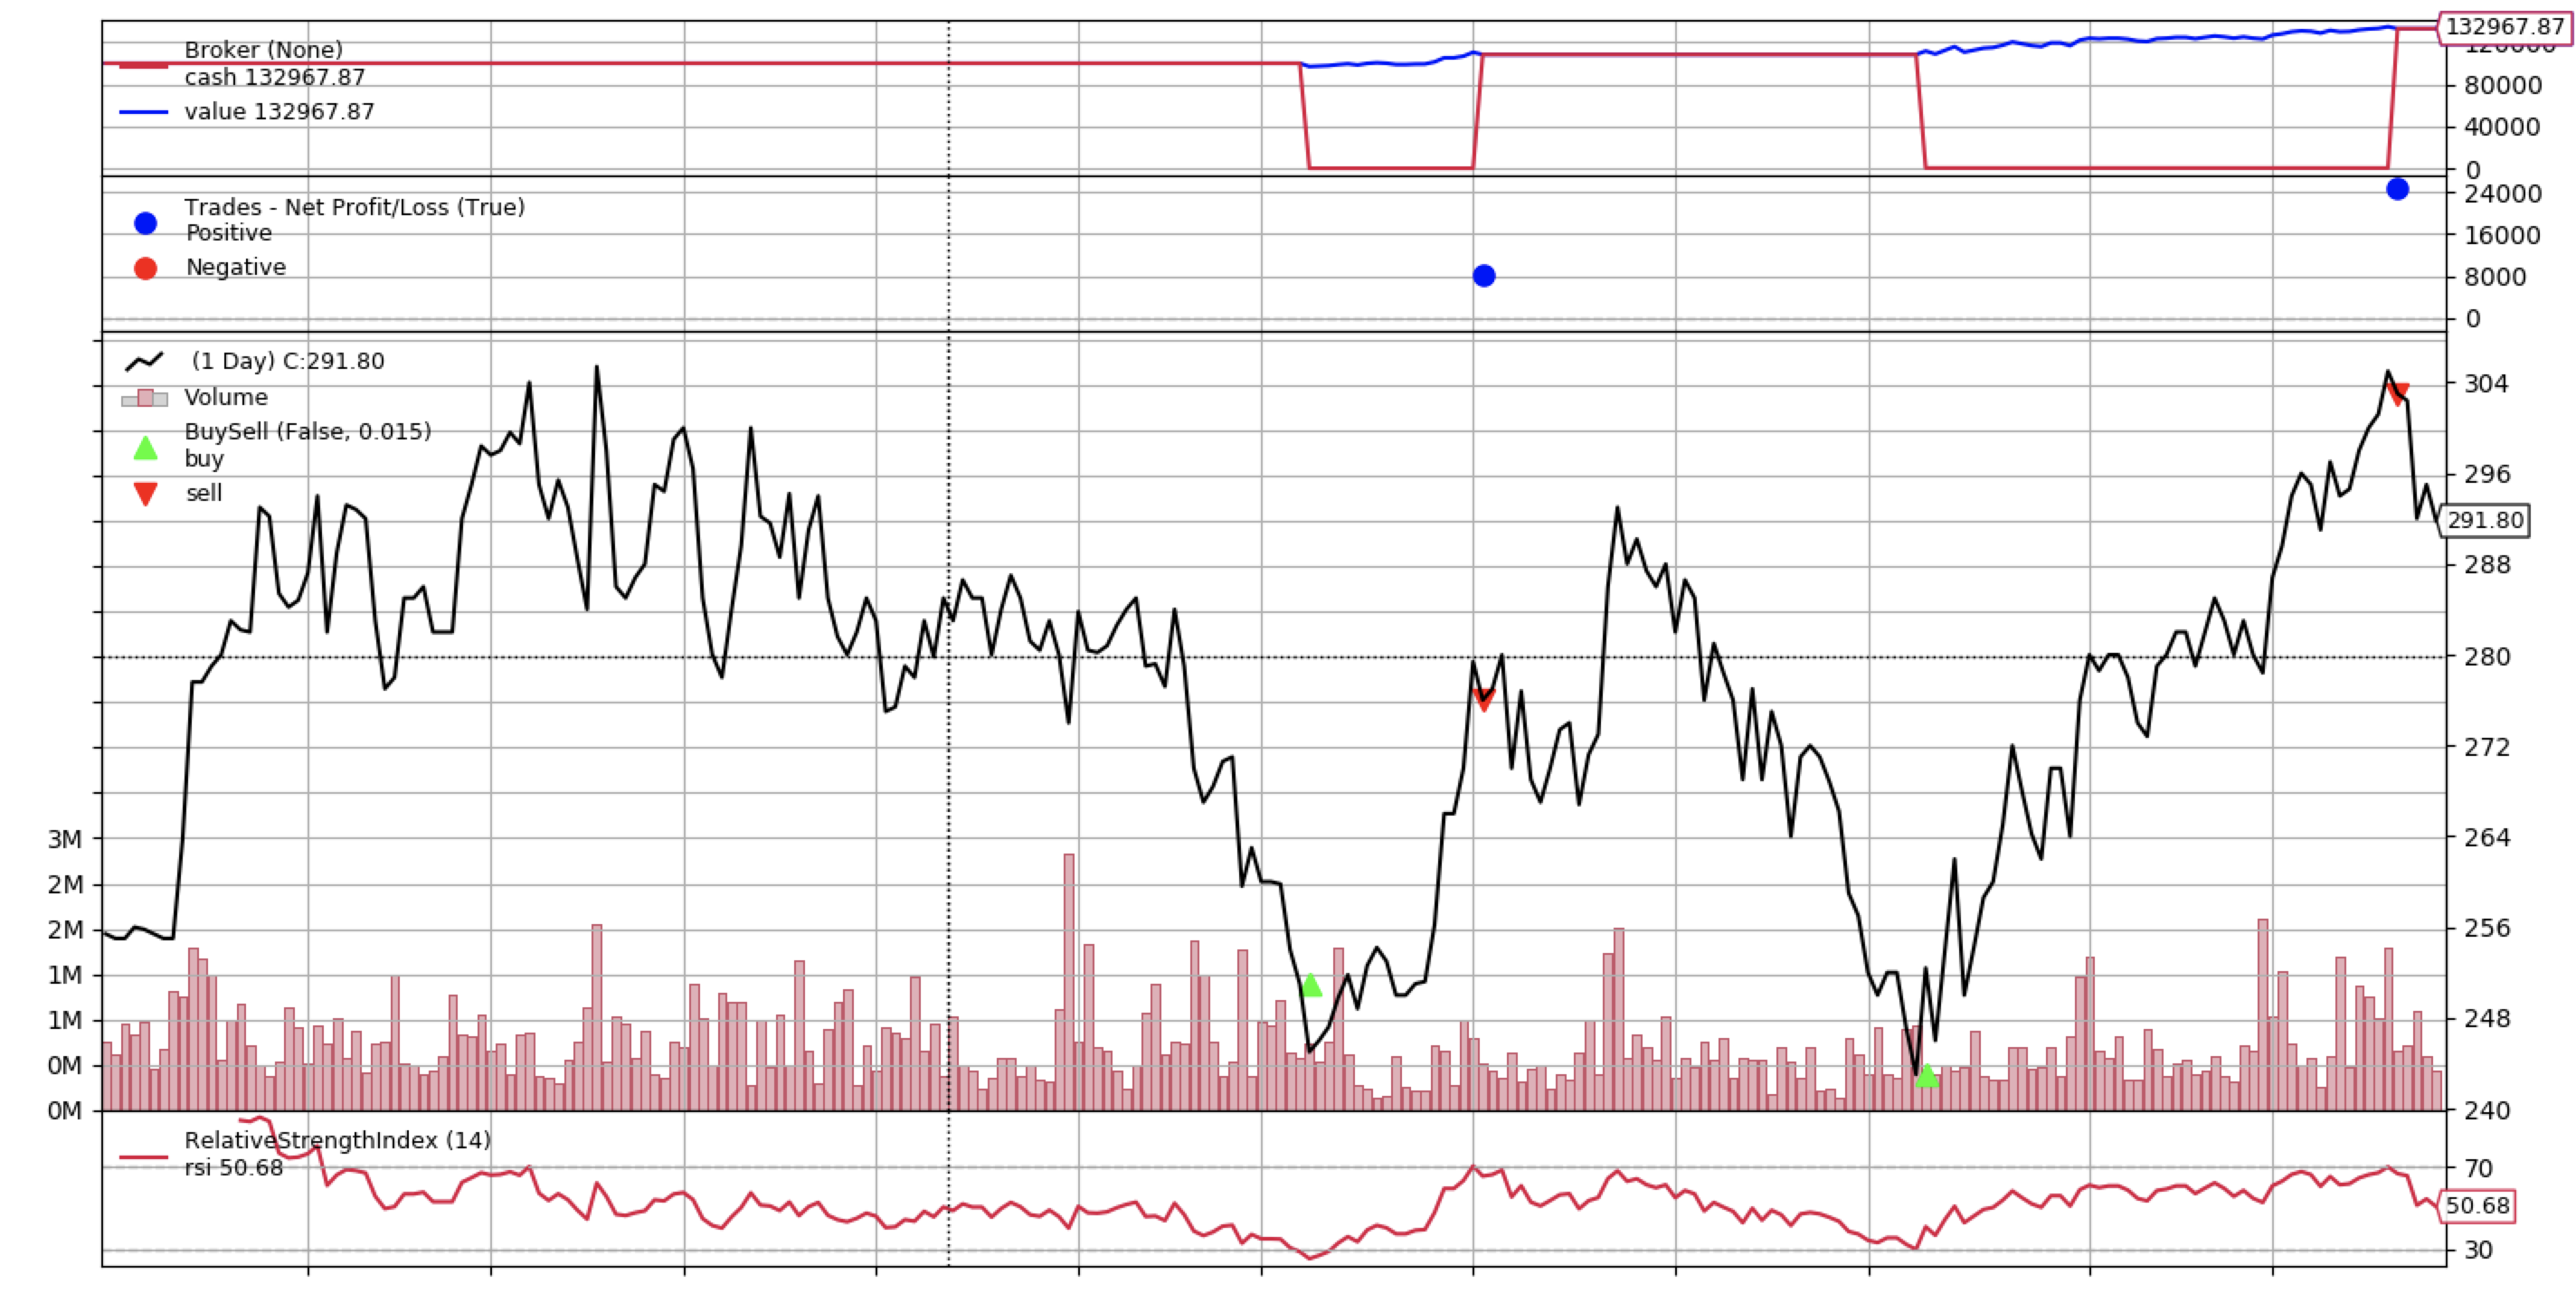
Relative Strength Index (RSI) Strategy
backtest('rsi', df, rsiperiod=14, rsiupper=70, rsi_lower=30)
Starting Portfolio Value: 100000.00
Final Portfolio Value: 132967.87
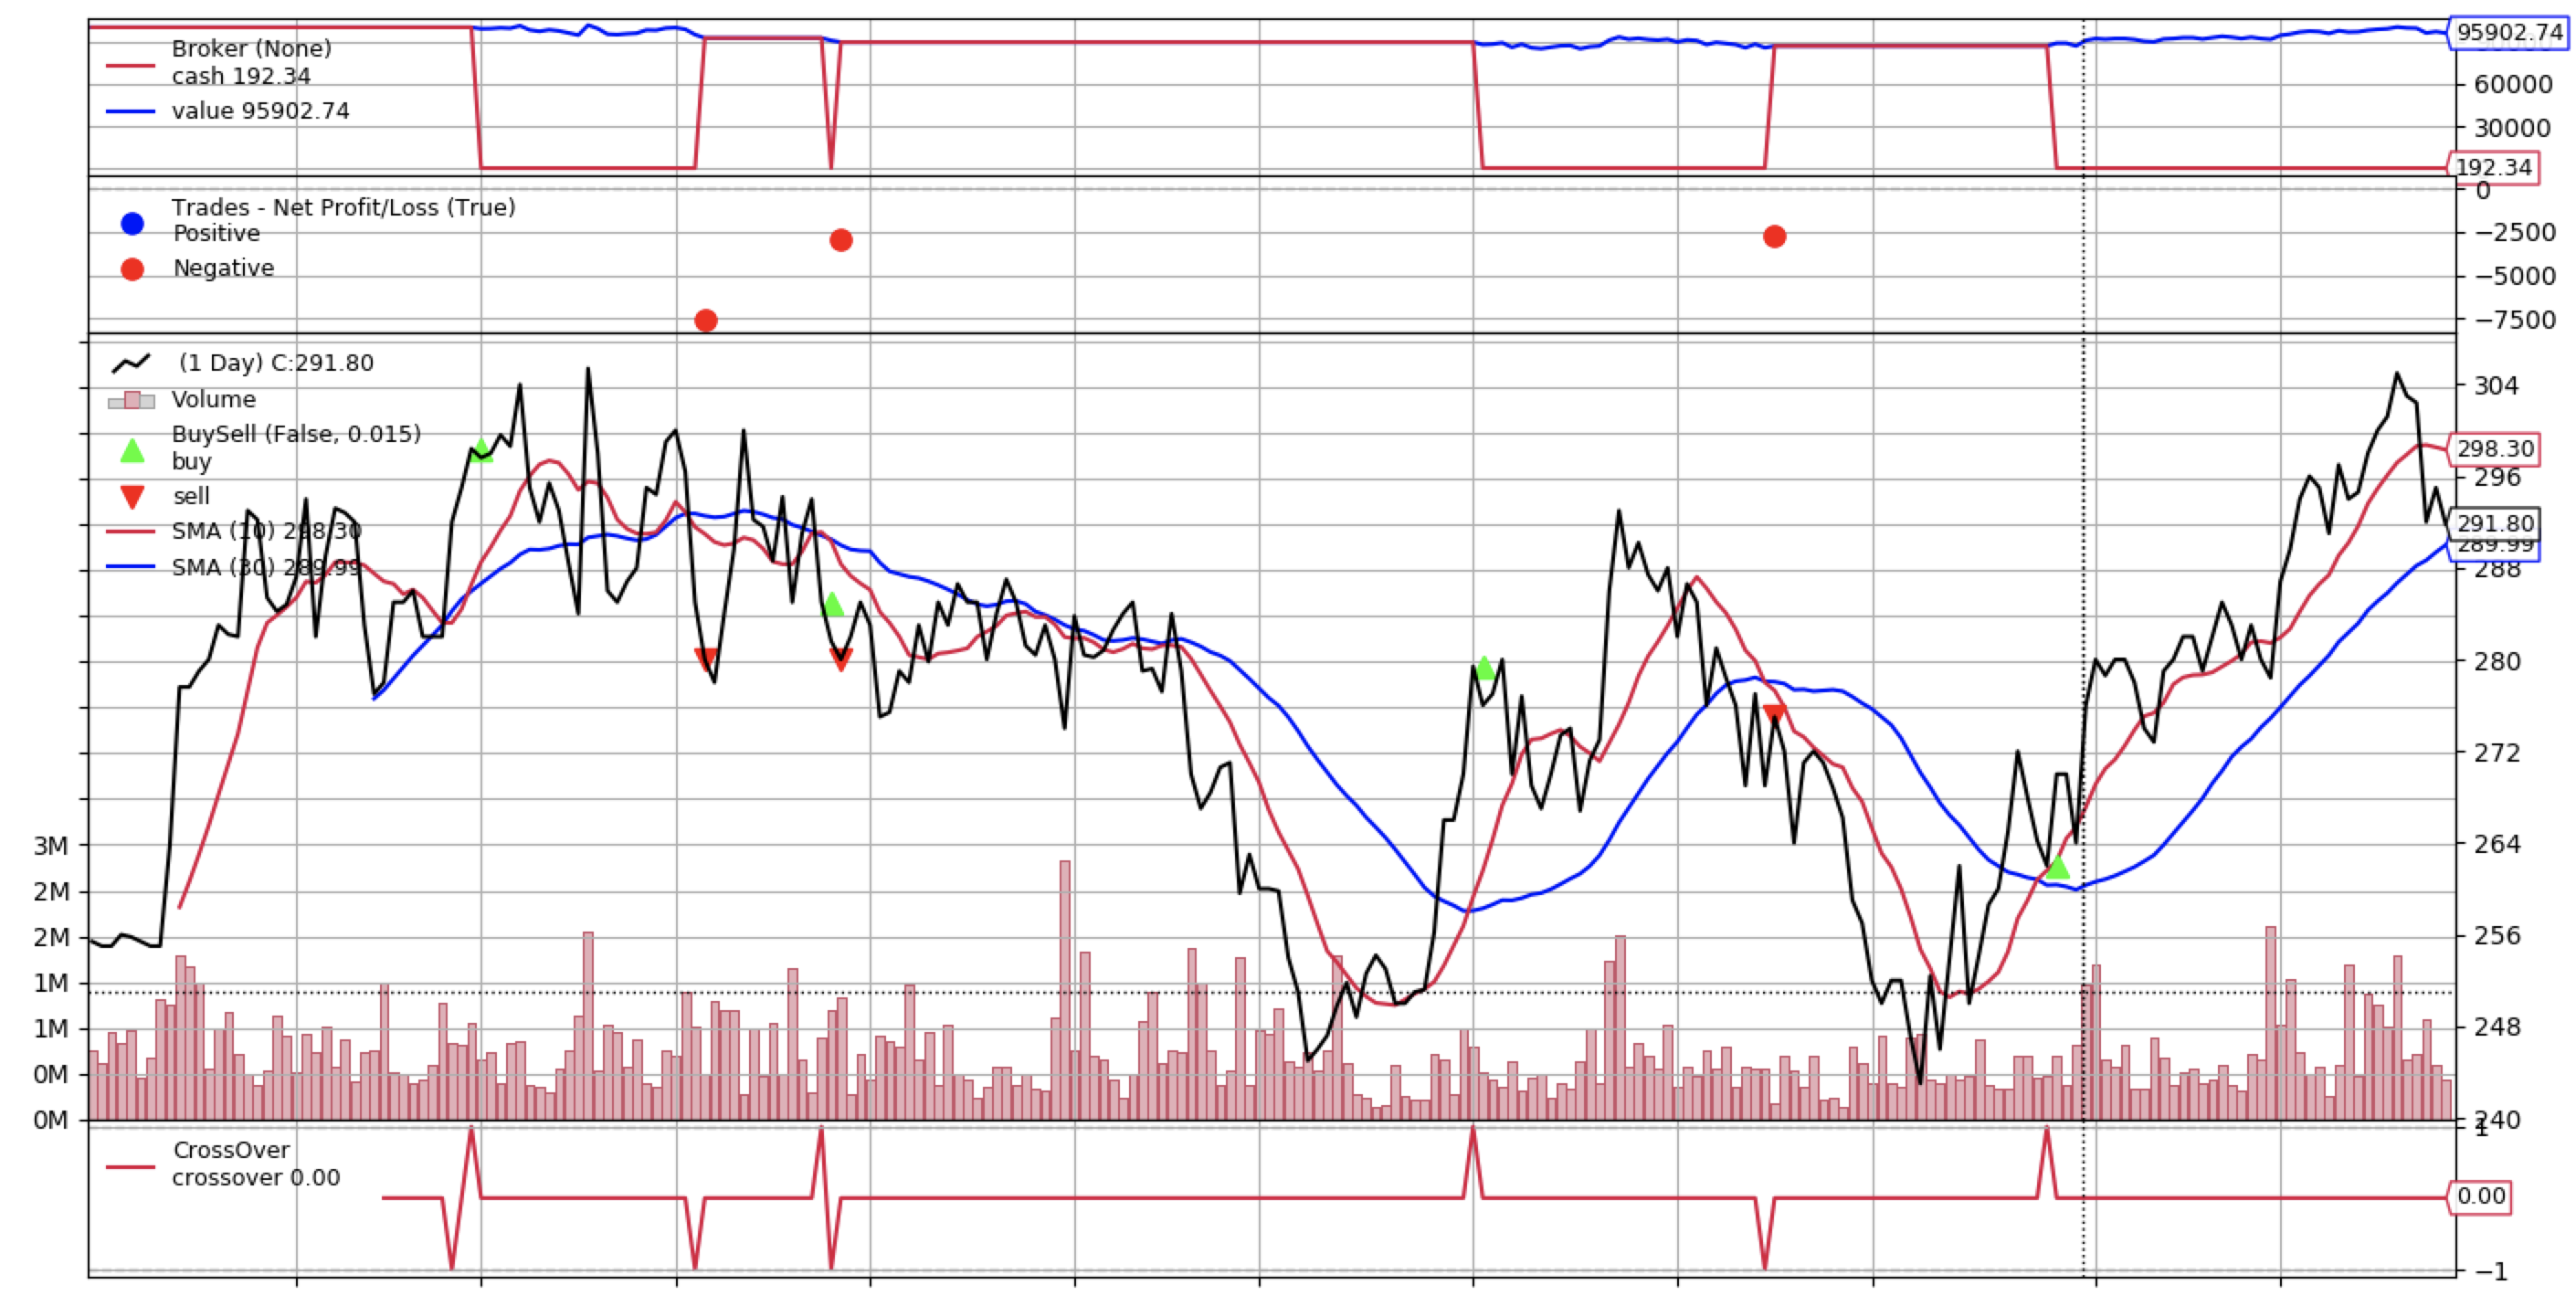
Simple moving average crossover (SMAC) Strategy
backtest('smac', df, fastperiod=10, slowperiod=30)
Starting Portfolio Value: 100000.00
Final Portfolio Value: 95902.74
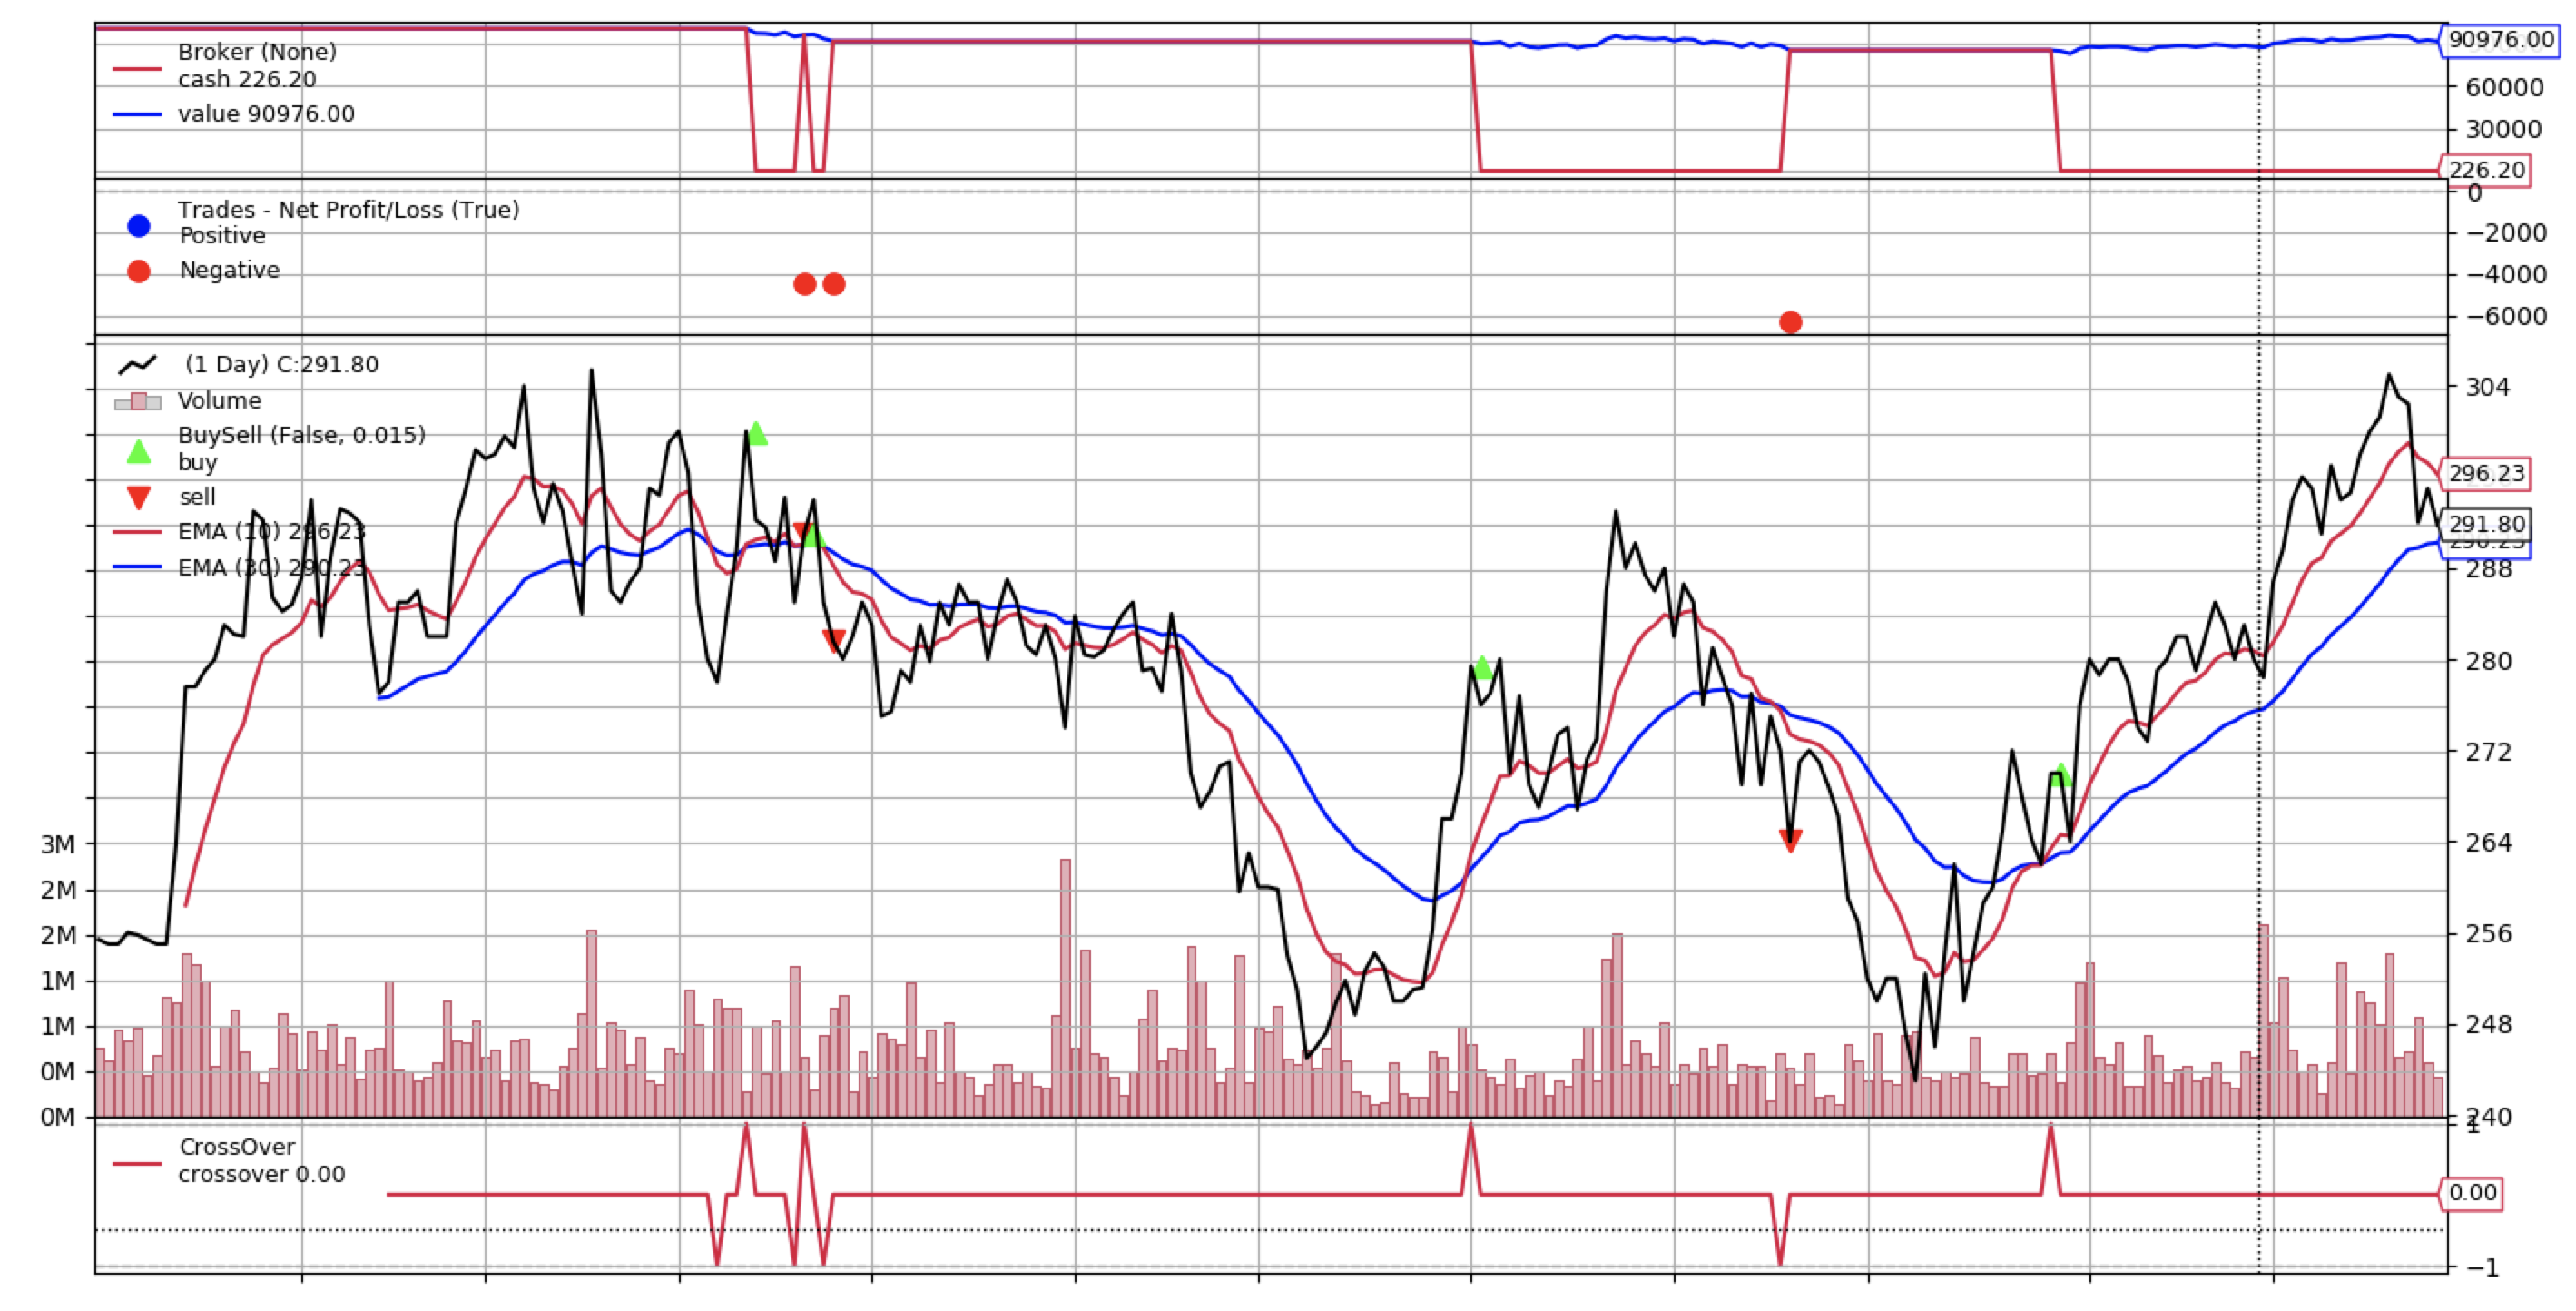
Exponential moving average crossover (EMAC) Strategy
backtest('emac', df, fastperiod=10, slowperiod=30)
Starting Portfolio Value: 100000.00
Final Portfolio Value: 90976.00
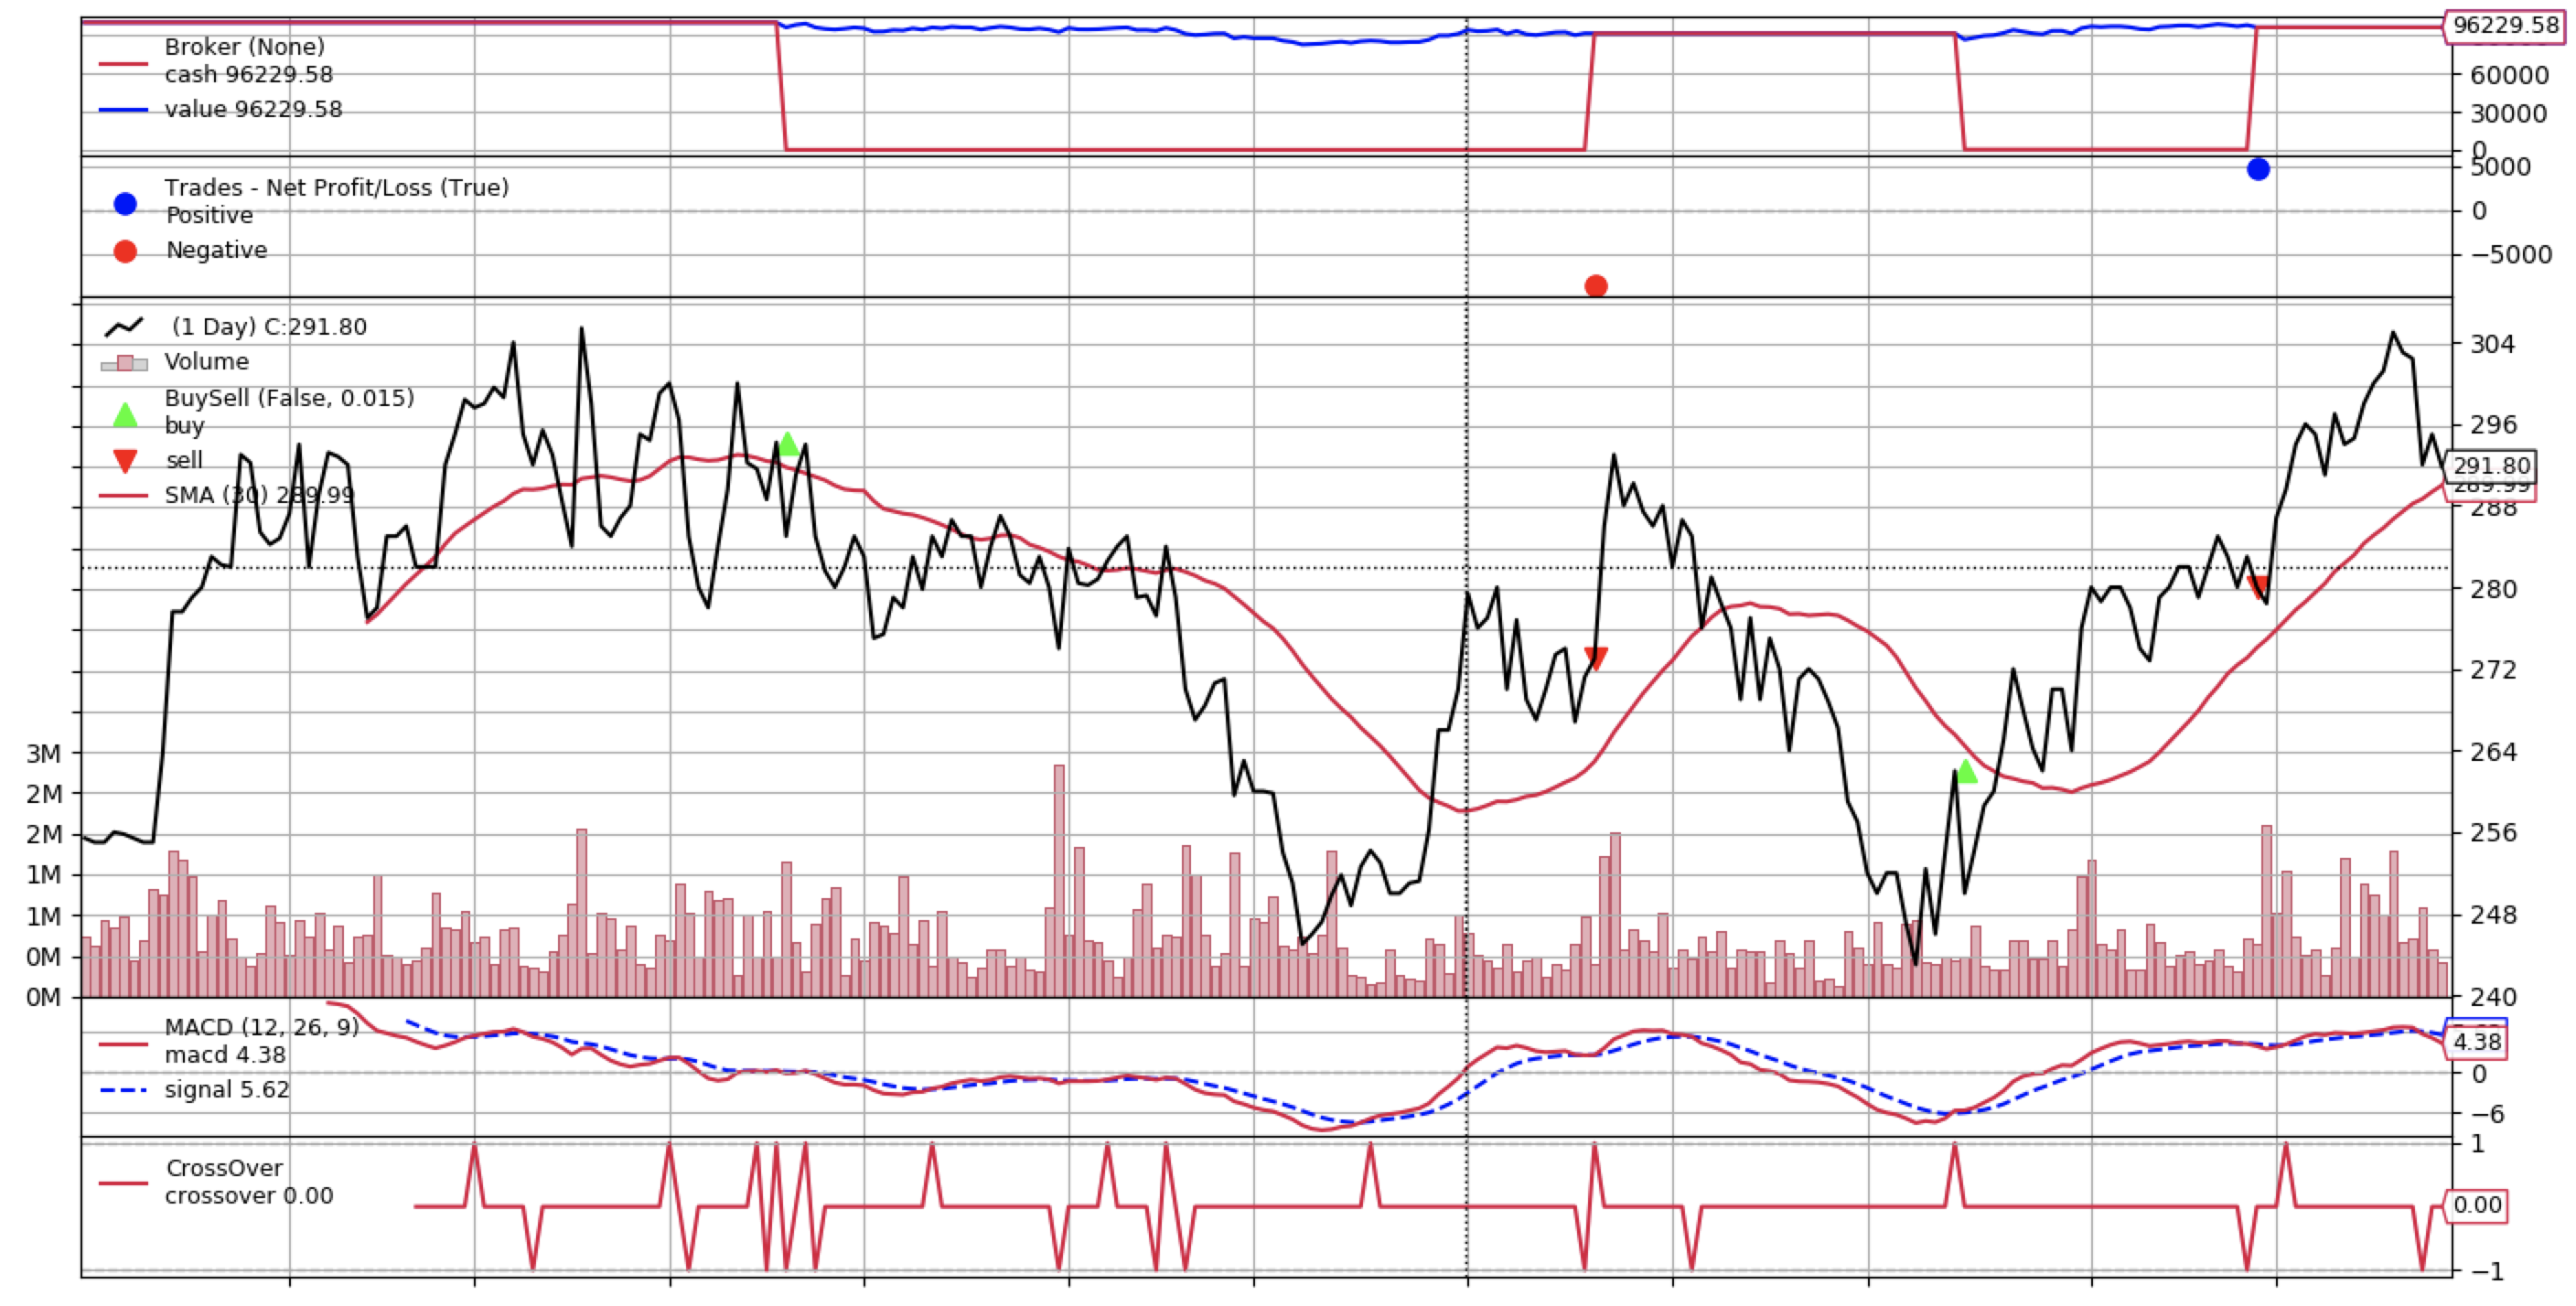
Moving Average Convergence Divergence (MACD) Strategy
backtest('macd', df, fastperiod=12, slowperiod=26, signalperiod=9, smaperiod=30, dir_period=10)
Starting Portfolio Value: 100000.00
Final Portfolio Value: 96229.58
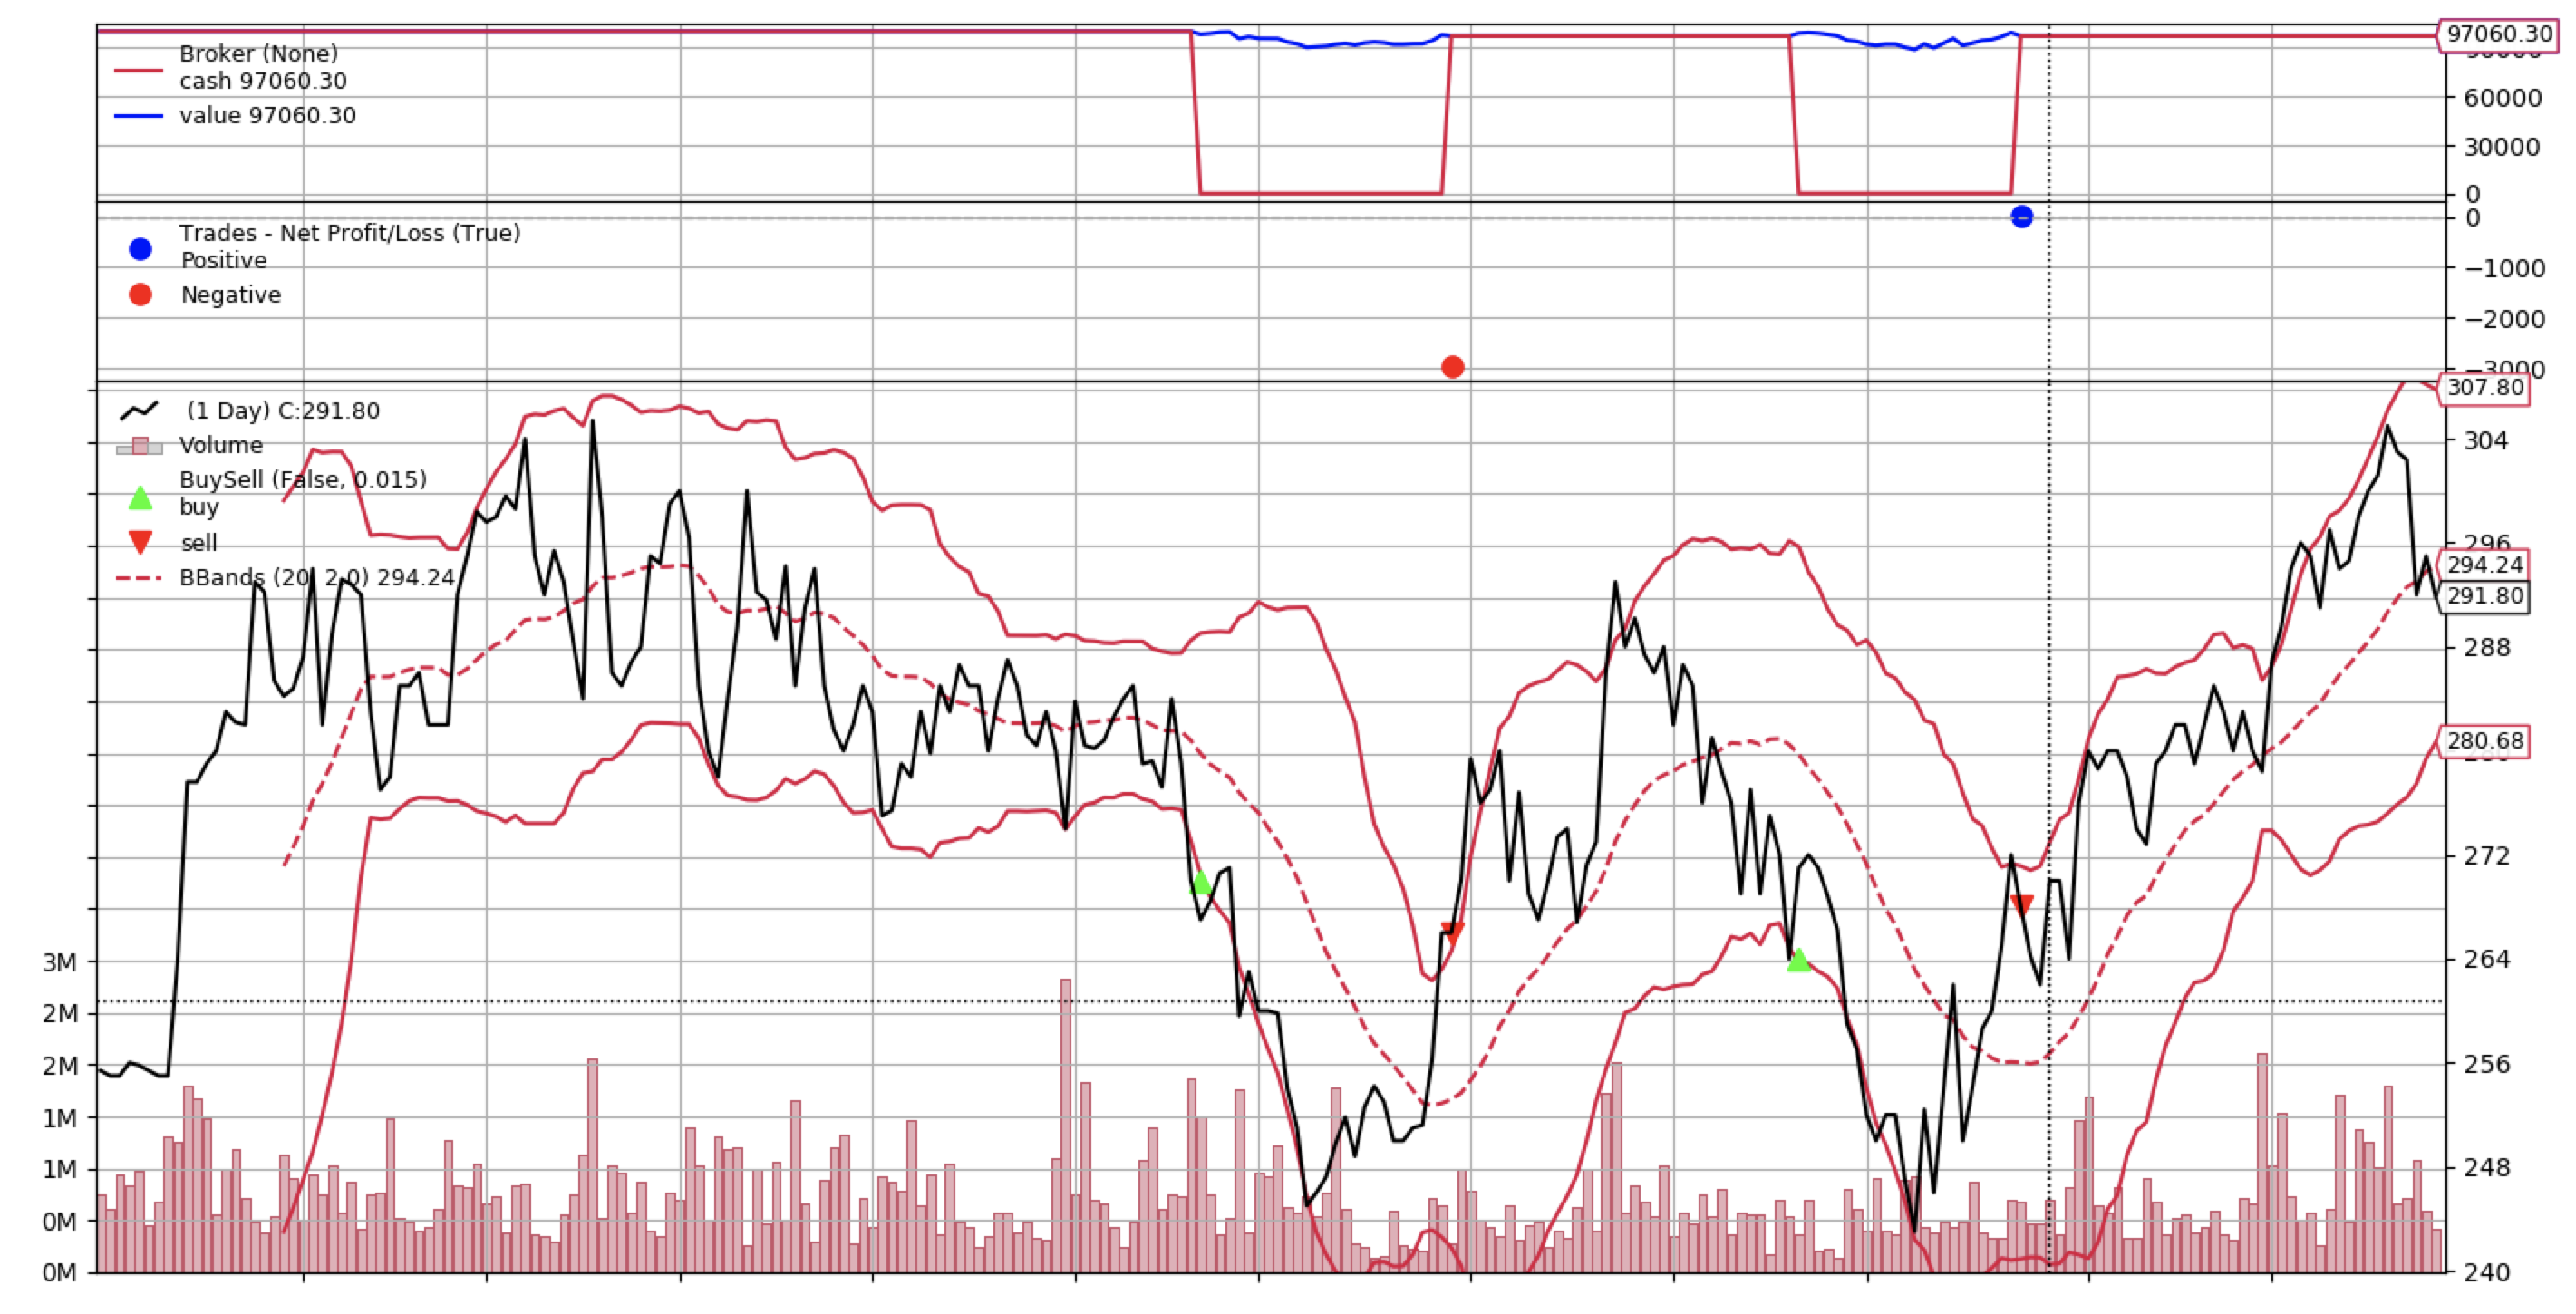
Bollinger Bands Strategy
backtest('bbands', df, period=20, devfactor=2.0)
Starting Portfolio Value: 100000.00
Final Portfolio Value: 97060.30
News Sentiment Strategy
Use Tesla (TSLA) stock from yahoo finance and news articles from Business Timesfrom fastquant import getyahoodata, getbtnews_sentiment
data = getyahoodata("TSLA", "2020-01-01", "2020-07-04")
sentiments = getbtnewssentiment(keyword="tesla", pagenums=3)
backtest("sentiment", data, sentiments=sentiments, senti=0.2)
Starting Portfolio Value: 100000.00
Final Portfolio Value: 313198.37
Note: Unfortunately, you can't recreate this scenario due to inconsistencies in the dates and sentiments that is scraped by getbtnews_sentiment. In order to have a quickstart with News Sentiment Strategy you need to make the dates consistent with the sentiments that you are scraping.
from fastquant import getyahoodata, getbtnews_sentiment from datetime import datetime, timedelta
we get the current date and delta time of 30 days
current_date = datetime.now().strftime("%Y-%m-%d")
delta_date = (datetime.now() - timedelta(30)).strftime("%Y-%m-%d")
data = getyahoodata("TSLA", deltadate, currentdate)
sentiments = getbtnewssentiment(keyword="tesla", pagenums=3)
backtest("sentiment", data, sentiments=sentiments, senti=0.2)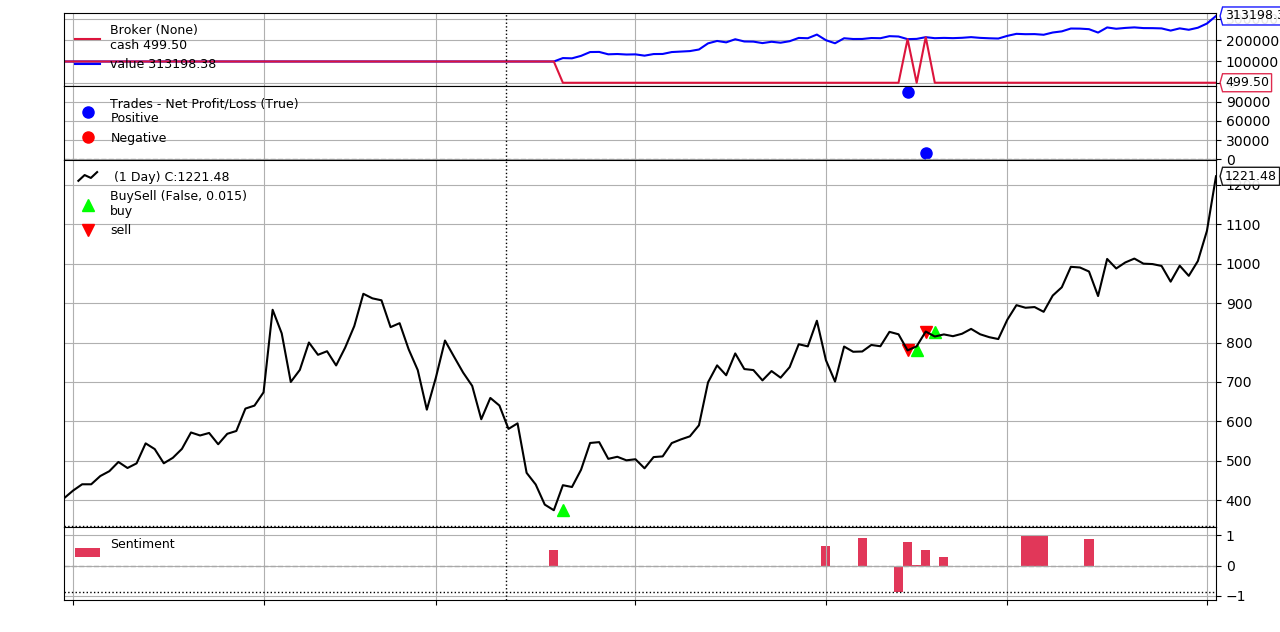
Multi Strategy
Multiple registered strategies can be utilized together in an OR fashion, where buy or sell signals are applied when at least one of the strategies trigger them.
df = getstockdata("JFC", "2018-01-01", "2019-01-01")
Utilize single set of parameters
strats = {
    "smac": {"fastperiod": 35, "slowperiod": 50},
    "rsi": {"rsilower": 30, "rsiupper": 70}
}
res = backtest("multi", df, strats=strats)
res.shape
(1, 16)
Utilize auto grid search
strats_opt = {
    "smac": {"fastperiod": 35, "slowperiod": [40, 50]},
    "rsi": {"rsilower": [15, 30], "rsiupper": 70}
}
resopt = backtest("multi", df, strats=stratsopt) res_opt.shape (4, 16)
Custom Strategy for Backtesting Machine Learning & Statistics Based Predictions
This powerful strategy allows you to backtest your own trading strategies using any type of model w/ as few as 3 lines of code after the forecast!
Predictions based on any model can be used as a custom indicator to be backtested using fastquant. You just need to add a custom column in the input dataframe, and set values for upperlimit and lowerlimit.
The strategy is structured similar to RSIStrategy where you can set an upperlimit, above which the asset is sold (considered "overbought"), and a lowerlimit, below which the asset is bought (considered "underbought). upperlimit is set to 95 by default, while lowerlimit is set to 5 by default.
In the example below, we show how to use the custom strategy to backtest a custom indicator based on out-of-sample time series forecasts. The forecasts were generated using Facebook's Prophet package on Bitcoin prices.
from fastquant import getcryptodata, backtest
from fbprophet import Prophet
import pandas as pd
from matplotlib import pyplot as plt
Pull crypto data
df = getcryptodata("BTC/USDT", "2019-01-01", "2020-05-31")
Fit model on closing prices
ts = df.reset_index()[["dt", "close"]]
ts.columns = ['ds', 'y']
m = Prophet(dailyseasonality=True, yearlyseasonality=True).fit(ts)
forecast = m.makefuturedataframe(periods=0, freq='D')
Predict and plot
pred = m.predict(forecast)
fig1 = m.plot(pred)
plt.title('BTC/USDT: Forecasted Daily Closing Price', fontsize=25)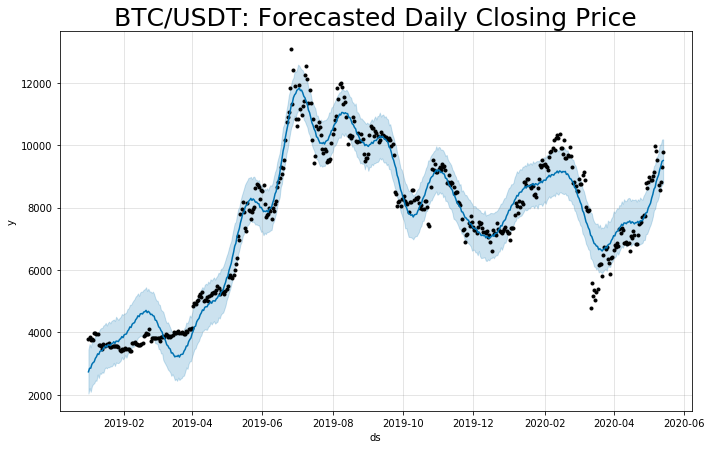
# Convert predictions to expected 1 day returns
expected1dayreturn = pred.setindex("ds").yhat.pctchange().shift(-1).multiply(100)
Backtest the predictions, given that we buy bitcoin when the predicted next day return is > +1.5%, and sell when it's < -1.5%.
df["custom"] = expected1dayreturn.multiply(-1)
backtest("custom", df.dropna(),upperlimit=1.5, lowerlimit=-1.5)
See more examples here.
fastquant API
View full list of fastquan API hereBe part of the growing fastquant community
Want to discuss more about fastquant with other users, and our team of developers?
You can reach us on the Hawksight discord. Feel free to ask about fastquant in the #feedback-suggestions and #bug-report channels.
Run fastquant in a Docker Container
# Build the image
docker build -t myimage .
Run the container
docker run -t -d -p 5000:5000 myimage
Get the container id
docker ps
SSH into the fastquant container
docker exec -it <CONTAINER_ID> /bin/bash
Run python and use fastquant
python
>>> from fastquant import getstockdata >>> df = getstockdata("TSLA", "2019-01-01", "2020-01-01") >>> df.head()


