
A python package to extract historical market data of cryptocurrencies and to calculate technical price indicators.


Development Environment
Poetry
* Install Poetrycurl -sSL https://install.python-poetry.org | python3 -poetry installpoetry add
poetry add dependency_namePoetry documentation for more.
Installation
pip
pip install PriceIndicsPoetry
poetry add PriceIndicesFrom Source (Github)
git clone https://github.com/dc-aichara/Price-Indices.git cd Price-Indices python3 setup.py installUsages
from PriceIndices import MarketHistory, IndicesExamples
- #### Get market history and closing price
>>> history = MarketHistory()
Get Market History
>>> dfhistory = history.gethistory("bitcoin", "2020-03-16", "2021-03-15")   >>> df_history.head()          open          high           low         close        volume    market_cap        date 0  59267.429049  60540.992712  55393.165363  55907.200226  6.641937e+10  1.042946e+12  2021-03-15 1  61221.134297  61597.918396  59302.316977  59302.316977  4.390123e+10  1.106226e+12  2021-03-14 2  57343.370247  61683.864014  56217.972382  61243.084766  6.066983e+10  1.142369e+12  2021-03-13 3  57821.218747  57996.619490  55376.650088  57332.088964  5.568994e+10  1.069366e+12  2021-03-12 4  55963.180089  58091.062703  54484.593089  57805.123019  5.677234e+10  1.078136e+12  2021-03-11
Get closing price
>>> pricedata  =  history.getprice("bitcoin", "2020-03-16", "2021-03-15")
>>> price_data.head()          date         price 0  2021-03-15  55907.200226 1  2021-03-14  59302.316977 2  2021-03-13  61243.084766 3  2021-03-12  57332.088964 4  2021-03-11  57805.123019
- #### Calculate Volatility Index
indices = Indices(df=pricedata, plotdir="plots")
>>> dfbvol = indices.getvola_index(
        plot=True,
        plotname="volaindex.png",
        show_plot=False
)
>>> df_bvol.head()
        date    price  BVOL_Index
0 2019-10-29  9427.69    0.711107
1 2019-10-28  9256.15    0.707269
2 2019-10-27  9551.71    0.709765
3 2019-10-26  9244.97    0.698544
4 2019-10-25 8660.70 0.692656- #### Plot Volatility Index
vola_index.png.

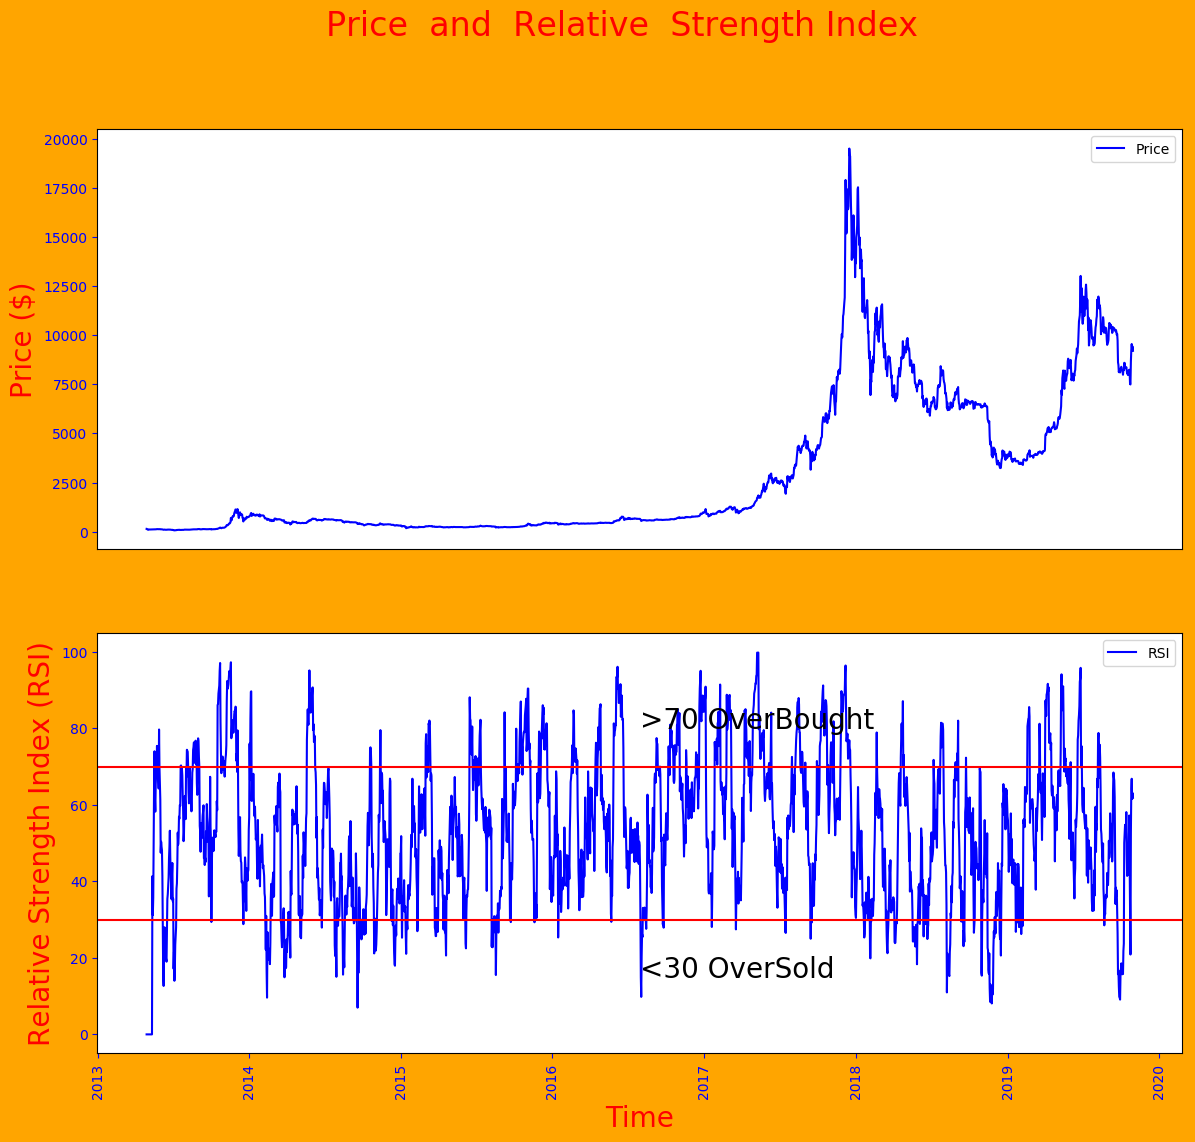
- #### Calculate Relative Strength Index (RSI)
>>> dfrsi = indices.getrsi(
        plot=True,
        plot_name="rsi.png",
        show_plot=False,
)
>>> print(df_rsi.head())         date    price       RSI1  RSSmooth      RSI_2 0 2019-10-30  9205.73      64.641855   1.624958  61.904151 1 2019-10-29  9427.69      65.707097   1.709072  63.086984 2 2019-10-28  9256.15      61.333433   1.597755  61.505224 3 2019-10-27  9551.71      66.873327   2.012345  66.803267 4 2019-10-26  9244.97      63.535368   1.791208  64.173219
- #### Plot RSI
rsi.png.
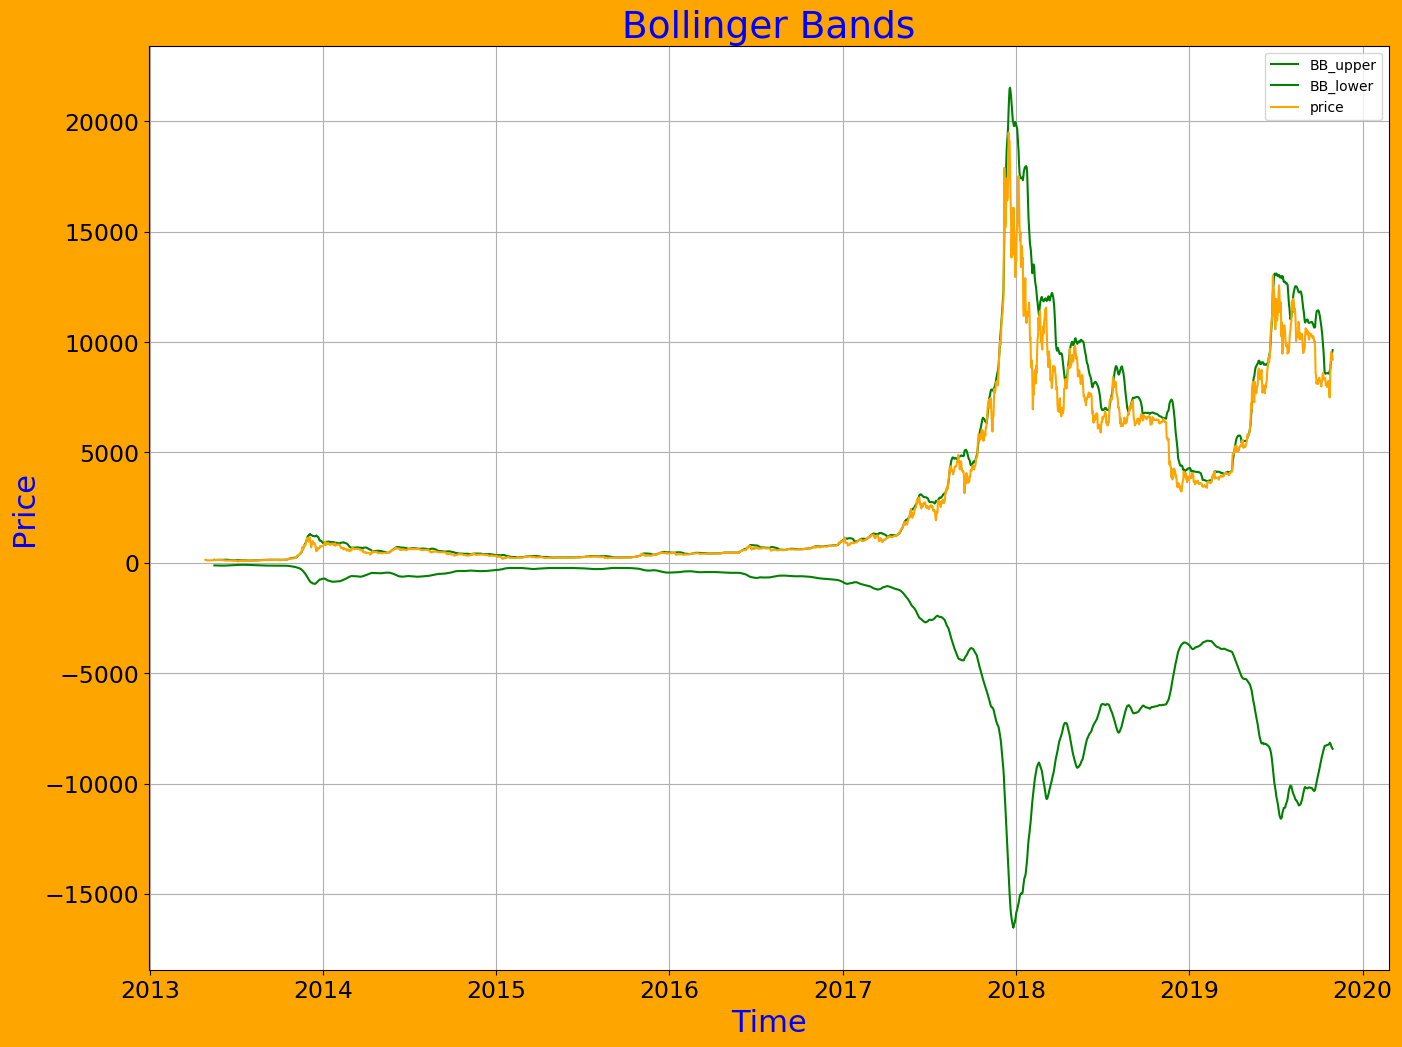
- #### Get Bollinger Bands and its plot
>>> dfbb = indices.getbollinger_bands(
        days=20,
        plot=True,
        plotname="bollingerbands.png",
        show_plot=False,
        )
>>> df_bb.head()
        date    price     BBupper   BBlower
0 2019-10-30  9205.73  9635.043581 -8428.5855
1 2019-10-29  9427.69  9550.707153 -8397.6225
2 2019-10-28  9256.15  9408.263164 -8356.0250
3 2019-10-27  9551.71  9268.466516 -8304.6565
4 2019-10-26  9244.97  9003.752779 -8239.3520
""" This will also save Bollingers bands plot in your working directory as 'bollinger_bands.png' in plots folder. """
- #### Get Moving Average Convergence Divergence (MACD) and its plot
>>> dfmacd = indices.getmovingaverageconvergence_divergence(
        plot=True,
        plot_name="macd.png",
        show_plot=False,
)
"""
This will return a pandas DataFrame and save EMA plot as 'macd.png' in in plots folder.
""""
>>> df_macd.head()
        date    price       MACD
0 2019-10-30  9205.73   0.000000
1 2019-10-29  9427.69  17.706211
2 2019-10-28  9256.15  17.692715
3 2019-10-27  9551.71  41.057952
4 2019-10-26  9244.97  34.426864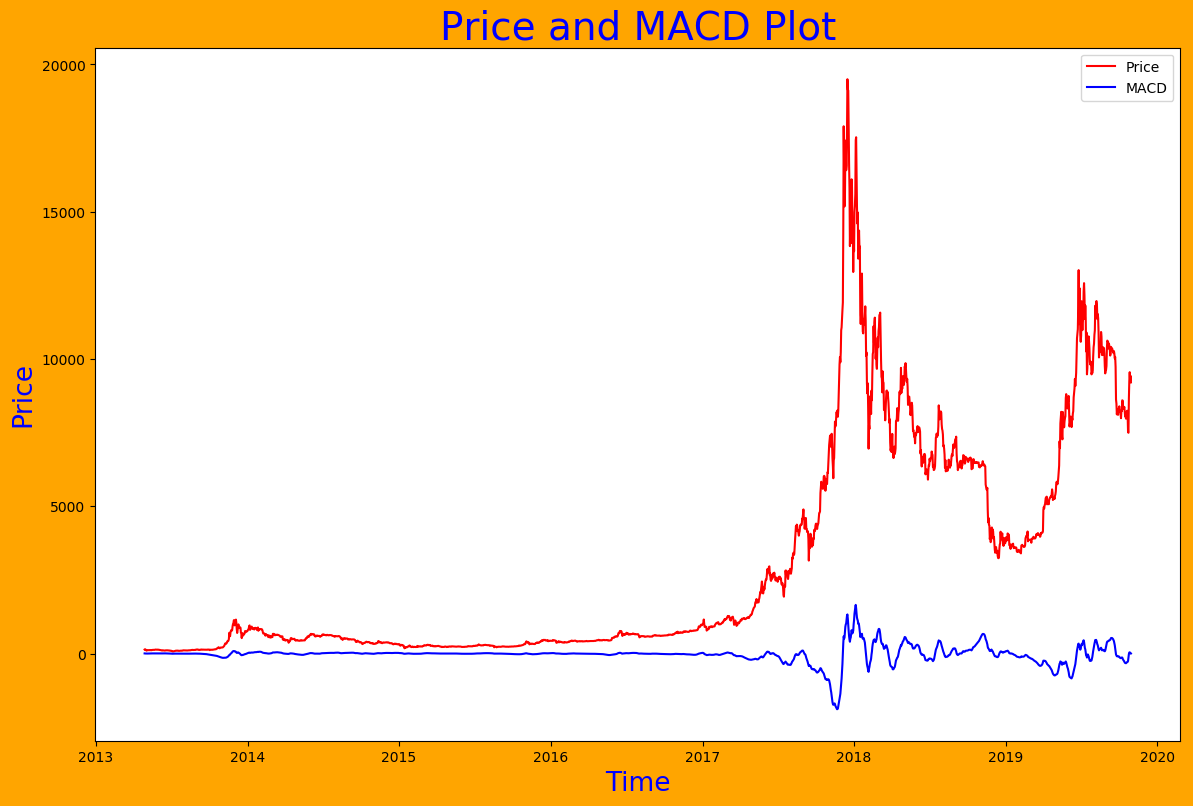
- #### Get Simple Moving Average (SMA) and its plot
>>> dfsma = indices.getsimplemovingaverage(
        days=20,
        plot=True,
        plot_name="sma.png",
        show_plot=False,
)
"""This will return a pandas DataFrame and save EMA plot as 'sma.png' in plots folder.
""""
>>> df_sma.head()
        date    price          SMA
0 2019-10-30  9205.73  8467.488000
1 2019-10-29  9427.69  8400.797333
2 2019-10-28  9256.15  8330.597333
3 2019-10-27  9551.71  8268.254667
4 2019-10-26  9244.97  8187.244667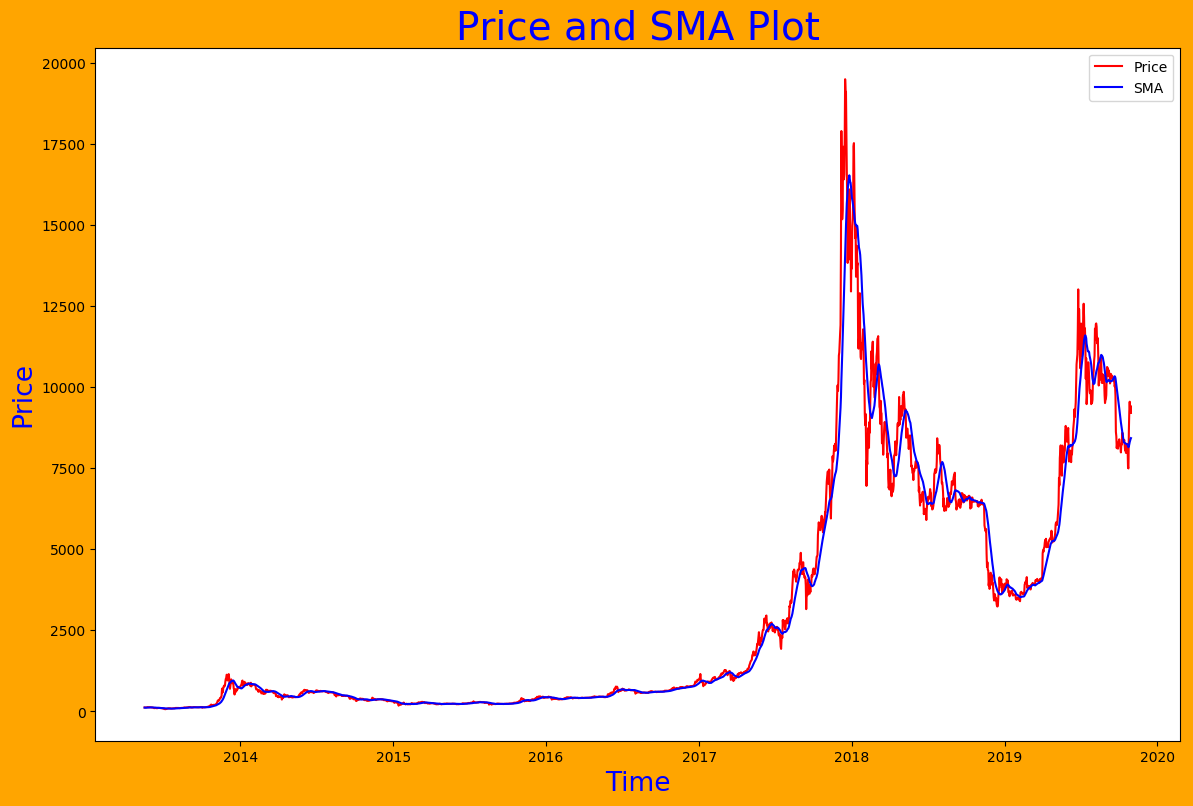
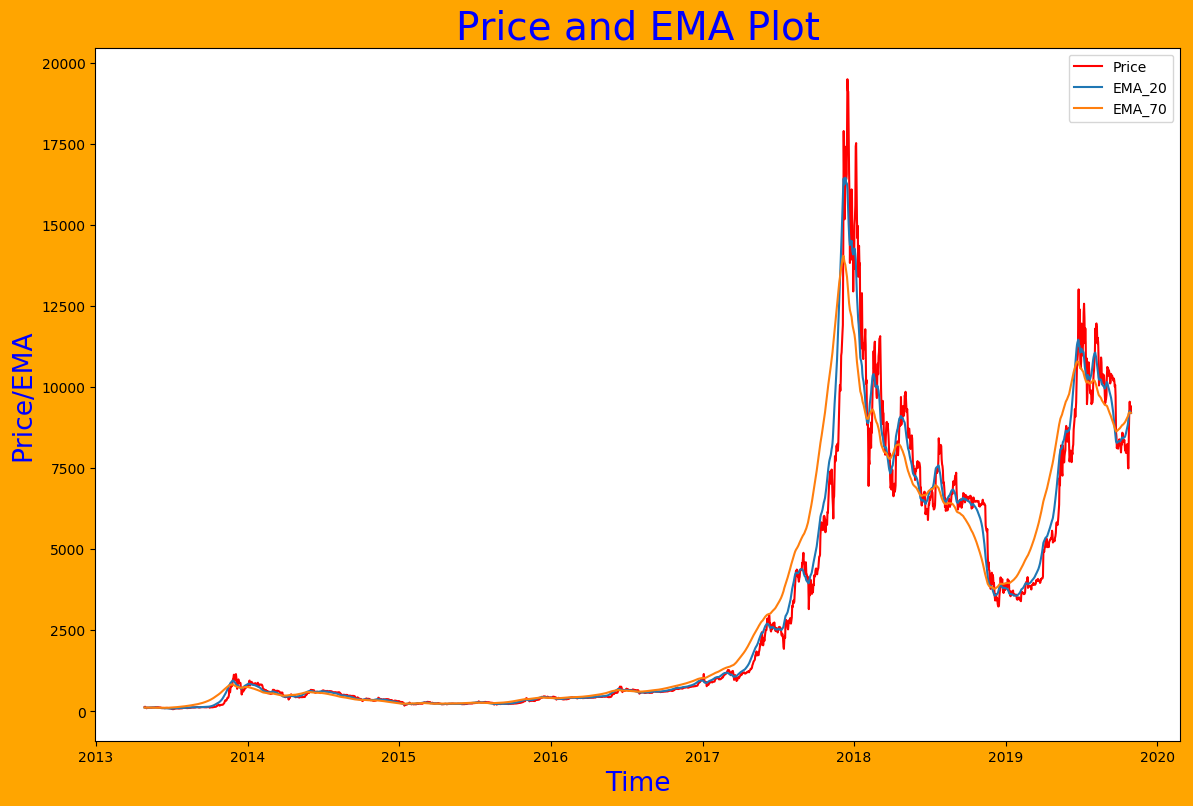
- ### Get Exponential Moving Average (EMA) and its plot
>>> dfema = indices.getexponentialmovingaverage(
        periods=(20,70),
        plot=True,
        plot_name="ema.png",
        show_plot=False,
)
"""This will return a pandas DataFrame and save EMA plot as 'ema.png' in plots folder.
""""
>>> df_ema.head()         date    price       EMA20       EMA70 0 2019-10-30  9205.73  9205.730000  9205.730000 1 2019-10-29  9427.69  9226.869048  9211.982394 2 2019-10-28  9256.15  9229.657710  9213.226552 3 2019-10-27  9551.71  9260.329356  9222.761297 4 2019-10-26  9244.97  9258.866561  9223.386895 >>>
License
MIT © Dayal Chand AicharaCheck out webpage of PriceIndices package.
I have created a cryptocurrency technical indicators dashboard which uses this library.
Disclaimer:
All content provided here, is for educational purpose and your general information only, procured  from third party sources.
I make no warranties of any kind in relation to this content, including but  not limited to accuracy
and updatedness. No part of the content that I provide  constitutes  financial  advice, legal advice
or any other form of advice meant for your specific reliance for any purpose. Any use or reliance on
my content is solely at your own risk  and  discretion. You should conduct your own research, review,
analyse and  verify my content  before relying  on them. Trading is a highly risky activity that can
lead to  major  losses, please  therefore  consult your financial advisor before making any decision.
No content on this Site is meant to be a solicitation or offer.


