
Visualize a pandas dataframe in a few clicks


Quickviz ========
Quickviz provides widgets for quickly visualizing pandas dataframes. It interfaces with seaborn and pandas.plot.
Example
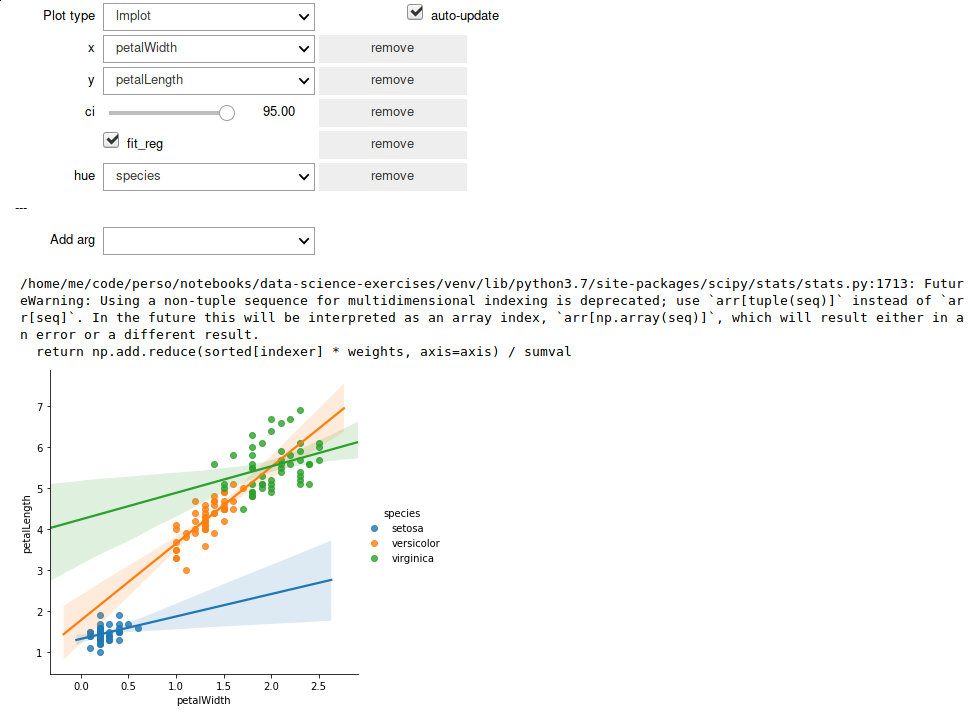
See the gallery (which is also a test suite) for more.
Usage
There only one function, visualize. Apply it to your dataframe, and start playing.
from quickviz import visualize as v from vega_datasets import data
df = data.cars() v(df)
Rationale
It is often necessary to plot data in order to understand it. Plotting allows to quiclky spot glitches in the data: that person who is 180 meters tall or this car which can speed thousands of kilometers per hour will immediately stand out. In this situation, one wants a way to quickly (rather than beautifully) plot their data. Quickviz provides a set of widgets to do this in a few clicks.
Installation
pip install ipywidgets jupyter nbextension enable --py widgetsnbextension pip install quickviz
Disclaimer
Quickviz does not read the documentation for you! It only makes it easier to use seaborn/pandas with a mouse. In order to understand what you are doing, you still need to dig in their respective APIs.


