
mini-panda: Java version of pandas for data engineers. DataFrame/Series, group/merge/pivot, CSV/JSON/Excel/SQL, 18 ECharts, .show() to visualize. Java 17, immutable, lightweight.
mini-panda
mini-panda is a Java library that replicates the core pandas (Python) API for tabular data manipulation. It provides immutable, copy-on-write data structures with a familiar pandas-like interface.
Requirements
- Java 17+
- Maven 3.6+
Installation
It has not been published to Maven Central yet.
<dependency>
    <groupId>io.github.chengyc17</groupId>
    <artifactId>mini-panda</artifactId>
    <version>1.0.0</version>
</dependency>
Quick Start
import io.github.mini.panda.PD;
import io.github.mini.panda.DataFrame;
// Create a DataFrame from a Map var data = Map.of(         "name", List.of("Alice", "Bob", "Charlie"),         "age", List.of(25, 30, 35),         "score", List.of(88.5, 92.0, 76.5) );         DataFrame df = PD.DataFrame(data);
// Quick inspection System.out.
println(df.head(2));         System.out.
println(df.describe());
// Select columns         DataFrame subset = df.select("name", "score");
// Filter rows         DataFrame filtered = df.filter(row -> (int) row.get("age") > 28);
// Sort         DataFrame sorted = df.sort_values("score", false);
Table of Contents
- Data Structures
- Data I/O
- Indexing & Selection
- Filtering & Masking
- Aggregation & Statistics
- GroupBy Operations
- Merge / Join / Concat
- Reshaping
- Data Cleaning
- Transform & Apply
- String Operations
- Sorting
- Plotting / Visualization
- Exceptions
1. Data Structures
1.1 Series
A one-dimensional labeled array with an Index, a typed value list, and an optional name.
// Create Series
Series<Integer> s1 = PD.Series(10, 20, 30);
Series<String> s2 = PD.Series(List.of("a", "b", "c"));
// Create with custom index Index idx = PD.Index(List.of("x", "y", "z")); Series<Double> s3 = PD.Series(List.of(1.1, 2.2, 3.3), idx, "values");
// Inspect System.out.println(s3.name());   // "values" System.out.println(s3.index());  // Index{labels=[x, y, z]} System.out.println(s3.size());   // 3 System.out.println(s3.dtype());  // DOUBLE
// head / tail System.out.println(s3.head(2));  // first 2 elements System.out.println(s3.tail(2));  // last 2 elements
1.2 DataFrame
A two-dimensional labeled table backed by a LinkedHashMap<String, Series<?>> that preserves column insertion order.
// Create DataFrame
var data = Map.of(
    "product", List.of("A", "B", "C", "D"),
    "price", List.of(10.5, 20.0, 15.0, 30.0),
    "quantity", List.of(100, 50, 80, 30)
);
DataFrame df = PD.DataFrame(data);
// With custom row index Index rowIdx = PD.Index(List.of("p1", "p2", "p3", "p4")); DataFrame df2 = PD.DataFrame(data, rowIdx);
// With explicit dtypes Map<String, DType> dtypes = Map.of(     "price", DType.DOUBLE,     "quantity", DType.INT ); DataFrame df3 = PD.DataFrame(data, dtypes);
// Structure info System.out.println(df.nrow());          // 4 System.out.println(df.ncol());          // 3 System.out.println(df.columnNames());   // [product, price, quantity] System.out.println(df.dtypes());        // {product=STRING, price=DOUBLE, quantity=INT}
// Access columns Series<?> col = df.col("price"); Series<?> col2 = df.get("price");  // alias DataFrame subset = df.select("product", "price");
// Row slicing System.out.println(df.head(3)); System.out.println(df.tail(2)); System.out.println(df.sample(2));
// Iteration df.rows().forEach(row -> System.out.println(row)); df.columnsStream().forEach(col -> System.out.println(col.name()));
1.3 Index
An immutable ordered label-to-position mapping with O(1) lookup.
// Create Index
Index idx1 = PD.Index(List.of("a", "b", "c"));
Index idx2 = Index.of("x", "y", "z");
Index idx3 = Index.range(5);        // 0, 1, 2, 3, 4
Index idx4 = Index.range(10, 15);   // 10, 11, 12, 13, 14
// Operations int pos = idx1.getLoc("a");          // 0 List<Integer> positions = idx1.getLocs("a", "c");  // [0, 2] String label = idx1.getLabel(1);     // "b" boolean exists = idx1.contains("b"); // true
Index sliced = idx1.slice(0, 2);     // labels [a, b] Index renamed = idx1.rename("new_name");
2. Data I/O
2.1 CSV
// Read CSV
DataFrame df = PD.read_csv("data/sample.csv");
// With options CsvOptions opts = CsvOptions.builder()     .header(true)     .delimiter(';')     .skipRows(2)     .nrows(100)     .dtypes(Map.of("age", DType.INT))     .build(); DataFrame df2 = PD.read_csv("data/semicolon.csv", opts);
// From InputStream InputStream is = new FileInputStream("data/sample.csv"); DataFrame df3 = PD.read_csv(is);
// Write CSV df.to_csv("output.csv"); df.to_csv("output.tsv", CsvOptions.builder().delimiter('\t').build());
2.2 JSON
// Read JSON (records format by default)
DataFrame df = PD.read_json("data/sample.json");
// With options JsonOptions opts = JsonOptions.builder()     .orient("columns")     .build(); DataFrame df2 = PD.read_json("data/columns.json", opts);
// JSON Lines DataFrame df3 = PD.read_json("data/data.jsonl",     JsonOptions.builder().lines(true).build());
// Write JSON df.to_json("output.json"); df.tojson("outputcolumns.json", JsonOptions.builder().orient("columns").build());
2.3 Excel
// Read Excel
DataFrame df = PD.read_excel("data/sample.xlsx");
// With options ExcelOptions opts = ExcelOptions.builder()     .sheetName("Sheet2")     .header(true)     .skipRows(1)     .dtypes(Map.of("amount", DType.DOUBLE))     .build(); DataFrame df2 = PD.readexcel("data/mixedtypes.xlsx", opts);
// Write Excel df.to_excel("output.xlsx"); df.to_excel("output.xlsx", ExcelOptions.builder().sheetName("Results").build());
2.4 SQL
// Read entire table
DataFrame df = PD.readsqltable(connection, "users");
// Read via query DataFrame df2 = PD.readsqlquery(connection, "SELECT * FROM users WHERE age > 18");
// Write to database df.tosql(connection, "newtable", SqlOptions.builder()     .ifExists(IfExists.REPLACE)     .build());
3. Indexing & Selection
3.1 LocIndexer (Label-based)
Endpoints are inclusive (unlike Python pandas).
DataFrame df = PD.DataFrame(Map.of(
    "name", List.of("Alice", "Bob", "Charlie", "Diana"),
    "age", List.of(25, 30, 35, 28),
    "city", List.of("NYC", "LA", "SF", "NYC")
), Index.of("a", "b", "c", "d"));
// Single row by label DataFrame row = df.loc().get("b");
// Single cell Object cell = df.loc().get("c", "name");  // "Charlie"
// Multiple rows DataFrame rows = df.loc().get(List.of("a", "c"));
// Row slice (inclusive) DataFrame slice = df.loc().get("a", "c");  // rows a, b, c
// Row+Column slice (inclusive) DataFrame sub = df.loc().get("a", "c", "name", "age");
// Boolean mask Series<Boolean> mask = PD.Series(true, false, true, false); DataFrame masked = df.loc().get(mask);
// All rows, selected columns DataFrame allCols = df.loc().all(List.of("name", "city"));
// Set values (returns new DataFrame) DataFrame updated = df.loc().set("b", "age", 31); DataFrame updated2 = df.loc().set("b", Map.of("age", 31, "city", "Boston"));
3.2 ILocIndexer (Position-based)
Endpoints are exclusive for slices.
// Single row by position
DataFrame row = df.iloc().get(1);
// Single cell Object cell = df.iloc().getCell(2, 0);  // row 2, col 0
// Multiple rows DataFrame rows = df.iloc().get(0, 2, 3);
// Row slice [start, end) - exclusive DataFrame slice = df.iloc().get(1, 3);  // rows at positions 1, 2
// Row+Column slice DataFrame sub = df.iloc().get(0, 2, 0, 2);
// Set values DataFrame updated = df.iloc().set(1, 1, 31); DataFrame updated2 = df.iloc().set(0, "age", 26);
3.3 Series Indexing
Series<Integer> s = PD.Series(10, 20, 30, 40, 50);
// Position-based int val = s.iloc(0);          // 10 Series<Integer> vals = s.iloc(0, 2, 4);  // [10, 30, 50]
// With named index Index idx = Index.of("a", "b", "c", "d", "e"); Series<Integer> sn = Series.of(List.of(10, 20, 30, 40, 50), idx, "nums"); int v = sn.loc("b");          // 20 Series<Integer> mv = sn.loc("a", "c", "e");  // [10, 30, 50]
4. Filtering & Masking
4.1 DataFrame Filtering
DataFrame df = PD.DataFrame(Map.of(
    "name", List.of("Alice", "Bob", "Charlie", "Diana"),
    "age", List.of(25, 30, 35, 28),
    "score", List.of(88.5, 92.0, 76.5, 85.0)
));
// Filter by predicate DataFrame adults = df.filter(row -> (int) row.get("age") >= 30);
// Filter by boolean mask Series<Boolean> mask = PD.Series(true, false, true, false); DataFrame masked = df.mask(mask);
4.2 Series Filtering
Series<Integer> s = PD.Series(10, 20, 30, 40, 50);
// Filter by predicate Series<Integer> big = s.filter(v -> v > 25);  // [30, 40, 50]
// Filter by boolean mask Series<Boolean> mask = PD.Series(true, false, true, false, true); Series<Integer> masked = s.mask(mask);  // [10, 30, 50]
5. Aggregation & Statistics
5.1 Series Aggregation
Series<Double> s = PD.Series(1.0, 2.0, 3.0, 4.0, 5.0);
double sum = s.sum();           // 15.0 double mean = s.mean();         // 3.0 double min = s.min();           // 1.0 double max = s.max();           // 5.0 long count = s.count();         // 5 double std = s.std();           // sample std (ddof=1) double var = s.var();           // sample var (ddof=1)
double median = s.median();     // 3.0 double q25 = s.quantile(0.25);  // 1st quartile double q75 = s.quantile(0.75);  // 3rd quartile
// Descriptive statistics DescriptiveStats stats = s.describe(); System.out.println(stats.mean()); System.out.println(stats.std()); System.out.println(stats.percentile50());
// Value analysis Series<Integer> counts = s.value_counts(); List<Double> uniqueValues = s.unique(); long nunique = s.nunique();
5.2 DataFrame Aggregation
DataFrame df = PD.DataFrame(Map.of(
    "math", List.of(88, 92, 76, 85, 90),
    "english", List.of(80, 88, 72, 90, 85),
    "science", List.of(90, 85, 70, 88, 92)
));
// Column-wise aggregation (returns a descriptive DataFrame) DataFrame desc = df.describe(); // Rows: count, mean, std, min, 25%, 50%, 75%, max // Columns: math, english, science
// Individual aggregations DataFrame sums = df.sum();      // sum per column DataFrame means = df.mean();    // mean per column DataFrame mins = df.min();      // min per column DataFrame maxs = df.max();      // max per column DataFrame counts = df.count();  // count per column DataFrame stds = df.std();      // std per column DataFrame vars = df.var();      // var per column
// Axis-based aggregation DataFrame rowSums = df.sum(Axis.ROW);    // sum per row (axis=0) DataFrame rowMeans = df.mean(Axis.ROW);  // mean per row (axis=0)
6. GroupBy Operations
Split-apply-combine: partition a DataFrame by key columns, then aggregate, transform, or filter per group.
DataFrame df = PD.DataFrame(Map.of(
    "dept", List.of("Eng", "Eng", "HR", "HR", "Sales", "Sales"),
    "name", List.of("Alice", "Bob", "Charlie", "Diana", "Eve", "Frank"),
    "salary", List.of(80000, 90000, 60000, 65000, 70000, 75000)
));
GroupBy grouped = df.groupby("dept");
// Built-in aggregations DataFrame avgSalary = grouped.mean(); DataFrame totalSalary = grouped.sum(); DataFrame minSalary = grouped.min(); DataFrame maxSalary = grouped.max(); DataFrame headcount = grouped.count(); DataFrame stdSalary = grouped.std(); DataFrame varSalary = grouped.var(); DataFrame firstRow = grouped.first(); DataFrame lastRow = grouped.last(); DataFrame groupSize = grouped.size();
// Custom aggregation: specify function per column DataFrame custom = grouped.agg(Map.of(     "salary", "mean",     "name", "count" ));
// Multi-function aggregation: multiple functions on same column DataFrame multi = grouped.aggMulti(Map.of(     "salary", List.of("sum", "mean", "std") )); // Produces columns: salarysum, salarymean, salary_std
// Transform: apply function per group, preserve shape Series<Double> normalized = grouped.transform(col -> {     double m = col.mean();     return col.sub(m); });
// Filter: keep groups that satisfy predicate GroupBy filtered = grouped.filter(g -> g.col("salary").mean() > 65000);
// Apply: arbitrary per-group logic DataFrame result = grouped.apply(g -> g.head(1));
// Per-group head/tail DataFrame topN = grouped.head(2); DataFrame bottomN = grouped.tail(1);
// Access raw groups Map<GroupingKey, DataFrame> groups = grouped.getGroups();
7. Merge / Join / Concat
7.1 Merge (Join)
Supports INNER, LEFT, RIGHT, and OUTER joins.
DataFrame left = PD.DataFrame(Map.of(
    "id", List.of(1, 2, 3, 4),
    "name", List.of("Alice", "Bob", "Charlie", "Diana")
));
DataFrame right = PD.DataFrame(Map.of(
    "id", List.of(1, 2, 3, 5),
    "score", List.of(88.5, 92.0, 76.5, 80.0)
));
// Direct merge with shortcut DataFrame inner = PD.merge(left, right, "id", JoinType.INNER); DataFrame outer = PD.merge(left, right, "id", JoinType.OUTER);
// Builder API for full control DataFrame result = PD.merge(left, right)     .on("id")     .how(JoinType.LEFT)     .suffixes("left", "right")     .indicator()  // adds merge column: leftonly, right_only, both     .execute();
// Different key column names DataFrame result2 = PD.merge(     PD.DataFrame(Map.of("user_id", List.of(1, 2, 3), "name", List.of("A", "B", "C"))),     PD.DataFrame(Map.of("user_ref", List.of(1, 2, 4), "score", List.of(90.0, 85.0, 70.0))) )     .leftOn("user_id")     .rightOn("user_ref")     .how(JoinType.INNER)     .execute();
// DataFrame.join() shortcut DataFrame joined = left.join(right);                    // default INNER DataFrame joined2 = left.join(right, "id");             // on column DataFrame joined3 = left.join(right, "id", JoinType.OUTER);
7.2 Concat
Row-wise and column-wise concatenation.
DataFrame df1 = PD.DataFrame(Map.of(
    "A", List.of(1, 2), "B", List.of(3, 4)
));
DataFrame df2 = PD.DataFrame(Map.of(
    "A", List.of(5, 6), "B", List.of(7, 8)
));
DataFrame df3 = PD.DataFrame(Map.of(
    "A", List.of(9, 10), "C", List.of(11, 12)  // column B missing
));
// Row-wise (axis=0, default) DataFrame vertical = PD.concat(List.of(df1, df2));
// Row-wise with column alignment DataFrame outerConcat = PD.concat(List.of(df1, df3));  // outer join (default), fills NaN for missing columns DataFrame innerConcat = PD.concat(List.of(df1, df3));  // via ConcatBuilder with join("inner")
// Reset index after concat DataFrame reset = PD.concat(List.of(df1, df2)).resetIndex();
// Column-wise (axis=1) DataFrame horizontal = PD.concat(List.of(df1, df2), Axis.COL);
8. Reshaping
8.1 Pivot Table
DataFrame df = PD.DataFrame(Map.of(
    "date", List.of("2024-01", "2024-01", "2024-02", "2024-02"),
    "product", List.of("A", "B", "A", "B"),
    "sales", List.of(100, 150, 200, 180)
));
// Pivot: index=date, columns=product, values=sales, aggregation=sum DataFrame pivoted = df.pivot_table("date", "product", "sales", "sum"); //         A    B // 2024-01 100  150 // 2024-02 200  180
8.2 Melt
Unpivot a DataFrame from wide to long format.
DataFrame wide = PD.DataFrame(Map.of(
    "name", List.of("Alice", "Bob"),
    "math", List.of(88, 92),
    "english", List.of(80, 88)
));
// Melt "math" and "english" into variable/value columns DataFrame long = wide.melt("name", List.of("math", "english"), "subject", "score"); //   name  subject  score // Alice    math     88 // Alice    english  80 // Bob      math     92 // Bob      english  88
8.3 Column Operations
// Drop columns
DataFrame df2 = df.drop("col_a");
DataFrame df3 = df.drop(List.of("cola", "colb"));
// Rename columns DataFrame renamed = df.rename(Map.of("oldname", "newname"));
// Set a column as the row index DataFrame indexed = df.setIndex("id");          // drops "id" column by default DataFrame indexed2 = df.setIndex("id", false); // keeps "id" column
// Reset to default RangeIndex DataFrame reset = df.resetIndex();              // adds old index as a column DataFrame reset2 = df.resetIndex(true);         // drops old index
// Copy DataFrame copy = df.copy();
9. Data Cleaning
9.1 Missing Data Detection
// Check for null values
DataFrame nullMask = df.isna();   // boolean DataFrame, true where null
DataFrame notNull = df.notna();   // boolean DataFrame, true where not null
// Series Series<Boolean> naMask = s.isna(); Series<Boolean> notNaMask = s.notna();
9.2 Fill Missing Values
// Fill all nulls with a scalar
DataFrame filled = df.fillna(0);
// Fill per-column with different values DataFrame filled2 = df.fillna(Map.of(     "age", 0,     "name", "unknown",     "score", 0.0 ));
// Series fill Series<Integer> filled3 = s.fillna(0);
9.3 Drop Missing Values
// Drop rows with any NaN (default)
DataFrame clean = df.dropna();
// Drop columns with any NaN DataFrame cleanCols = df.dropna(Axis.COL);
// Drop rows where ALL values are NaN DataFrame cleanAll = df.dropna(Axis.ROW, "all");
// Drop rows considering only specific columns DataFrame cleanSub = df.dropna(Axis.ROW, "any", List.of("age", "score"));
// Series Series<Double> cleanSeries = s.dropna();
10. Transform & Apply
10.1 Series Apply / Map
Series<Integer> s = PD.Series(1, 2, 3, 4, 5);
// Apply function Series<Integer> doubled = s.apply(v -> v * 2); Series<String> strings = s.apply(v -> "val_" + v);
// map is an alias for apply Series<Integer> tripled = s.map(v -> v * 3);
// Type conversion Series<Double> doubles = s.astype(Double.class);
10.2 DataFrame Apply
DataFrame df = PD.DataFrame(Map.of(
    "a", List.of(1, 2, 3),
    "b", List.of(4, 5, 6)
));
// Column-wise apply (default): function receives a Series, returns a value or Series DataFrame result = df.apply(col -> col.sum());  // sum of each column
// Row-wise apply (axis=1): function receives a Series representing a row DataFrame rowResult = df.apply(row -> row.sum(), Axis.ROW);
// Element-wise apply (applymap) DataFrame doubled = df.applymap(val -> val instanceof Integer     ? (int) val * 2 : val);
11. String Operations
Available on string Series via .str() accessor.
Series<String> s = PD.Series("  hello  ", "WORLD", "  Foo Bar  ");
// Case conversion Series<String> lower = s.str().lower();   // "  hello  ", "world", "  foo bar  " Series<String> upper = s.str().upper();   // "  HELLO  ", "WORLD", "  FOO BAR  "
// Strip whitespace Series<String> stripped = s.str().strip(); // "hello", "WORLD", "Foo Bar"
// Substring operations Series<String> replaced = s.str().replace("hello", "hi"); Series<Integer> lengths = s.str().len();   // [9, 5, 11] Series<String> sliced = s.str().slice(2);   // from position 2 to end Series<String> sliced2 = s.str().slice(2, 5); // from position 2 to 5
// Pattern matching Series<Boolean> contains = s.str().contains("he"); Series<Boolean> startsWith = s.str().startsWith("  "); Series<Boolean> endsWith = s.str().endsWith("  ");
12. Sorting
12.1 DataFrame Sorting
DataFrame df = PD.DataFrame(Map.of(
    "name", List.of("Bob", "Alice", "Charlie"),
    "age", List.of(30, 25, 35),
    "score", List.of(92.0, 88.5, 76.5)
));
// Sort by a single column DataFrame sorted = df.sort_values("age");
// Sort descending DataFrame desc = df.sort_values("score", false);
// Sort by multiple columns DataFrame multi = df.sort_values(List.of("age", "score"));
// Sort by multiple columns with different directions DataFrame multiDir = df.sort_values(     List.of("age", "score"),     List.of(true, false)  // age ascending, score descending );
// Sort by row index DataFrame idxSorted = df.sort_index(); DataFrame idxDesc = df.sort_index(false);
12.2 Series Sorting
Series<Integer> s = PD.Series(30, 10, 20, 50, 40);
// Sort by values Series<Integer> sorted = s.sort_values();      // [10, 20, 30, 40, 50] Series<Integer> desc = s.sort_values(false);   // [50, 40, 30, 20, 10]
// Sort by index Index idx = Index.of("c", "a", "e", "b", "d"); Series<Integer> named = Series.of(List.of(30, 10, 20, 50, 40), idx, "vals"); Series<Integer> idxSorted = named.sort_index();    // index order: a, b, c, d, e Series<Integer> idxDesc = named.sort_index(false); // index order: e, d, c, b, a
13. Plotting / Visualization
mini-panda integrates with ECharts to generate interactive charts. Charts are served via an embedded HTTP server on localhost with a dynamic port (starting at 10086).
// Start the chart server
// It auto-starts when the first chart is shown
// DataFrame plotting DataFrame df = PD.DataFrame(Map.of(     "x", List.of(1, 2, 3, 4, 5),     "y1", List.of(10, 20, 15, 25, 30),     "y2", List.of(5, 15, 10, 20, 25) ));
// Series plotting Series<Double> s = PD.Series(1.0, 2.0, 3.0, 4.0, 5.0);
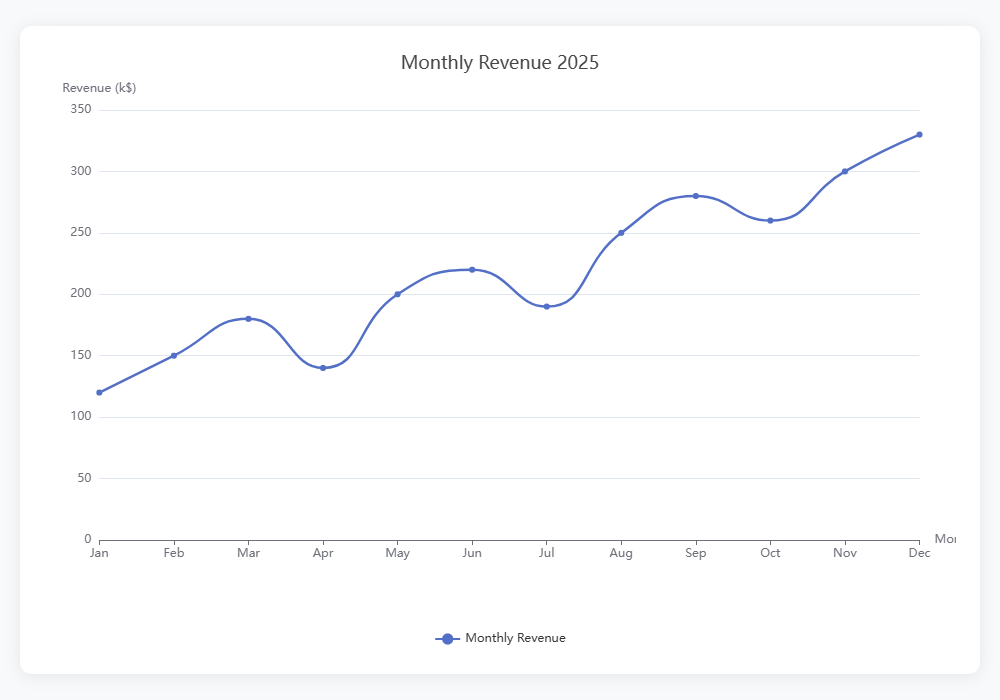
13.1 Line Chart
// Series line chart
s.plot().line().title("Line Chart").xlabel("Index").ylabel("Value").show();
// Multi-series line chart (DataFrame) df.plot().line().title("Multi-Line Chart").show();
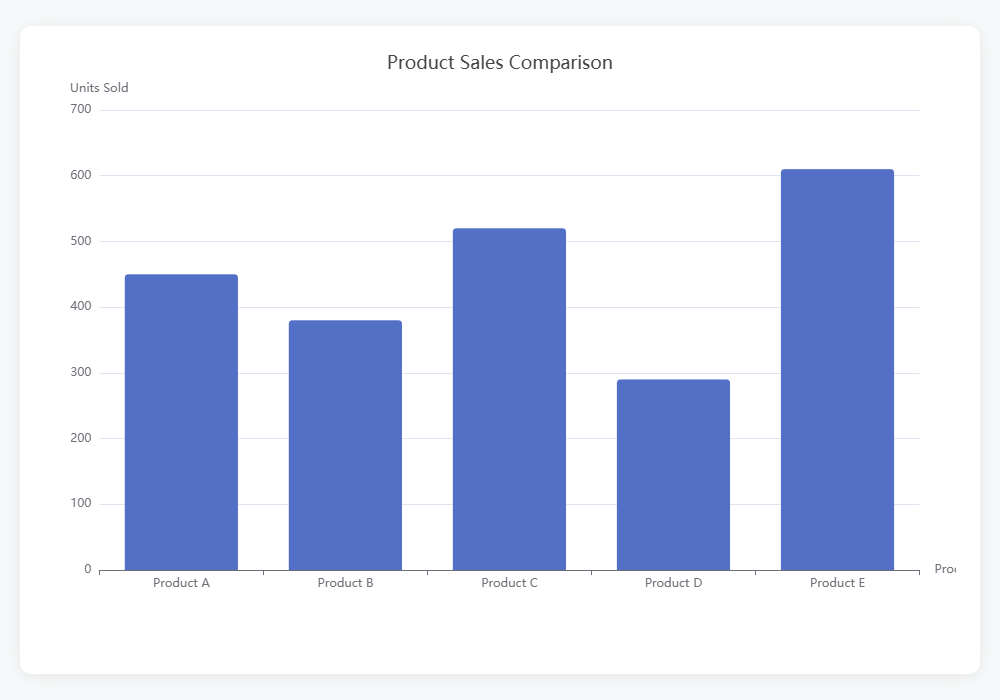
13.2 Bar Chart
// Series bar chart
s.plot().bar().title("Bar Chart").show();
// Grouped bar chart (DataFrame) df.plot().bar().title("Grouped Bar Chart").show();
13.3 Histogram
s.plot().hist().title("Histogram").show();
s.plot().hist(10).title("Histogram (10 bins)").show();  // with bin count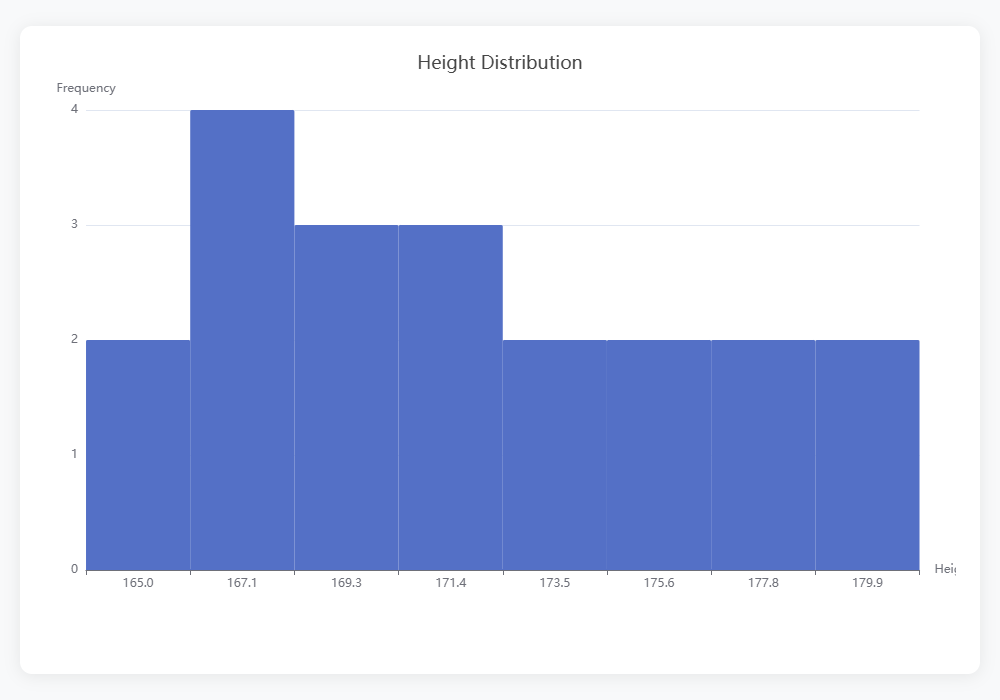
13.4 Scatter Chart
DataFrame scatter_df = PD.DataFrame(Map.of(
    "x", List.of(1, 2, 3, 4, 5),
    "y", List.of(2, 4, 1, 5, 3)
));
scatter_df.plot().scatter("x", "y").title("Scatter Plot").show();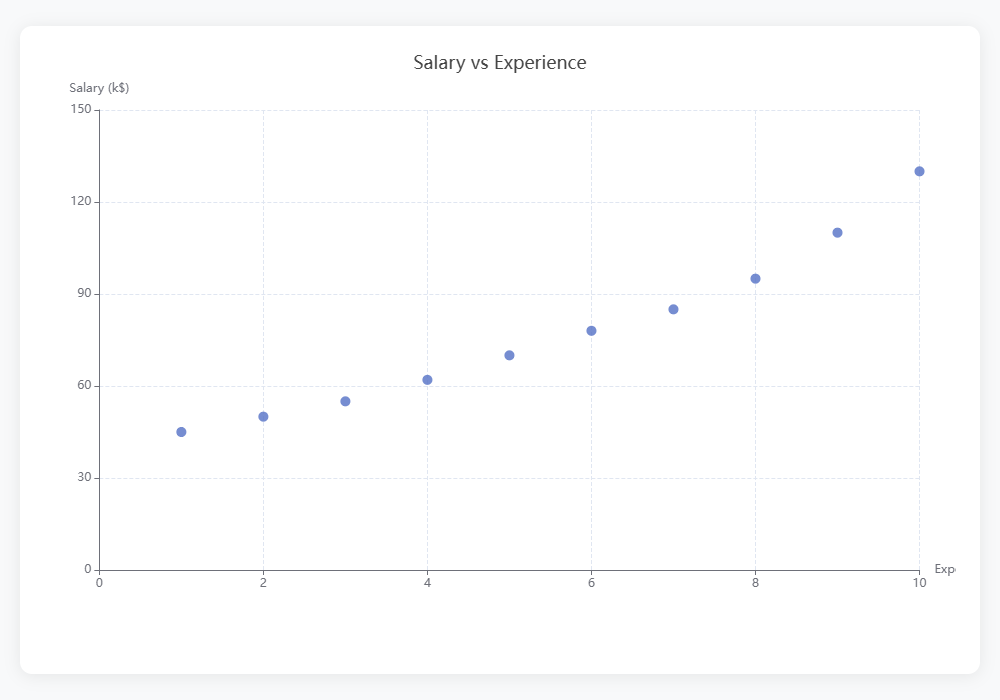
13.5 Pie Chart
Map<String, Number> pieData = Map.of("A", 30, "B", 50, "C", 20);
PD.Series(List.of(1, 2, 3)).plot().pie(pieData).title("Pie Chart").show();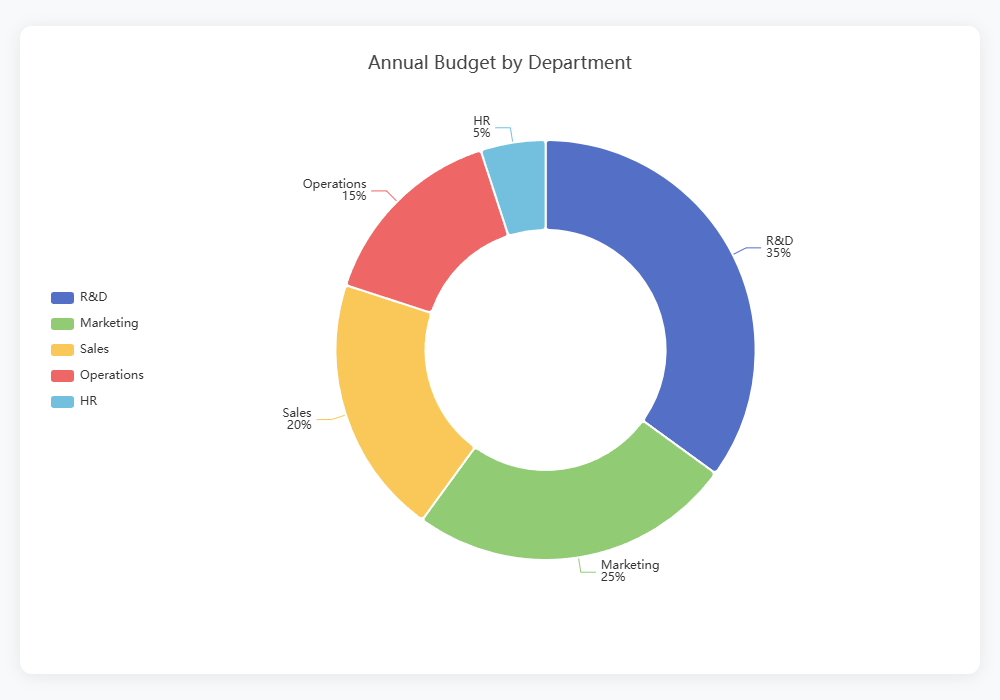
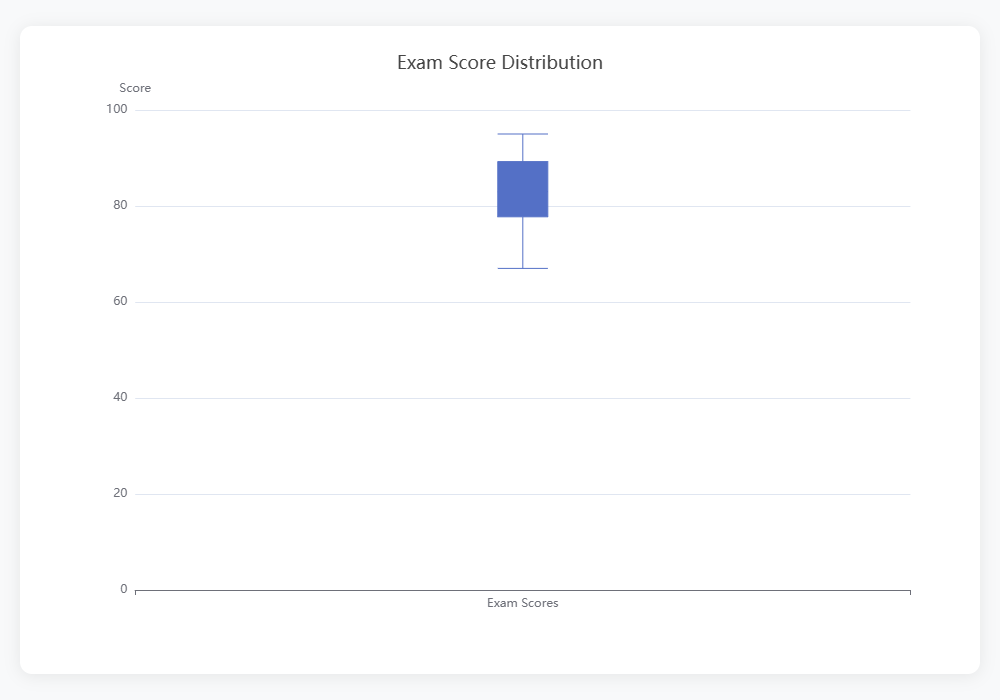
13.6 Box Chart
// Series box plot
s.plot().box().title("Box Plot").show();
// DataFrame box plot (multiple columns) df.plot().box().title("Multi-Box Plot").show();
13.7 Heatmap
DataFrame hm_df = PD.DataFrame(Map.of(
    "x", List.of(1, 1, 2, 2, 3, 3),
    "y", List.of("A", "B", "A", "B", "A", "B"),
    "value", List.of(10, 20, 15, 25, 30, 35)
));
hm_df.plot().heatmap("x", "y", "value").title("Heatmap").show();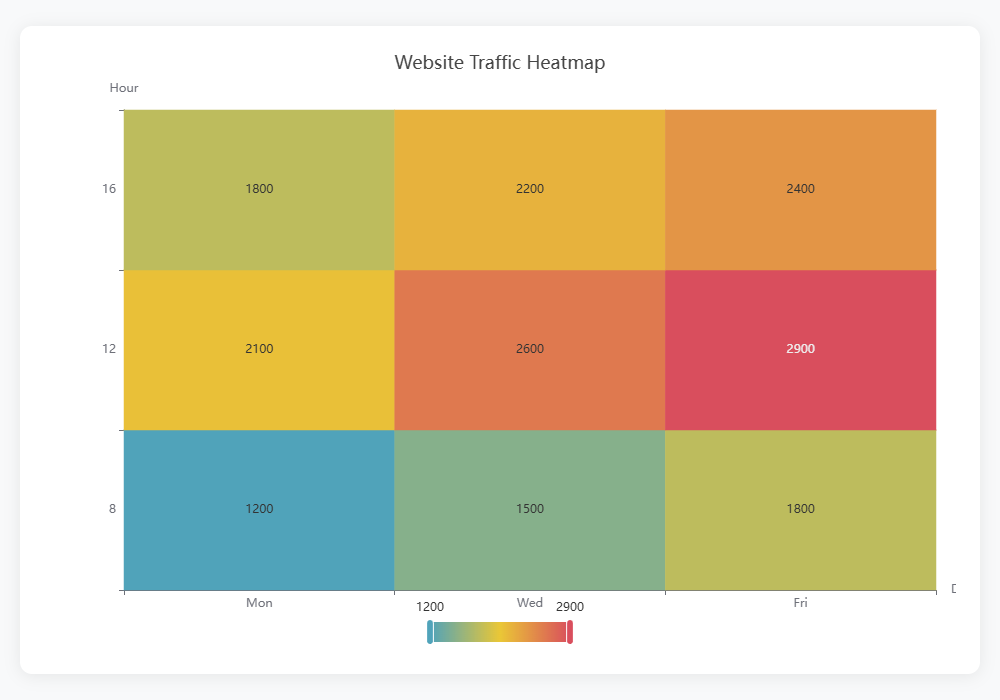
13.8 Radar Chart
DataFrame radar_df = PD.DataFrame(Map.of(
    "dim", List.of("Speed", "Power", "Defense", "Agility", "Stamina"),
    "player1", List.of(80, 90, 60, 85, 75),
    "player2", List.of(70, 85, 80, 70, 90)
));
radar_df.plot().radar().title("Radar Chart").show();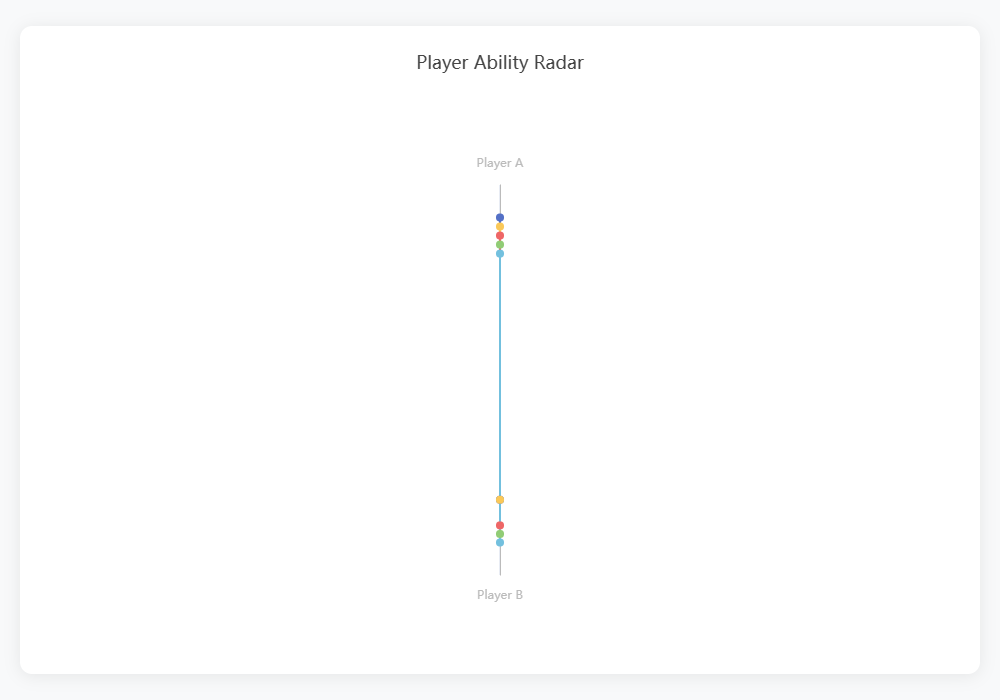
13.9 Funnel Chart
Map<String, Number> funnelData = Map.of(
    "Visits", 1000, "Leads", 500, "Opportunities", 200, "Deals", 50
);
s.plot().funnel(funnelData).title("Funnel Chart").show();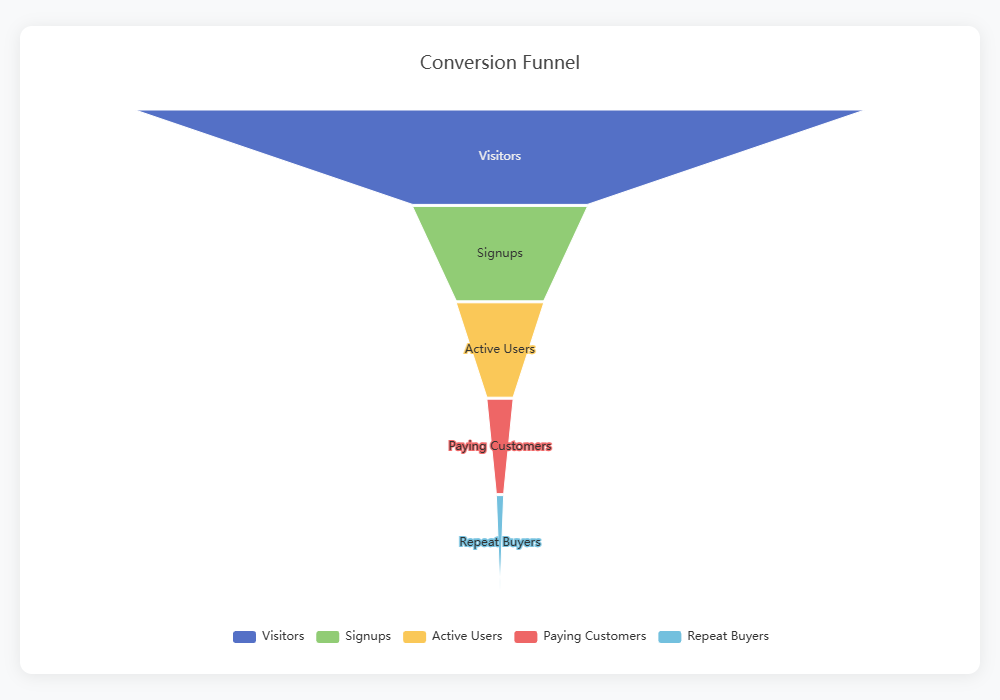
13.10 Gauge Chart
s.plot().gauge("CPU Usage", 75.5).show();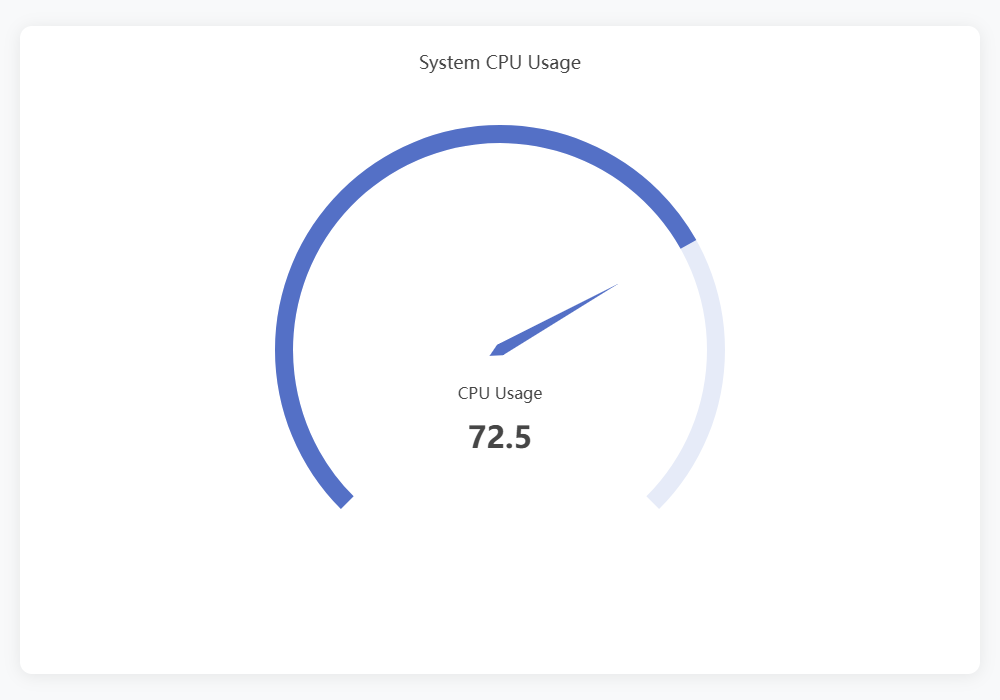
13.11 Treemap
DataFrame tm_df = PD.DataFrame(Map.of(
    "category", List.of("Tech", "Finance", "Health", "Energy"),
    "value", List.of(300, 200, 150, 100)
));
tm_df.plot().treemap("category", "value").title("Treemap").show();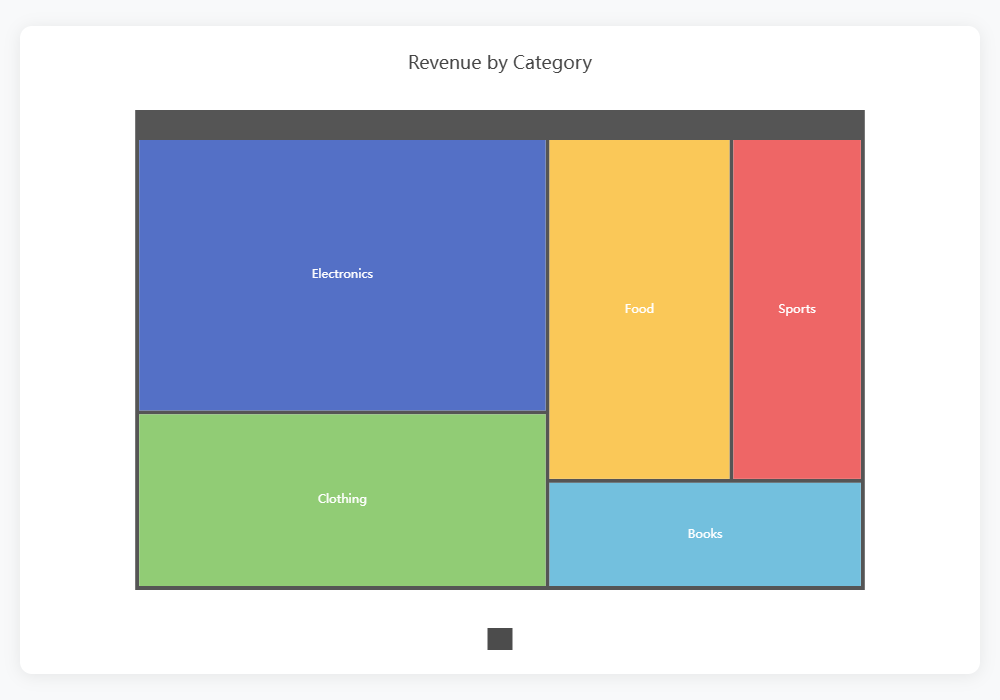
13.12 Sunburst Chart
DataFrame sb_df = PD.DataFrame(Map.of(
    "region", List.of("Asia", "Asia", "Europe", "Europe"),
    "country", List.of("China", "Japan", "UK", "Germany"),
    "value", List.of(100, 80, 60, 70)
));
sb_df.plot().sunburst(List.of("region", "country"), "value").title("Sunburst").show();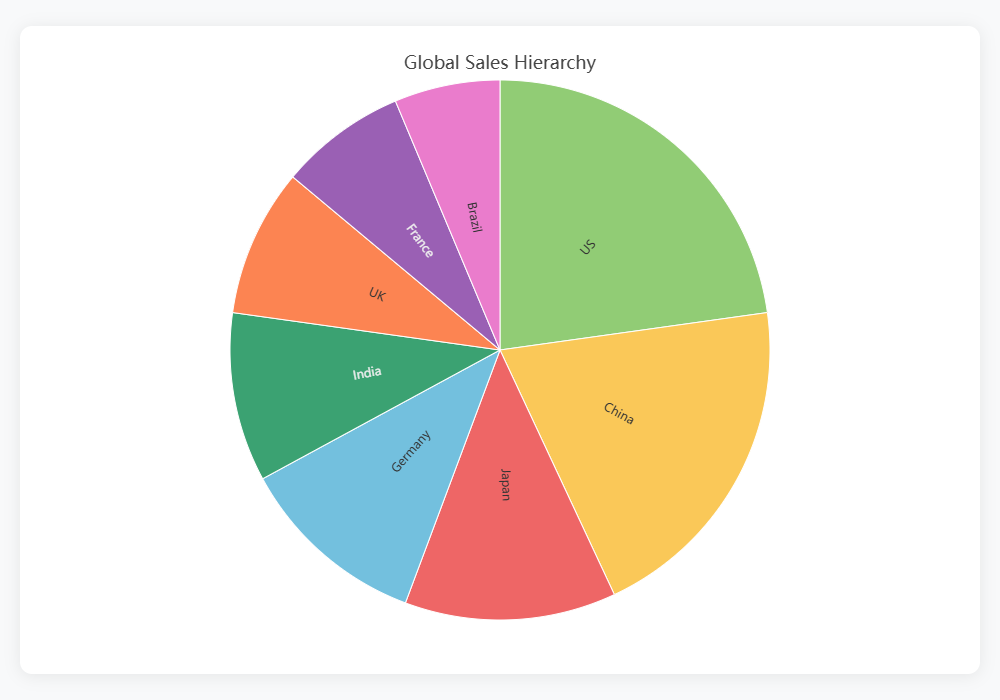
13.13 Candlestick Chart
DataFrame kline = PD.DataFrame(Map.of(
    "date", List.of("2024-01-01", "2024-01-02", "2024-01-03", "2024-01-04"),
    "open", List.of(100, 102, 105, 103),
    "high", List.of(108, 107, 110, 106),
    "low", List.of(98, 100, 103, 101),
    "close", List.of(102, 105, 103, 104)
));
kline.plot().candlestick("date", "open", "high", "low", "close").title("K-Line").show();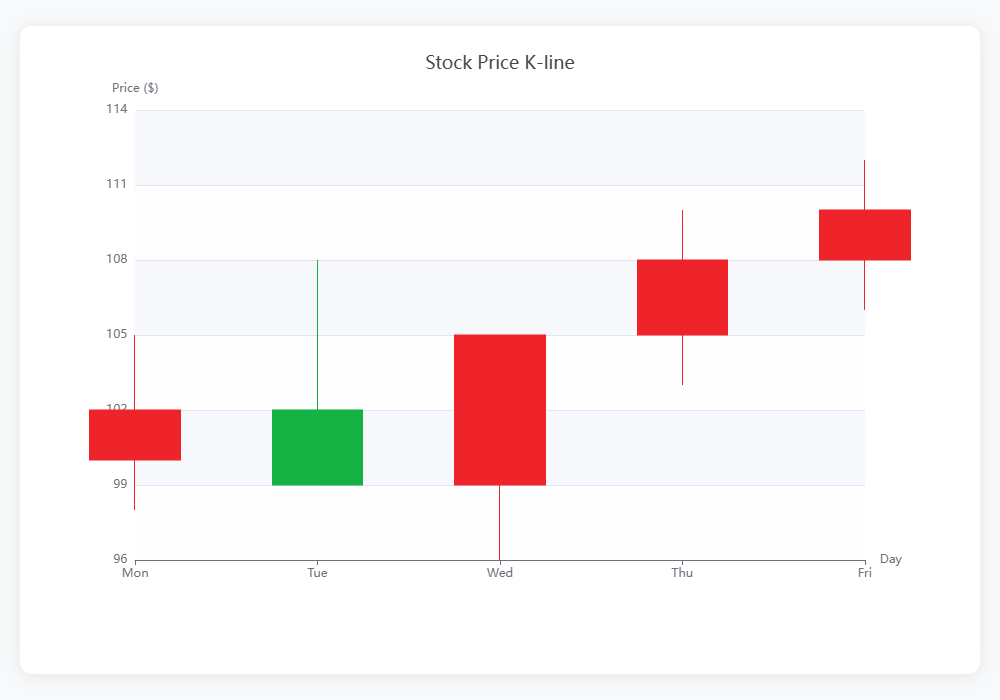
13.14 Waterfall Chart
DataFrame wf_df = PD.DataFrame(Map.of(
    "item", List.of("Start", "Revenue", "Cost", "Tax", "Net"),
    "value", List.of(1000, 500, -300, -100, 1100)
));
wf_df.plot().waterfall("item", "value").title("Waterfall Chart").show();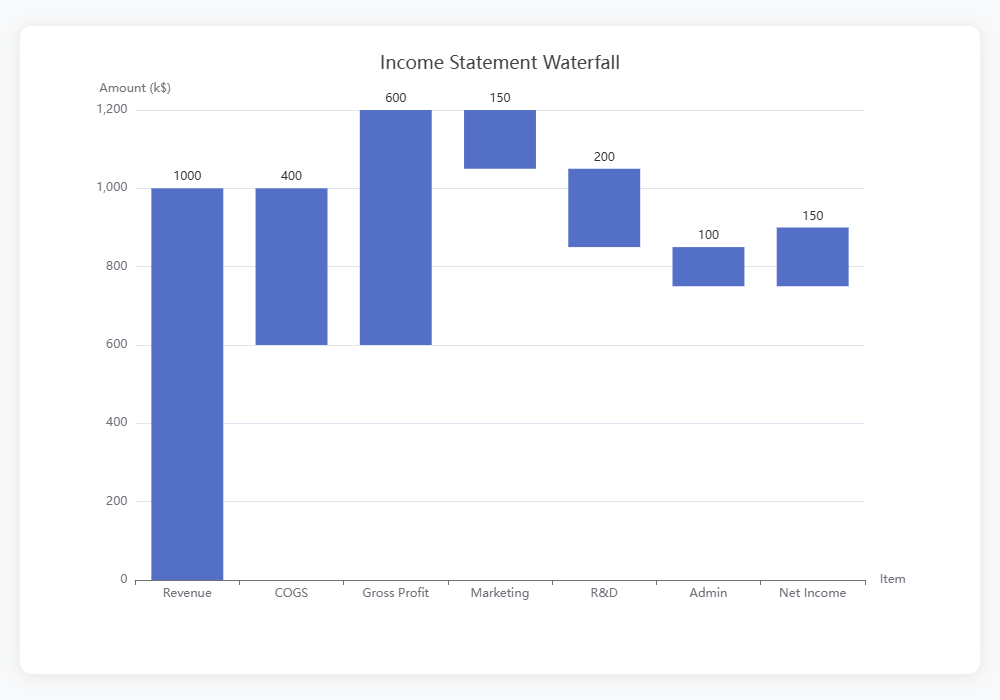
13.15 3D Scatter Chart
DataFrame s3d = PD.DataFrame(Map.of(
    "x", List.of(1, 2, 3, 4, 5),
    "y", List.of(2, 3, 1, 5, 4),
    "z", List.of(5, 4, 3, 2, 1)
));
s3d.plot().scatter3d("x", "y", "z").title("3D Scatter").show();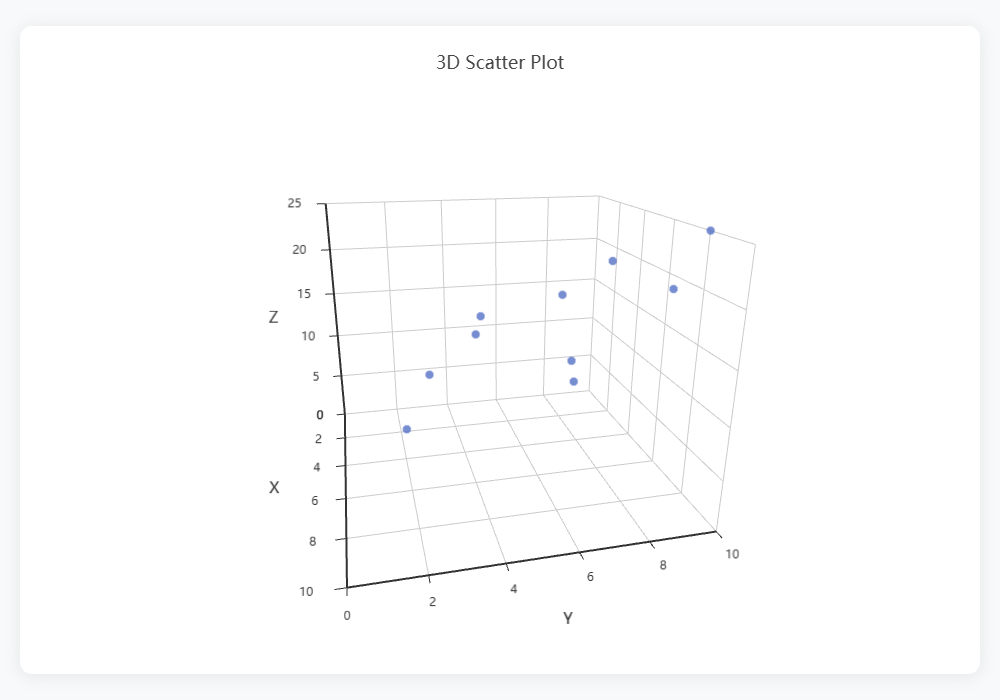
13.16 3D Bar Chart
DataFrame b3d = PD.DataFrame(Map.of(
    "x", List.of(1, 2, 3),
    "z", List.of("A", "B", "C"),
    "value", List.of(10, 20, 15)
));
b3d.plot().bar3d("x", "z", "value").title("3D Bar").show();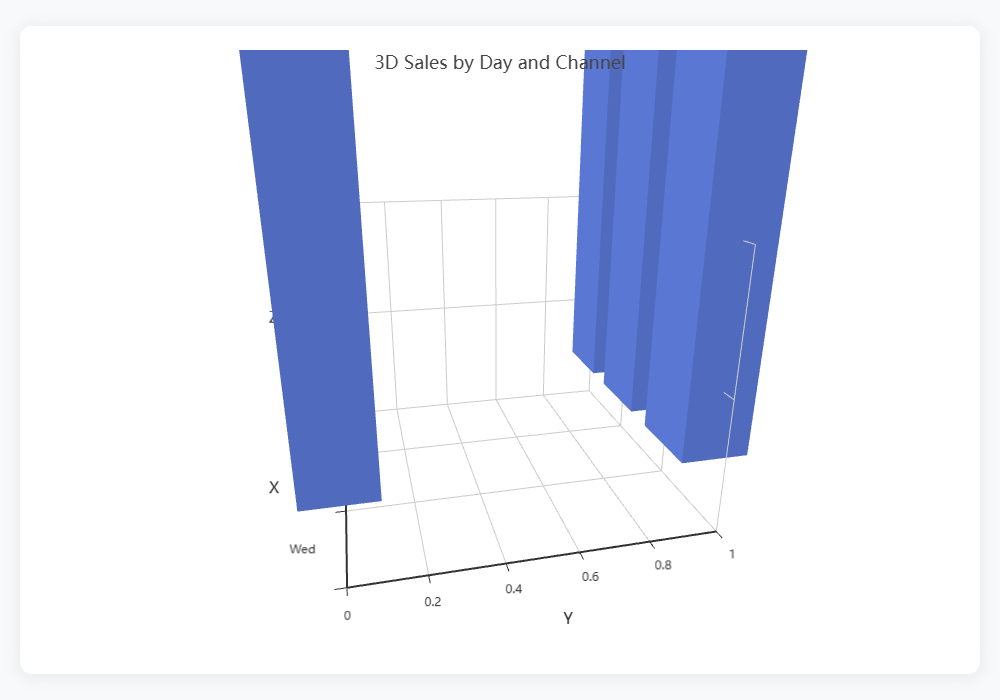
13.17 3D Surface Chart
DataFrame surf = PD.DataFrame(Map.of(
    "x", List.of(1, 1, 2, 2, 3, 3),
    "y", List.of(1, 2, 1, 2, 1, 2),
    "z", List.of(5, 10, 8, 12, 6, 9)
));
surf.plot().surface("x", "y", "z").title("3D Surface").show();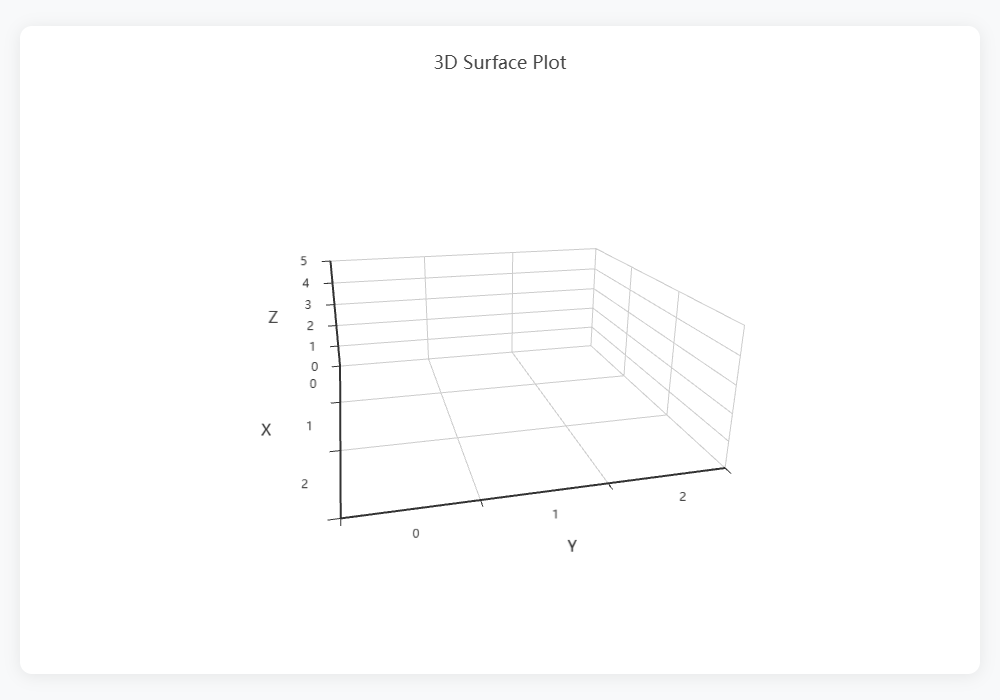
13.18 3D Line Chart
DataFrame l3d = PD.DataFrame(Map.of(
    "x", List.of(1, 2, 3, 4, 5),
    "y", List.of(2, 4, 1, 5, 3),
    "z", List.of(5, 3, 4, 2, 1)
));
l3d.plot().line3d("x", "y", "z").title("3D Line").show();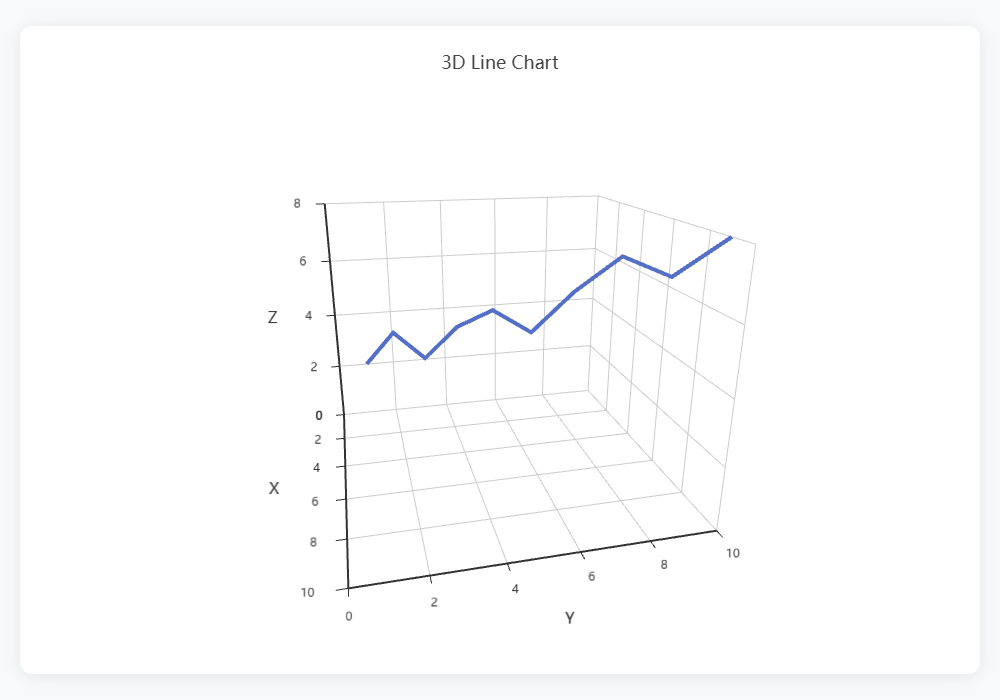
Chart Customization
All charts support:
.title(String)— set chart title.xlabel(String)— set x-axis label.ylabel(String)— set y-axis label.show()— render and open in browser athttp://localhost:<port>/chart/<id>
14. Exceptions
All exceptions extend PandaException (a RuntimeException):
| Exception | Description | |-----------|-------------| | DataException | Data-related errors: wrong type for operation, column not found, size mismatch | | IndexException | Index-related errors: label not found, duplicate labels, out of bounds |
Arithmetic Operations
Series Arithmetic
Series<Double> s = PD.Series(1.0, 2.0, 3.0, 4.0, 5.0);
// Scalar operations Series<Double> added = s.add(10);    // each element + 10 Series<Double> subbed = s.sub(2);    // each element - 2 Series<Double> multi = s.mul(3);     // each element * 3 Series<Double> divided = s.div(2);   // each element / 2
// Series-to-series operations (aligned by index) Series<Double> other = PD.Series(10.0, 20.0, 30.0, 40.0, 50.0); Series<Double> sum = s.add(other);   // element-wise addition Series<Double> diff = s.sub(other);  // element-wise subtraction Series<Double> prod = s.mul(other);  // element-wise multiplication Series<Double> quot = s.div(other);  // element-wise division
DataFrame Arithmetic
Arithmetic operations apply to all numeric columns:
DataFrame df = PD.DataFrame(Map.of(
    "a", List.of(1, 2, 3),
    "b", List.of(4, 5, 6)
));
DataFrame added = df.add(10);    // add 10 to all numeric columns DataFrame subbed = df.sub(2);    // subtract 2 from all numeric columns DataFrame multi = df.mul(3);     // multiply all numeric columns by 3 DataFrame divided = df.div(2);   // divide all numeric columns by 2
Immutability
All data structures in mini-panda are immutable. Every mutating operation returns a new object, leaving the original unchanged:
DataFrame original = PD.DataFrame(Map.of("a", List.of(1, 2, 3)));
DataFrame modified = original.add(10);
// original is unchanged, still [1, 2, 3] // modified is [11, 12, 13]
Build & Test
# Compile
mvn compile
Run all tests
mvn test
Run a single test class
mvn test -Dtest="DataFrameTest"
Run a single test method
mvn test -Dtest="DataFrameTest#testSelectColumns"
Run the demo
mvn exec:java -Dexec.mainClass="io.github.mini.panda.Main"
License
MIT


