
Confusion matrix metrics directly from your pandas DataFrame
disarray


disarray calculates metrics derived from a confusion matrix and makes them directly accessible from a pandas DataFrame.
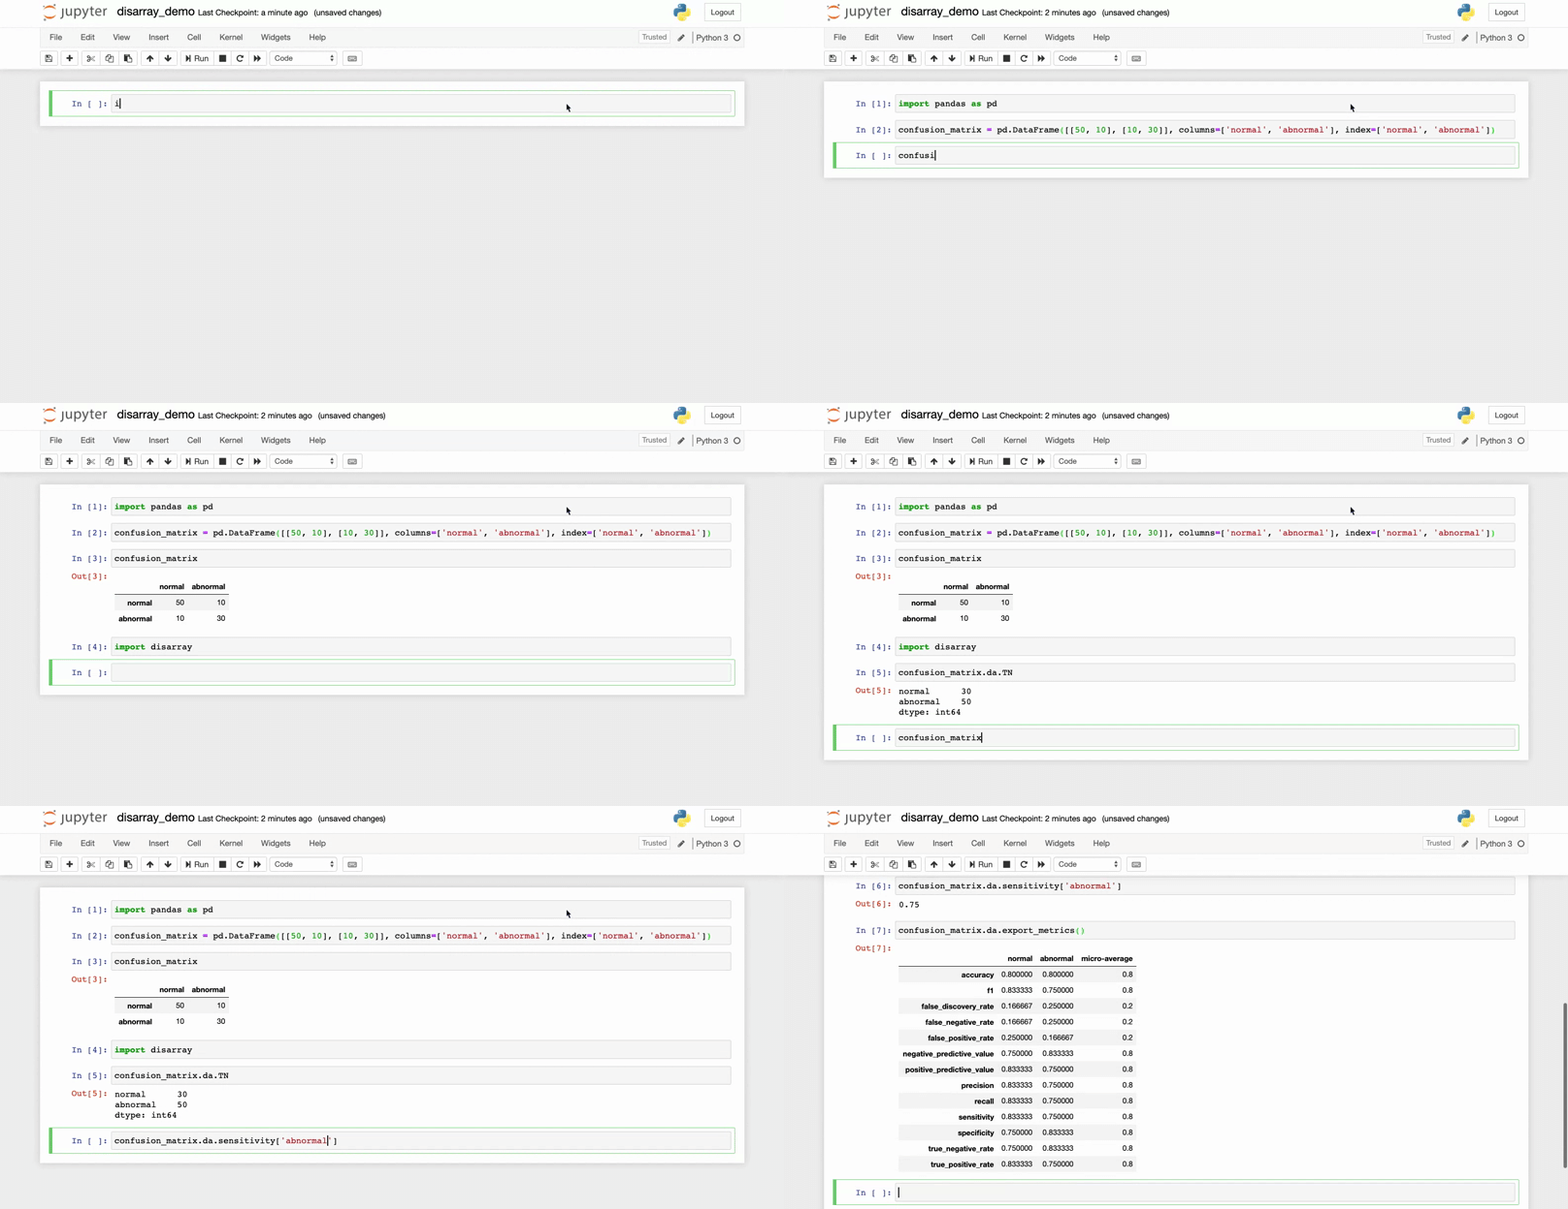
If you are already using pandas, then disarray is easy to use, simply import disarray:
import pandas as pd
dtype=int is important for Windows users
df = pd.DataFrame([[18, 1], [0, 1]], dtype=int)
import disarray
df.da.sensitivity 0    0.947368 1    1.000000 dtype: float64
Table of contents
* binary classification * class counts * export metrics * multi-class classification * supported metricsInstallation
Install using pip$ pip install disarrayClone from GitHub
$ git clone https://github.com/arvkevi/disarray.git $ python setup.py installUsage
Thedisarray package is intended to be used similar to a pandas attribute or method. disarray is registered as
a pandas extension under da. For a DataFrame named df, access the library using df.da..
Binary Classification
To understand the input and usage fordisarray, build an example confusion matrix for a binary classification
problem from scratch with scikit-learn.
(You can install the packages you need to run the demo with: pip install -r requirements.demo.txt)
from sklearn import svm, datasets
from sklearn.modelselection import traintest_split
from sklearn.metrics import confusion_matrix
Generate a random binary classification dataset
X, y = datasets.makeclassification(nclasses=2, random_state=42)
Xtrain, Xtest, ytrain, ytest = traintestsplit(X, y, random_state=42)
fit and predict an SVM
classifier = svm.SVC(kernel='linear', C=0.01)
ypred = classifier.fit(Xtrain, ytrain).predict(Xtest)
cm = confusionmatrix(ytest, y_pred) print(cm) [[13  2]  [ 0 10]]
Using disarray is as easy as importing it and instantiating a DataFrame object from a square array of positive integers.
import disarray
import pandas as pd
dtype=int is important for Windows users
df = pd.DataFrame(cm, dtype=int)
access metrics for each class by index
print(df.da.precision[1])
0.83
Class Counts
disarray stores per-class counts of true positives, false positives, false negatives, and true negatives. Each of these are stored as capitalized abbreviations, TP, FP, FN, and TN.
df.da.TP0 13
1 10
dtype: int64Export Metrics
Usedf.da.export_metrics() to store and/or visualize many common performance metrics in a new pandas DataFrame
object. Use the metricstoinclude= argument to pass a list of metrics defined in disarray/metrics.py (default is
to use all_metrics).
df.da.exportmetrics(metricsto_include=['precision', 'recall', 'f1'])Multi-Class Classification
disarray works with multi-class classification confusion matrices also. Try it out on the iris dataset. Notice, the
DataFrame is instantiated with an index and columns here, but it is not required.
# load the iris dataset
iris = datasets.load_iris()
X = iris.data
y = iris.target
classnames = iris.targetnames
split the training and testing data
Xtrain, Xtest, ytrain, ytest = traintestsplit(X, y, random_state=0)
train and fit a SVM
classifier = svm.SVC(kernel='linear', C=0.01)
ypred = classifier.fit(Xtrain, ytrain).predict(Xtest)
cm = confusionmatrix(ytest, y_pred)
Instantiate the confusion matrix DataFrame with index and columns
dtype=int is important for Windows users
df = pd.DataFrame(cm, index=classnames, columns=classnames, dtype=int)
print(df)disarray can provide per-class metrics:
df.da.sensitivitysetosa 1.000
versicolor 0.625
virginica 1.000
dtype: float64df.da.sensitivity['setosa']1.0df.da.micro_sensitivity0.8421052631578947df.da.exportmetrics(metricsto_include=['sensitivity', 'specificity', 'f1'])| | setosa | versicolor | virginica | micro-average | |-------------|----------|--------------|-------------|-----------------| | sensitivity | 1.0 | 0.625 | 1.0 | 0.842105 | | specificity | 1.0 | 1.0 | 0.793103 | 0.921053 | | f1 | 1.0 | 0.769231 | 0.75 | 0.842105 |
Supported Metrics
'accuracy',
'f1',
'falsediscoveryrate',
'falsenegativerate',
'falsepositiverate',
'negativepredictivevalue',
'positivepredictivevalue',
'precision',
'recall',
'sensitivity',
'specificity',
'truenegativerate',
'truepositiverate',df.da.micro_recall, for example.
Why disarray?
Working with a confusion matrix is common in data science projects. It is useful to have performance metrics available directly from pandas DataFrames. Since pandas version 0.23.0, users can easily register custom accessors, which is how disarray is implemented.
Contributing
Contributions are welcome, please refer to CONTRIBUTING to learn more about how to contribute.


