alandefreitas
matplotplusplus
C++

Matplot++: A C++ Graphics Library for Data Visualization 📊🗾
Last updated Jul 6, 2026
4.9k
Stars
380
Forks
82
Issues
0
Stars/day
Attention Score
99
Language breakdown
C++ 99.7%
CMake 0.3%
C 0.0%
Files click to expand
README

Matplot++

A C++ Graphics Library for Data Visualization

Matplot++


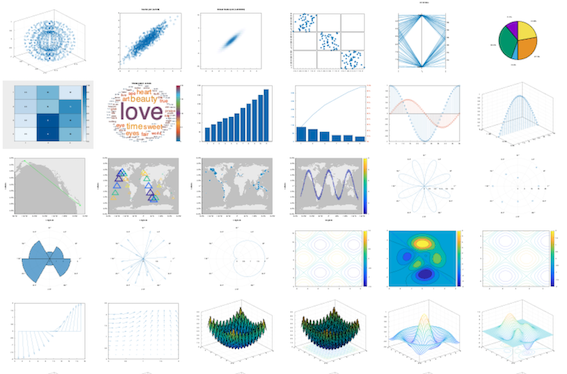
Data visualization can help programmers and scientists identify trends in their data and efficiently communicate these results with their peers. Modern C++ is being used for a variety of scientific applications, and this environment can benefit considerably from graphics libraries that attend the typical design goals toward scientific data visualization. Besides the option of exporting results to other environments, the customary alternatives in C++ are either non-dedicated libraries that depend on existing user interfaces or bindings to other languages. Matplot++ is a graphics library for data visualization that provides interactive plotting, means for exporting plots in high-quality formats for scientific publications, a compact syntax consistent with similar libraries, dozens of plot categories with specialized algorithms, multiple coding styles, and supports generic backends.


Latest Release Documentation Discussions


Facebook QZone Weibo Reddit Twitter LinkedIn WhatsApp Line.me Telegram.me HackerNews


READ THE DOCUMENTATION FOR A QUICK START AND EXAMPLES

Table of Contents

-

- Package Managers - CMake - Install - Line Plots - Data Distribution - Discrete Data - Geography - Polar Plots - Contour Plots - Vector Fields - Surfaces - Graphs - Images - Text - Text with Arrow - Rectangle - Filled Polygon - Ellipse - Textbox - Arrow - Line - Labels - Axis - Grid - Multiplot - Colormaps - Camera - Figure Object - Line Specs - Axes Object - Clear Axes - Saving (Manually) - Saving (Programatically) - Member vs. Free-standing Functions - Reactive vs. Quiet Figures - Method Chaining - Ranges - Common Utilities - Backends - Motivation and Details - Get Involved - Ideas and Roadmap - Contributing Guidelines - Contributors

Gallery

example<em>plot</em>1 example<em>plot3</em>1 example<em>stairs</em>1 example<em>errorbar</em>1 example<em>area</em>1 example<em>loglog</em>1 example<em>fplot</em>1 example<em>fimplicit</em>1 example<em>histogram</em>1 example<em>boxplot</em>1 example<em>scatter</em>1 example<em>scatter3</em>1 example<em>binscatter</em>1 example<em>plotmatrix</em>1 example<em>parallelplot</em>1 example<em>pie</em>1 example<em>heatmap</em>1 example<em>wordcloud</em>1 example<em>bar</em>1 example<em>pareto</em>1 example<em>stem</em>1 example<em>stem3</em>1 example</em>geoplot<em>1 example<em>geoscatter</em>1 example</em>geobubble<em>1 example<em>geodensityplot</em>1 example<em>polarplot</em>1 example<em>polarscatter</em>1 example<em>polarhistogram</em>1 example<em>compass</em>1 example<em>ezpolar</em>1 example<em>contour</em>1 example<em>contourf</em>1 example<em>fcontour</em>1 example<em>feather</em>1 example<em>quiver</em>1 example</em>surf<em>1 example<em>surfc</em>1 example</em>mesh<em>1 example<em>meshc</em>1 example</em>meshz<em>1 example<em>fsurf</em>1 example</em>fmesh<em>1 example<em>waterfall</em>1 example</em>fence<em>1 example<em>ribbon</em>1 example</em>graph<em>1 example<em>digraph</em>1 example</em>imshow<em>1 example<em>image</em>1 example</em>imagesc_1

Complete Gallery

example<em>plot</em>1 example<em>plot</em>2 example<em>plot</em>3 example<em>plot</em>4 example<em>plot</em>5 example<em>plot</em>6 example<em>plot</em>7 example<em>plot</em>8 example<em>plot</em>9 example<em>plot</em>10 example<em>plot</em>11 example<em>plot</em>12 example<em>plot3</em>1 example<em>plot3</em>2 example<em>plot3</em>3 example<em>plot3</em>4 example<em>plot3</em>5 example<em>plot3</em>6 example<em>plot3</em>7 example<em>plot3</em>8 example<em>plot3</em>9 example<em>plot3</em>10 example<em>stairs</em>1 example<em>stairs</em>2 example<em>stairs</em>3 example<em>stairs</em>4 example<em>stairs</em>5 example<em>stairs</em>6 example<em>stairs</em>7 example<em>stairs</em>8 example<em>stairs</em>9 example<em>stairs</em>10 example<em>errorbar</em>1 example<em>errorbar</em>2 example<em>errorbar</em>3 example<em>errorbar</em>4 example<em>errorbar</em>5 example<em>errorbar</em>6 example<em>errorbar</em>7 example<em>errorbar</em>8 example<em>errorbar</em>9 example<em>errorbar</em>10 example<em>area</em>1 example<em>area</em>2 example<em>area</em>3 example<em>area</em>4 example<em>loglog</em>1 example<em>loglog</em>2 example<em>loglog</em>3 example<em>loglog</em>4 example<em>loglog</em>5 example<em>loglog</em>6 example<em>loglog</em>7 example<em>loglog</em>8 example<em>loglog</em>9 example<em>semilogx</em>1 example<em>semilogy</em>1 example<em>fplot</em>1 example<em>fplot</em>2 example<em>fplot</em>3 example<em>fplot</em>4 example<em>fplot</em>5 example<em>fplot</em>6 example<em>fplot3</em>1 example<em>fplot3</em>2 example<em>fplot3</em>3 example<em>fplot3</em>4 example<em>fplot3</em>5 example<em>fimplicit</em>1 example<em>fimplicit</em>2 example<em>fimplicit</em>3 example<em>fimplicit</em>4 example<em>histogram</em>1 example<em>histogram</em>2 example<em>histogram</em>3 example<em>histogram</em>4 example<em>histogram</em>5 example<em>histogram</em>6 example<em>histogram</em>7 example<em>histogram</em>8 example<em>histogram</em>9 example<em>histogram</em>10 example<em>histogram</em>11 example<em>histogram</em>12 example<em>histogram</em>14 example<em>boxplot</em>1 example<em>boxplot</em>2 example<em>boxplot</em>3 example<em>scatter</em>1 example<em>scatter</em>2 example<em>scatter</em>3 example<em>scatter</em>4 example<em>scatter</em>5 example<em>scatter</em>6 example<em>scatter</em>7 example<em>scatter</em>8 example<em>scatter3</em>1 example<em>scatter3</em>2 example<em>scatter3</em>3 example<em>scatter3</em>4 example<em>scatter3</em>5 example<em>scatter3</em>6 example<em>binscatter</em>1 example<em>binscatter</em>2 example<em>binscatter</em>3 example<em>binscatter</em>4 example<em>binscatter</em>5 example<em>binscatter</em>6 example<em>binscatter</em>7 example<em>plotmatrix</em>1 example<em>plotmatrix</em>2 example<em>plotmatrix</em>3 example<em>plotmatrix</em>4 example<em>parallelplot</em>1 example<em>parallelplot</em>2 example<em>parallelplot</em>3 example<em>pie</em>1 example<em>pie</em>2 example<em>pie</em>3 example<em>pie</em>4 example<em>pie</em>5 example<em>pie</em>6 example<em>heatmap</em>1 example<em>heatmap</em>2 example<em>heatmap</em>3 example<em>heatmap</em>4 example<em>heatmap</em>5 example<em>heatmap</em>6 example<em>heatmap</em>7 example<em>wordcloud</em>1 example<em>wordcloud</em>3 example<em>wordcloud</em>4 example<em>wordcloud</em>4 example<em>bar</em>1 example<em>bar</em>2 example<em>bar</em>3 example<em>bar</em>4 example<em>bar</em>5 example<em>bar</em>6 example<em>bar</em>7 example<em>bar</em>8 example<em>bar</em>9 example<em>bar</em>10 example<em>bar</em>11 example<em>bar</em>12 example<em>bar</em>13 example<em>pareto</em>1 example<em>pareto</em>2 example<em>pareto</em>3 example<em>pareto</em>4 example<em>stem</em>1 example<em>stem</em>2 example<em>stem</em>3 example<em>stem</em>4 example<em>stem</em>5 example<em>stem</em>6 example<em>stem</em>7 example<em>stem</em>8 example<em>stem</em>9 example<em>stem3</em>1 example<em>stem3</em>2 example<em>stem3</em>3 example<em>stem3</em>4 example<em>stem3</em>5 example<em>stem3</em>6 example<em>stem3</em>7 example<em>stem3</em>8 example<em>stem3</em>9 example<em>stem3</em>10 example<em>stem3</em>11 example</em>geoplot<em>1 example<em>geoplot</em>2 example</em>geoplot<em>3 example<em>geoplot</em>4 example</em>geoplot<em>5 example<em>geoplot</em>6 example</em>geoplot<em>7 example<em>geoscatter</em>1 example</em>geoscatter<em>2 example<em>geobubble</em>1 example</em>geobubble<em>2 example<em>geodensityplot</em>1 example<em>polarplot</em>1 example<em>polarplot</em>2 example<em>polarplot</em>3 example<em>polarplot</em>4 example<em>polarplot</em>5 example<em>polarplot</em>6 example<em>polarplot</em>7 example<em>polarplot</em>8 example<em>polarscatter</em>1 example<em>polarscatter</em>2 example<em>polarscatter</em>3 example<em>polarscatter</em>4 example<em>polarscatter</em>5 example<em>polarscatter</em>6 example<em>polarhistogram</em>1 example<em>polarhistogram</em>2 example<em>polarhistogram</em>3 example<em>polarhistogram</em>4 example<em>polarhistogram</em>5 example<em>compass</em>1 example<em>compass</em>2 example<em>ezpolar</em>1 example<em>ezpolar</em>2 example<em>contour</em>1 example<em>contour</em>2 example<em>contour</em>3 example<em>contour</em>4 example<em>contour</em>5 example<em>contour</em>6 example<em>contour</em>7 example<em>contour</em>8 example<em>contourf</em>1 example<em>contourf</em>2 example<em>contourf</em>3 example<em>contourf</em>4 example<em>contourf</em>5 example<em>contourf</em>6 example<em>fcontour</em>1 example<em>fcontour</em>2 example<em>fcontour</em>3 example<em>fcontour</em>4 example<em>fcontour</em>5 example<em>fcontour</em>6 example<em>fcontour</em>7 example<em>fcontour</em>8 example<em>fcontour</em>9 example<em>fcontour</em>10 example<em>fcontour</em>11 example<em>feather</em>1 example<em>quiver</em>1 example<em>quiver</em>2 example<em>quiver</em>3 example<em>quiver</em>4 example<em>quiver</em>5 example<em>quiver</em>6 example<em>quiver3</em>1 example<em>quiver3</em>2 example</em>surf<em>1 example<em>surf</em>2 example</em>surf<em>3 example<em>surf</em>4 example</em>surf<em>5 example<em>surf</em>6 example</em>surfc<em>1 example<em>surfc</em>2 example</em>surfc<em>3 example<em>surfc</em>4 example</em>mesh<em>1 example<em>mesh</em>2 example</em>mesh<em>3 example<em>mesh</em>4 example</em>meshc<em>1 example<em>meshc</em>2 example</em>meshc<em>3 example<em>meshz</em>1 example</em>meshz<em>2 example<em>meshz</em>3 example</em>fsurf<em>1 example<em>fsurf</em>2 example</em>fsurf<em>3 example<em>fsurf</em>4 example</em>fsurf<em>5 example<em>fsurf</em>6 example</em>fsurf<em>7 example<em>fsurf</em>8 example</em>fmesh<em>1 example<em>fmesh</em>2 example</em>fmesh<em>3 example<em>fmesh</em>4 example</em>waterfall<em>1 example<em>waterfall</em>2 example</em>waterfall<em>3 example<em>fence</em>1 example</em>fence<em>2 example<em>fence</em>3 example</em>ribbon<em>1 example<em>ribbon</em>2 example</em>ribbon<em>3 example<em>ribbon</em>4 example</em>graph<em>1 example<em>graph</em>2 example</em>graph<em>3 example<em>graph</em>4 example</em>graph<em>5 example<em>graph</em>6 example</em>digraph<em>1 example<em>digraph</em>2 example</em>digraph<em>3 example<em>imshow</em>1 example</em>imshow<em>2 example<em>imshow</em>3 example</em>imshow<em>4 example<em>imshow</em>5 example</em>imshow<em>6 example<em>imshow</em>7 example</em>imshow<em>8 example<em>imshow</em>9 example</em>imshow<em>10 example<em>imshow</em>11 example</em>image<em>1 example<em>image</em>2 example</em>image<em>3 example<em>image</em>4 example</em>image<em>5 example<em>imagesc</em>1 example</em>imagesc<em>2 example<em>imagesc</em>3 example</em>imagesc<em>4 example<em>text</em>1 example</em>text<em>2 example<em>text</em>3 example</em>text<em>4 example<em>text</em>5 example</em>text<em>6 example<em>text</em>7 example</em>text<em>8 example<em>textarrow</em>1 example</em>textarrow<em>2 example<em>rectangle</em>1 example</em>rectangle<em>2 example<em>rectangle</em>3 example</em>rectangle<em>4 example<em>rectangle</em>5 example</em>fill<em>1 example<em>ellipse</em>1 example</em>textbox<em>1 example<em>arrow</em>1 example</em>arrow<em>2 example<em>line</em>1 example</em>title<em>1 example<em>title</em>2 example</em>title<em>3 example<em>title</em>4 example</em>title<em>5 example<em>title</em>6 example</em>title<em>7 example<em>title</em>8 example</em>sgtitle<em>1 example<em>sgtitle</em>2 example</em>xlabel<em>1 example<em>xlabel</em>2 example</em>xlabel<em>3 example<em>xlabel</em>4 example</em>xlabel<em>5 example<em>xlabel</em>6 example</em>xlabel<em>7 example<em>xlabel</em>8 example</em>ylabel<em>1 example<em>ylabel</em>2 example</em>ylabel<em>3 example<em>ylabel</em>4 example</em>ylabel<em>5 example<em>ylabel</em>6 example</em>ylabel<em>7 example<em>ylabel</em>8 example</em>zlabel<em>1 example<em>zlabel</em>2 example</em>zlabel<em>3 example<em>legend</em>1 example</em>legend<em>2 example<em>legend</em>3 example</em>legend<em>4 example<em>legend</em>5 example</em>legend<em>6 example<em>legend</em>7 example</em>legend<em>8 example<em>legend</em>9 example</em>xlim<em>1 example<em>xlim</em>2 example</em>xlim<em>3 example<em>xlim</em>4 example</em>xlim<em>5 example<em>xlim</em>6 example</em>ylim<em>1 example<em>ylim</em>2 example</em>ylim<em>3 example<em>ylim</em>4 example</em>ylim<em>5 example<em>ylim</em>6 example</em>zlim<em>1 example<em>zlim</em>2 example</em>zlim<em>3 example<em>zlim</em>4 example</em>zlim<em>5 example<em>zlim</em>6 example</em>axis<em>1 example<em>axis</em>2 example</em>axis<em>3 example<em>axis</em>4 example</em>axis<em>5 example<em>axis</em>6 example</em>axis<em>7 example<em>axis</em>8 example</em>box<em>1 example<em>box</em>2 example</em>box<em>3 example<em>grid</em>1 example</em>grid<em>2 example<em>grid</em>3 example</em>grid<em>4 example<em>xticks</em>1 example</em>xticks<em>2 example<em>xticks</em>3 example</em>xticks<em>4 example<em>xticks</em>5 example</em>xticks<em>6 example<em>xticks</em>7 example</em>xticks<em>8 example<em>yticks</em>1 example</em>yticks_2

🔗 More in this category

© 2026 GitRepoTrend · alandefreitas/matplotplusplus · Updated daily from GitHub









