
Dimension UI is a desktop application designed to collect, store, visualize, and analyze time series data
Dimension UI
Contents
- General information - Application Areas - Minimum technical requirements - Getting started with the project - Building the Project - Installation and configuration - Logical structure description - Application architecture - Algorithms - Z-normalized Euclidean distance - Program API - Used methods - Input parameters - Output parameters - GUI - GUI sequence diagram - Configuration management - Workspace Interface - Dashboard Interface - Report Interface - Ad-hoc Interface - Screencast - Code use cases - Install LaF theme on application startup - CI/CDProgram Description
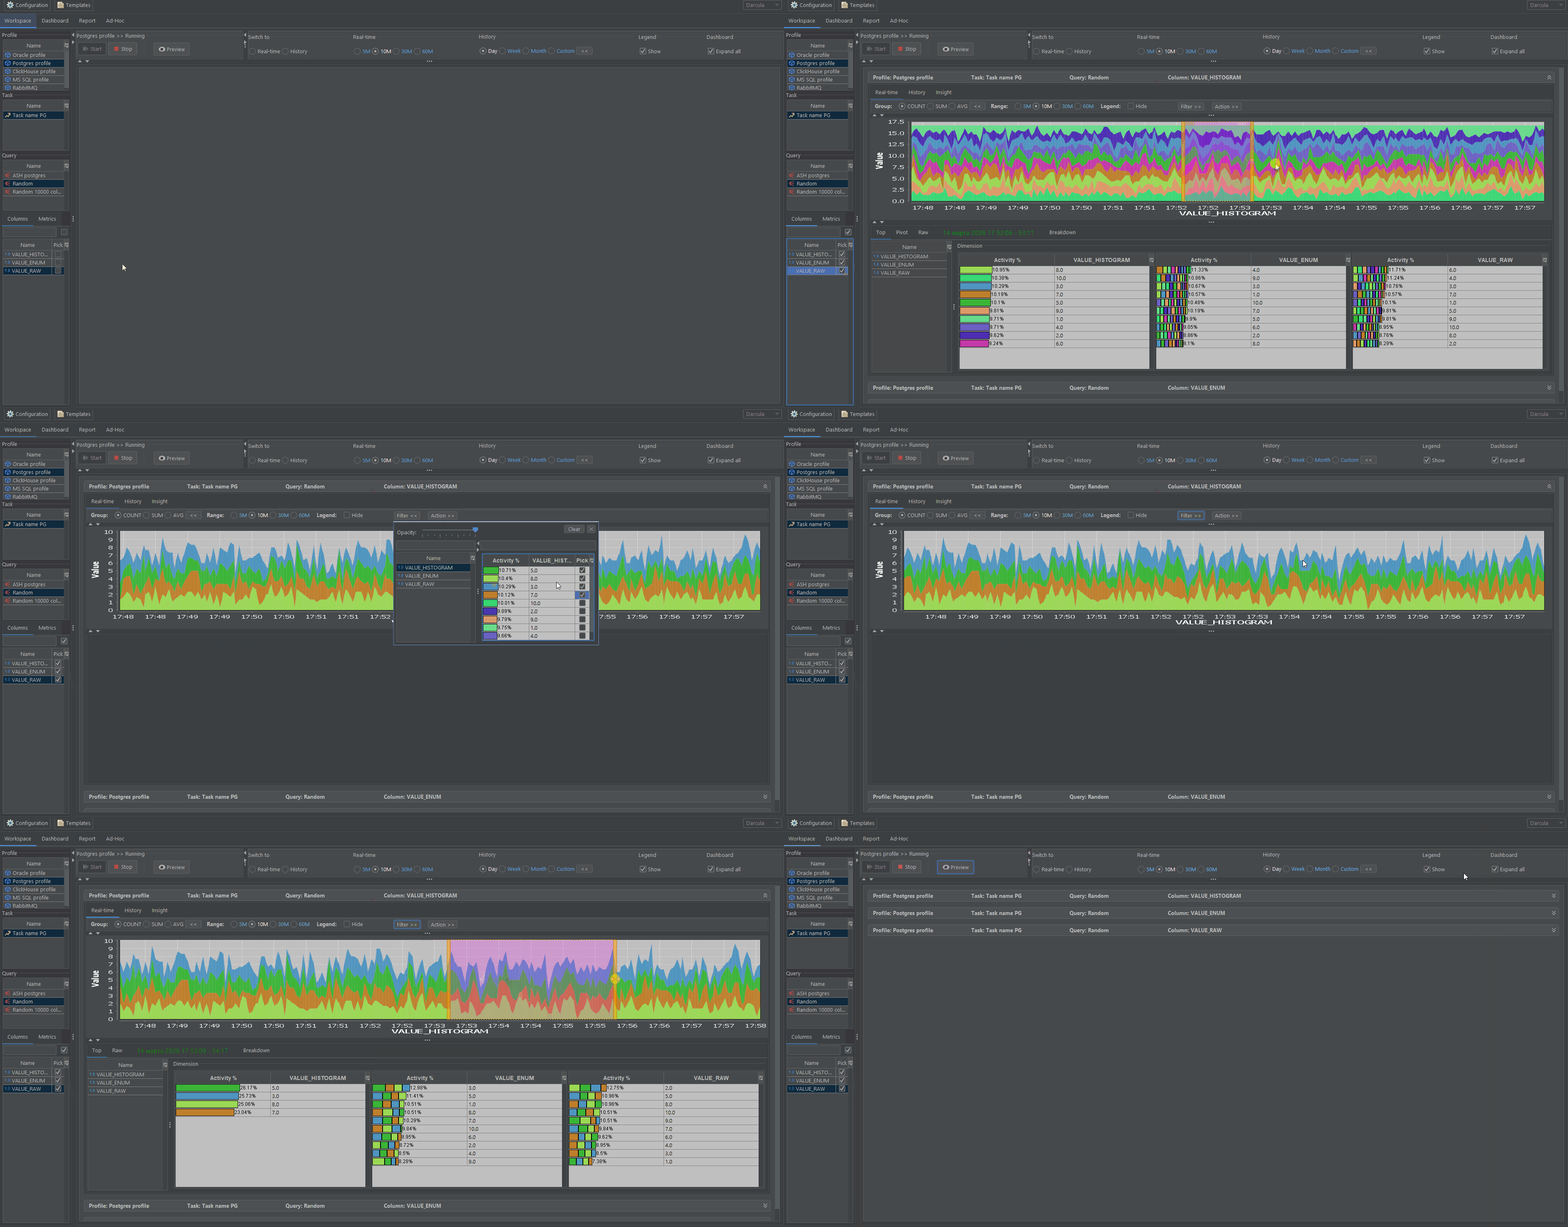
Dimension UI is a desktop application designed to collect, store, visualize and analyze time series data.Workspace
Dashboard
Report
Ad-hoc
General Information
Key Features of Dimension UI:
| № | Feature | Description | |---|------------------------------------------|----------------------------------------------------------------------------------------------------------------------------------------------------------------------------------------------------------------------------| | 1 | Real-time Data Collection & Analysis | Data is collected in real time, enabling users to monitor metrics online, analyze responses to various impacts, review historical data, and perform comparative analysis with other indicators | | 2 | Flexible Data Collection Profiles | Rapid configuration of data collection profiles — particularly useful when speed is critical, allowing users to quickly gather specialized statistical data for detailed evaluation of system or component characteristics | | 3 | Local Storage in Dimension-DB | Block-columnar database with built-in data compression and deduplication. Project repositories on GitHub | | 4 | Advanced Time-Series Data Mining | Built-in support for Matrix Profile and ARIMA algorithms for advanced time-series analysis and predictive analytics | | 5 | No-code DB Exploration | Ad-hoc data visualization from external databases via JDBC with automatic SQL query generation. Both time-series and regular table data supported | | 6 | Dashboard System | Displaying metrics from multiple sources in a single interface. Quick access to metrics simplifies workflows when reviewing large volumes of analytical data | | 7 | Built-in Reporting System | Generating PDF reports based on collected data for further analysis |
Application Areas
| № | Application Area | Description | |---|-------------------------------|------------------------------------------------------------------------------------------------------------------------------------------------------------------------------------------------| | 1 | Real-time Monitoring | Monitoring information systems, hardware/software systems, and databases in real time | | 2 | Load & Stress Testing | Evaluation of hardware and software systems during load and stress testing, preparation of reports based on testing results | | 3 | IoT Monitoring | Monitoring the parameters of the Internet of Things (IoT) devices | | 4 | Information Security | Complex monitoring of information security of systems with access to data sources via JDBC and HTTP API (Prometheus, JSON) | | 5 | Education & Training | Training in courses related to data processing and analysis: quick setup of data collection, visualization and advanced data analysis for system administrators, DBAs, developers and analysts | | 6 | Diagnostics | Diagnostics of problems in complex systems providing APIs via JDBC and HTTP (Prometheus, JSON), including heterogeneous environments and Java microservices | | 7 | Multidimensional Analysis | Analysis and visualization of time-series data (real-time and historical), including predictive analytics via JDBC and HTTP (Prometheus, JSON) | | 8 | No-code DB Exploration | Direct JDBC connection to external databases to explore time-series data in tables and views with automated SQL generation |
Supported Databases for Direct JDBC Connection (No-code Mode)
| No. | Database | Type | |-----|----------------------|------------| | 1 | PostgreSQL | relational | | 2 | Oracle | relational | | 3 | Microsoft SQL Server | relational | | 4 | MySQL | relational | | 5 | ClickHouse | analytical | | 6 | Firebird | relational | | 7 | SQLite | relational | | 8 | DuckDB | analytical |
Minimum technical requirements
Dimension UI is compatible with Java 25+ and comes with a small set of dependencies.Hardware requirements
Table 1. Hardware requirements
| Parameter | Description | |:-----------------|:-----------------------------------------------------------------------------------------------------------------------------------| | CPU and RAM | Processor with a frequency of at least 500 MHz and a memory capacity of at least 250 MB, depending on the volume of processed data | | CPU architecture | Intel 64-bit (x8664), AMD 64-bit (x8664), Arm 64-bit (aarch64) | | Disk | Disk size depending on the volume of processed data |
Software requirements
Table 2. Software requirements
| Software | Requirements | Link | |:-------------|:-----------------------|:------------------------------------------------------------| | Java | Java version 25+ | Java | | Maven | Latest current version | Maven | | Git | Latest current version | Git | | Dimension-DB | Latest current version | Dimension-DB | | Dimension-DI | Latest current version | Dimension-DI | | Dimension-TT | Latest current version | Dimension-TT |
Operating system requirements
Table 3. Operating system requirements
| Software | Requirements | |:-----------------|:----------------------| | Operating system | Windows, Linux, MacOS |
Getting started with the project
Building the Project
To compile the application into an executable jar file, do the following:
- Install JDK version 25 or higher, Maven and Git on your local computer:
java -version
    mvn -version
git --version- The
Dimension-UIapplication depends onDimension-DIandDimension-DB, which must be installed first:
git clone <Dimension-DI URL>
    cd dimension-di
    mvn clean install
git clone <Dimension-DB URL>
cd dimension-db
mvn clean install- Download the source codes of the application to your local computer using Git:
git clone <Dimension-UI URL>
cd dimension-ui- Compile and install modules for project using Maven:
mvn clean compile
mvn clean install -U- Execute the Maven command to build an executable jar file with tests running:
mvn clean packageThe executable jar file with launch scripts for Windows/Linux will be in the dimension-ui-<VERSION>.zip archive at the relative path desktop/target
Installation and configuration
- Windows Platform, run.bat
SET JAVA_HOME=C:\PROGRAM FILES\JAVA\jdk-25
    SET JAVAEXE="%JAVAHOME%\bin\java.exe"
    chcp 65001

%JAVA_EXE% -Xmx1024m -DtestMode=false -Dfile.encoding=UTF8 -jar desktop-1.0-SNAPSHOT-jar-with-dependencies.jar- Linux platform, run.sh
#!/bin/bash

    export JAVA_HOME=/usr/lib/jvm/java-25-openjdk-amd64
    export JAVAEXE=$JAVAHOME/bin/java
    export LANG=en_US.UTF-8
$JAVA_EXE -Xmx1024m -DtestMode=false -Dfile.encoding=UTF8 -jar desktop-1.0-SNAPSHOT-jar-with-dependencies.jar
To start working with the application you need to run the executable file run.bat/run.sh
Description of the logical structure
Application Architecture
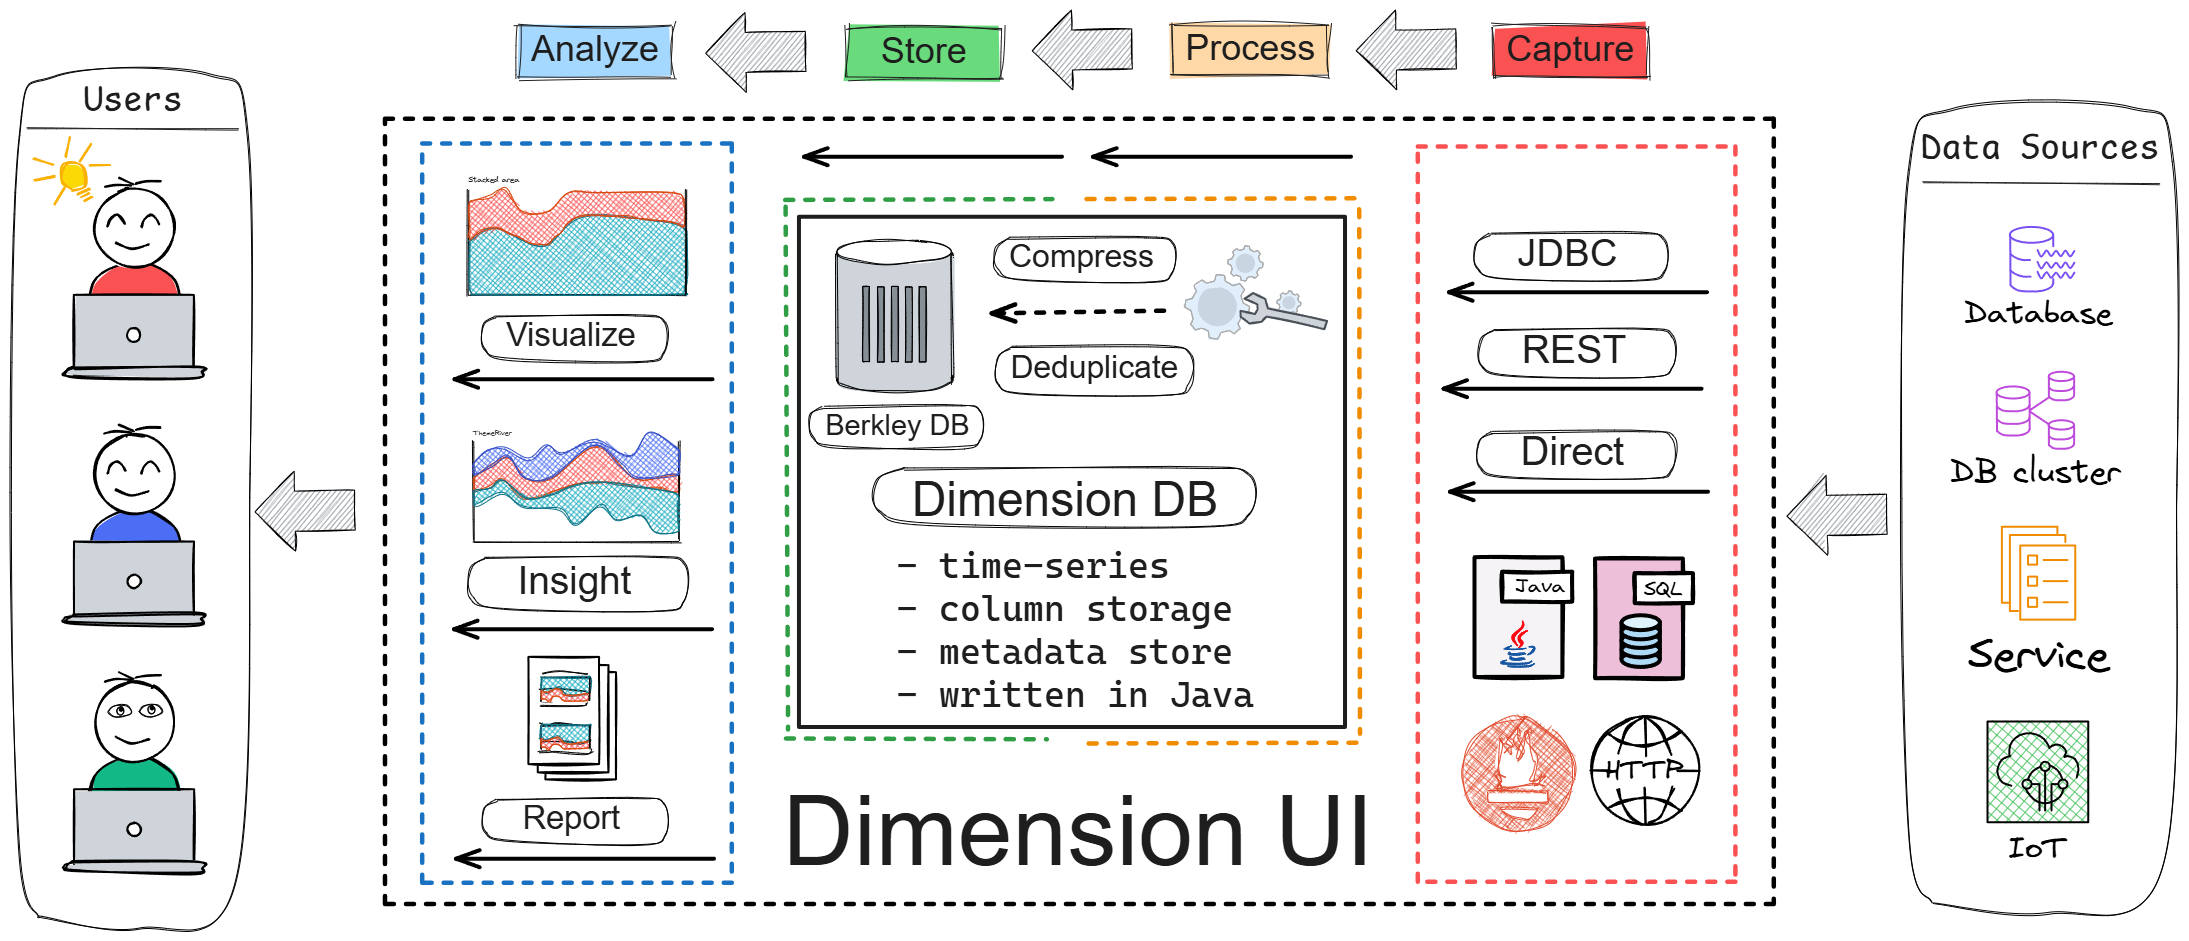
Algorithms
The application interface provides the ability to analyze time series data in terms of anomaly detection, motif discovery, and forecasting;For anomaly detection and motif discovery, the Matrix profile algorithm family is used, which uses the Z-normalized Euclidean distance to compare time series ranges.
Z-normalized Euclidean distance
Euclidean distance is a way of measuring the distance between two points in space, which can be represented as a straight line between these two points. In the context of data, this helps us understand how close two data sets or two point features are to each other."Z-normalization" is a standardization process, and its goal is to transform all of our data so that the mean is 0 and the standard deviation is 1. It's like translating all data into a common language, so that any values can be easily compared, without being affected by the scale or spread of the original values.
When we put this together, the Z-normalized Euclidean distance allows us to compare the Euclidean distance between data sets that have been normalized to a standard form. This way, we can be sure that we are comparing a distance that is independent of the original scales of the data.
This distance is often used in machine learning and statistics, for example for time series analysis or data clustering, where it is important to compare the "shape" of the data rather than the "size".
Program API
The Dimension UI program API provides an interface for loading data through JDBC and HTTP, visualizing it, and performing analysis.Methods Used
| Method | Description | GUI | |---------------------|--------------------------------------------------------------------------------------------------------------|----------------------------------------------------------------------| | JDBC Connection | Connecting to databases (PostgreSQL, Oracle, etc.) to collect data. | 🔍 Preview | | HTTP Requests | Requesting data through APIs (Prometheus) to collect metrics. | 🔍 Preview | | Data Analysis | Applying algorithms (Matrix Profile, ARIMA) to detect anomalies, patterns in data, and predictive analytics. | 🔍 Preview | | Visualization | Generating charts and graphs based on retrieved data. | 🔍 Preview |
Input Parameters
| Parameter | Description | GUI | |----------------------|----------------------------------------------------------------------------------------------------------------|---------------------------------------------------------------------| | JDBC URL | Database connection string (e.g., jdbc:postgresql://localhost:5432/mydb) | 🔍 Preview | | HTTP Endpoint | Prometheus API URL (e.g., http://localhost:9090/api/v1/query) | 🔍 Preview | | SQL Query | Table name, SQL query, or metric name (e.g., cpuusage) | 🔍 Preview | | Table Column | Table column for data visualization, grouping type, chart format | 🔍 Preview | | Time Range | Data interval for analysis (start/end date) | 🔍 Preview |
Output Parameters
| Parameter | Description | GUI | |-----------------------|---------------------------------------------------------------|----------------------------------------------------------------------------------| | Stacked Chart | Time series chart with multiple metrics (strings and numbers) | 🔍 Preview | | Linear Chart | Time series chart for displaying numerical data only | 🔍 Preview | | Gantt Chart | Gantt charts for visualizing data distribution | 🔍 Preview | | Gantt Pivot Chart | Pivot tables visualized using Gantt charts | 🔍 Preview | | Data Tables | Data representation in tabular format | 🔍 Preview | | Anomalies | Chart of detected anomalies and patterns in data | 🔍 Preview | | Forecast | Predictive analytics based on data | 🔍 Preview | | Report | Data visualizations as PDF reports | 🔍 Preview |
GUI
GUI sequence diagram
sequenceDiagram
    participant User as User
    participant Program as Program
    participant Profile as Profile
    participant Task as Task
    participant Workspace as Workspace
    participant Metrics as Metrics
    participant Reporting as Reporting
    participant Adhoc as Ad-hoc Queries
User->>Program: Launch     User->>Profile: Create Profile     alt Manual Mode         User->>Task: Fill Out Task         Task->>Task: Bind Connection         Task->>Task: Specify Requests     else Use Templates         User->>Profile: Fill Profile Using Templates     end     User->>Workspace: Go to Profile     Workspace->>Profile: Launch with Start Button     User->>Metrics: View Metrics     Metrics->>Metrics: Compare     Metrics->>User: Launch Analysis / View History     User->>Metrics: Select Metrics from Various Profiles     User->>Reporting: Go to Reporting Tab     Reporting->>User: Select Metrics for Report     User->>Adhoc: Go to Ad-hoc Queries     Adhoc->>User: Select Connection, Table/View     Adhoc->>User: Display Data and Analyze     User->>Program: Complete Program
Configuration Management
- Editing and Viewing: The interface provides capabilities for viewing and editing profiles and tasks, simplifying the management of complex configurations.
- Data Collection: Users can easily set data collection parameters through intuitive forms, where they can select data sources and configure query parameters.
- Storage Settings: The GUI allows configuring local data storage settings. The software enables selecting storage formats and compression options, optimizing disk space usage.
- Template System: The GUI lets users quickly create profiles based on existing templates, reducing setup time and accelerating system onboarding.
Workspace Interface
- Data Representation: The interface enables seamless data interaction through visual elements, allowing users to explore local database content via various graphical representations.
- Visualization Tools: The GUI supports multiple visualization types, such as stacked and linear time-series charts, Gantt diagrams, and tabular data views, enhancing data analysis.
- Data Analysis Interface: Users can perform advanced time-series analysis using algorithms like Matrix Profile, visualizing results to highlight anomalies or trends.
Dashboard Interface
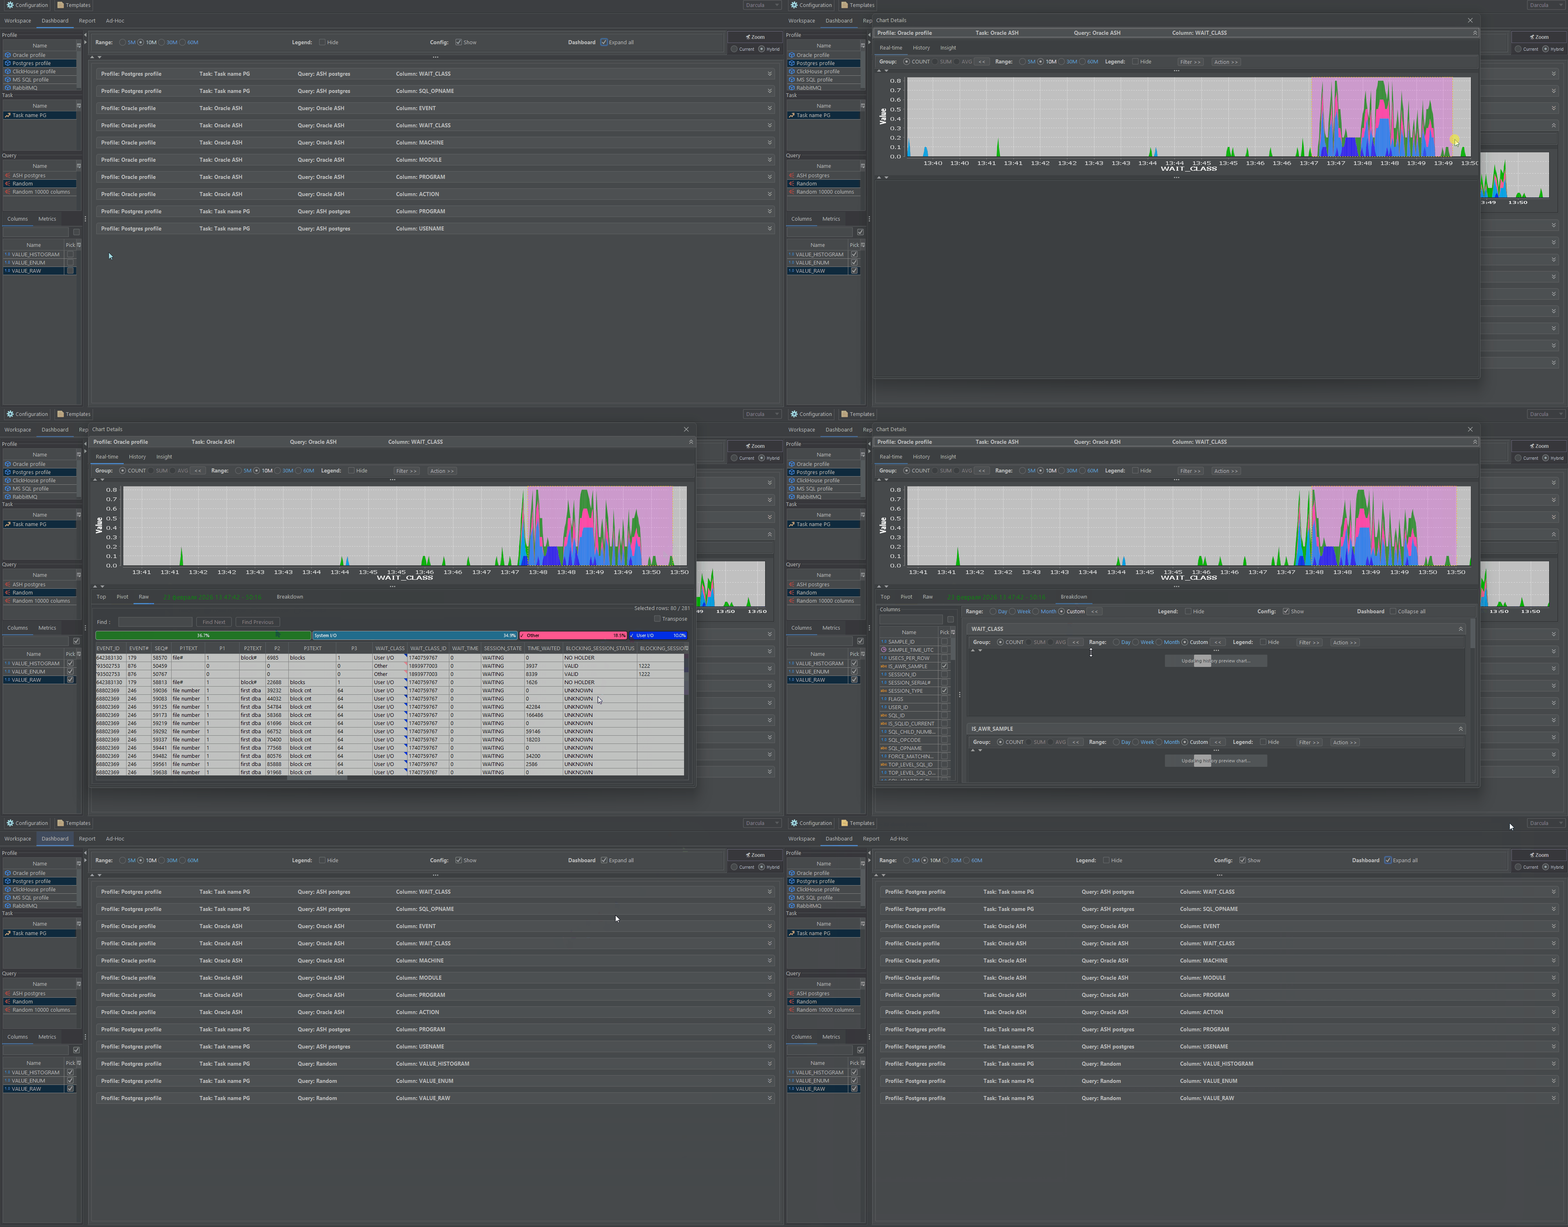
- Control Panel: Allows users to create and customize dashboards for real-time metric display, providing quick access to critical data.
Report Interface
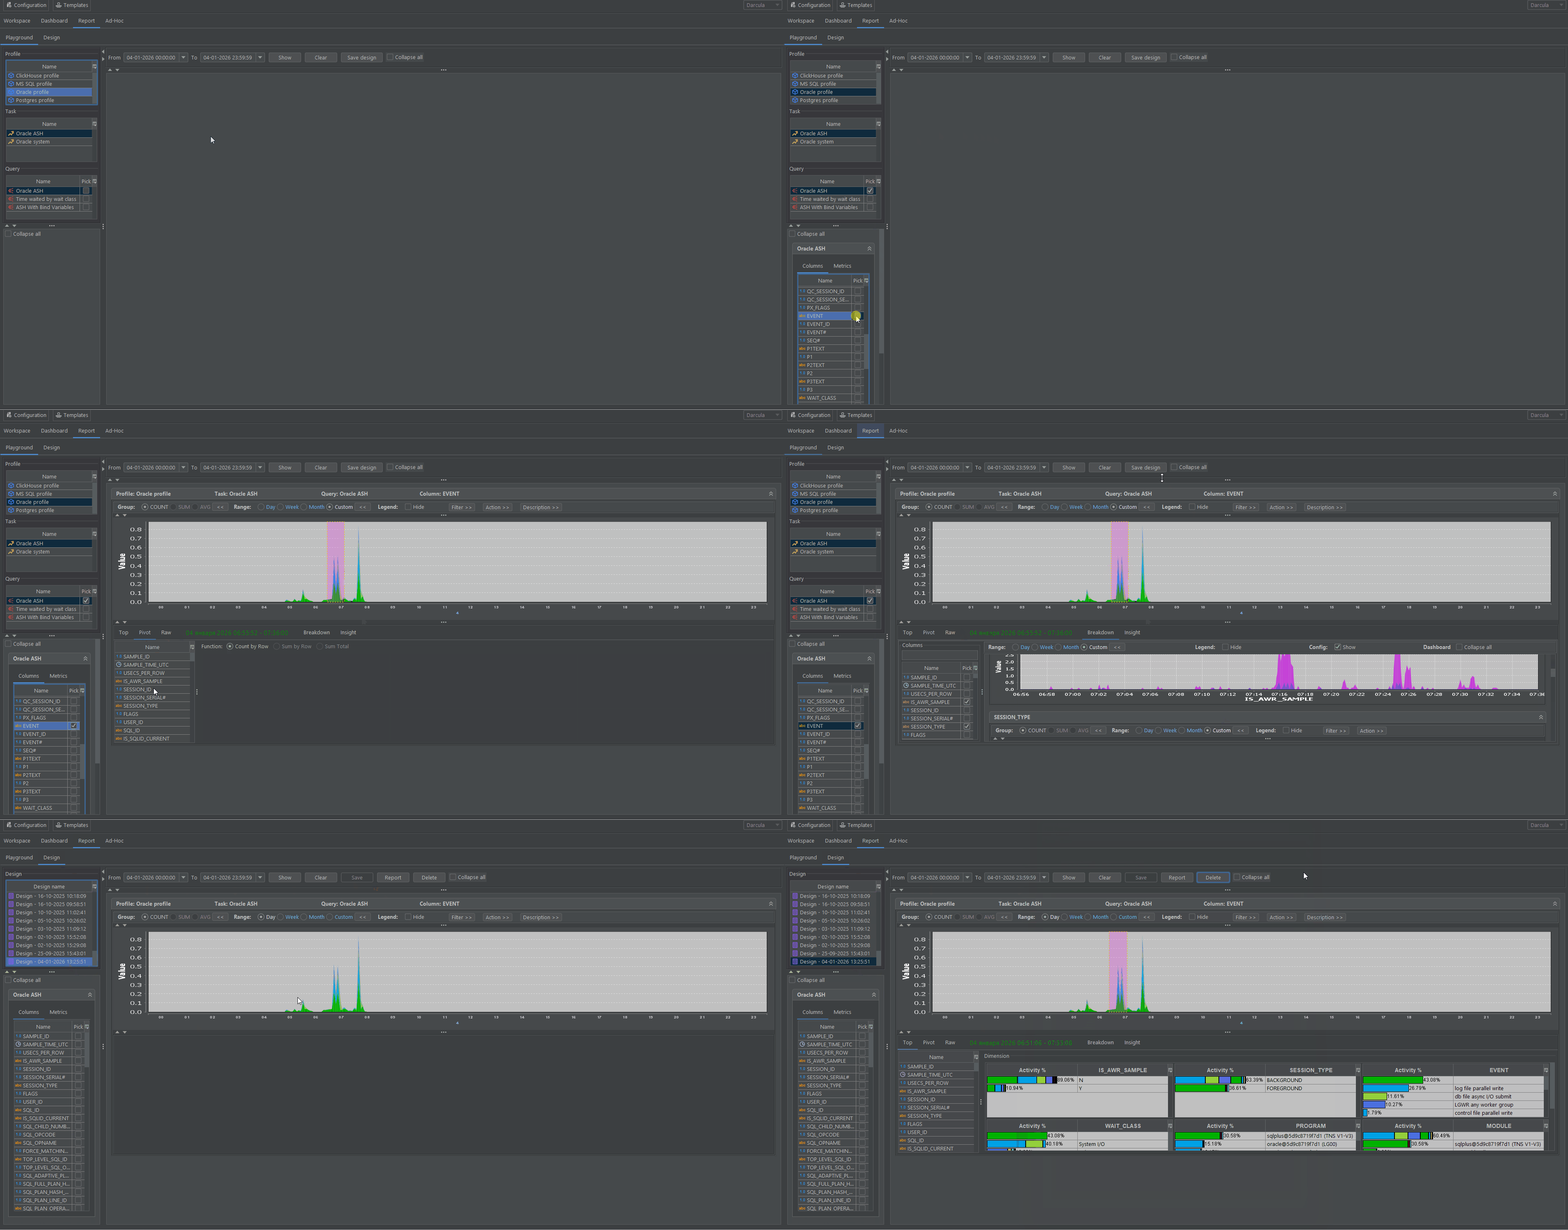
- Report Design Tools: The GUI enables configuring report generation interfaces. Users can select data, format, and layout to create export-ready PDF reports.
Ad-hoc Interface
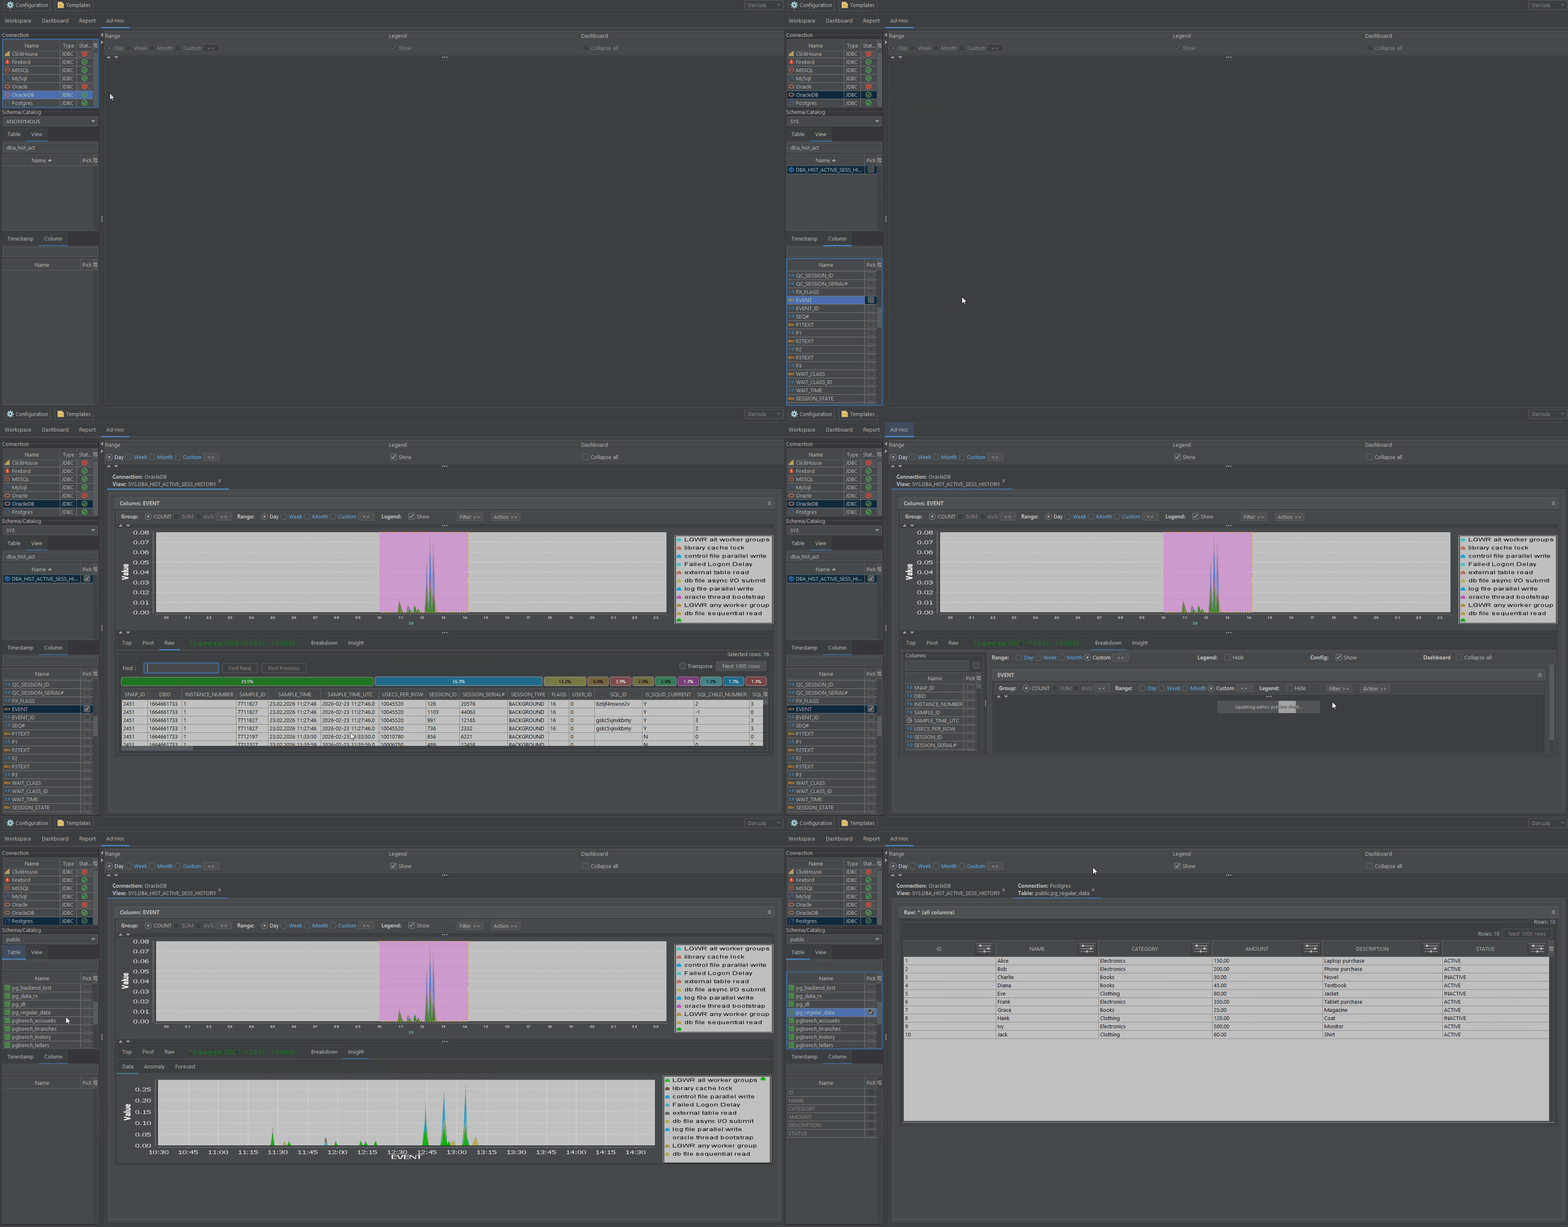
- External Database Visualization: The GUI lets users quickly access time-series data directly from external systems via JDBC.
- No-code Approach: Visualize time-series data using auto-generated SQL queries to data sources (working with denormalized data schema).
Screencast
| | Screencast | |:--------------|:-----------------------------------------------------------------------------------------------| | Configuration | 🔍 Configuration | | Workspace | 🔍 Workspace | | Dashboard | 🔍 Dashboard | | Dashboard | 🔍 Dashboard Realtime Filter | | Dashboard | 🔍 Dashboard History Filter | | Report | 🔍 Report | | Ad-hoc | 🔍 Ad-hoc | | Ad-hoc | 🔍 Ad-hoc filter |
Code Use Cases
Install LaF theme on application startup
To set the application theme, you must use the LaF parameter in the Java Virtual Machine settings (VM options). This allows you to choose between dark, light, or default themes.
Supported parameters:
- -DLaF=dark — to set the dark theme.
- -DLaF=light — to set the light theme.
- -DLaF=default — to use the default theme.
%JAVA_EXE% -Xmx1024m -DLaF=dark -Dfile.encoding=UTF8 -jar desktop-1.0-SNAPSHOT-jar-with-dependencies.jarFor more details, see the Installation and Configuration section
Download
- Building and installing DBase from source codes to a local Maven repository is described in the Building the Project section.
Development
- If you find an error in the code or have suggestions for improvement, create a ticket;
- Before starting work, you need to check the project build and successful completion of unit tests according to the instructions in the Project build section;
CI/CD
To use CI/CD use Gitea Actions:
- Install gitea 1.20 using Docker;
- Add additional configurations in app.ini to enable Actions;
- Install gitea runner follow this guide;
- Use Docker compose file;
- Create pipeline in build.yaml.
Documentation
| EN | RU | |:------------------------------------------------|:--------------------------------------------------------------| | README in English | README на русском | | User guide | Руководство пользователя |
License
 Code released under the Apache License Version 2.0
Support
Created with support of "Innovation Promotion Fund".


