
Regression, Scrapers, and Visualization
Stock Analysis
This repository contains python scripts that I am devleoping to perform analysis on stock prices and visualization of stock prices and other data such as volume.
Some of the goals I want to achieve with this project include: - Get the data I need from Yahoo Finance or other API. Able to specify what I need and the time range. - Different regression implementations on the close price data. (Linear, SVM, etc.) Possibly try to fit a polynomial function which follows the data. - Predicting Stock price for the next day.
Trends
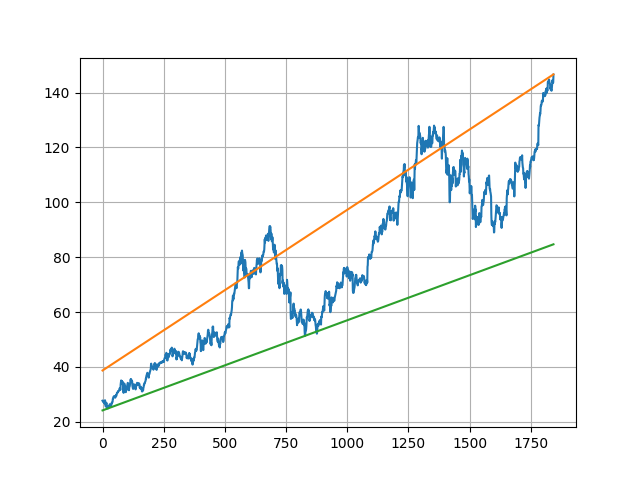
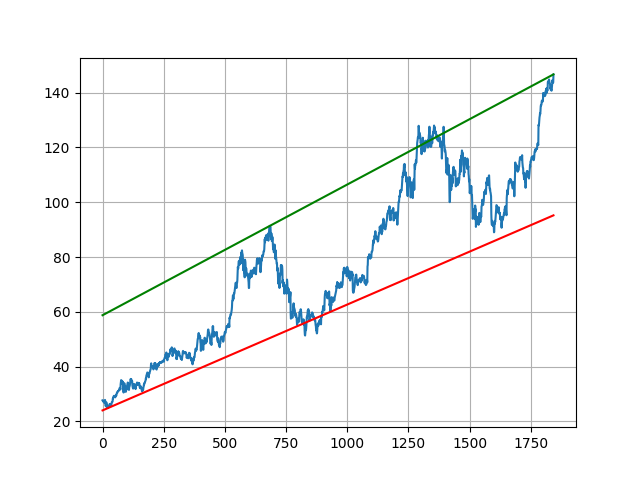
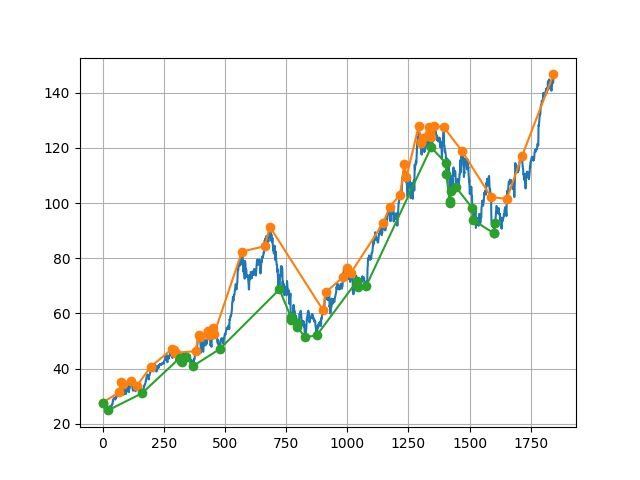
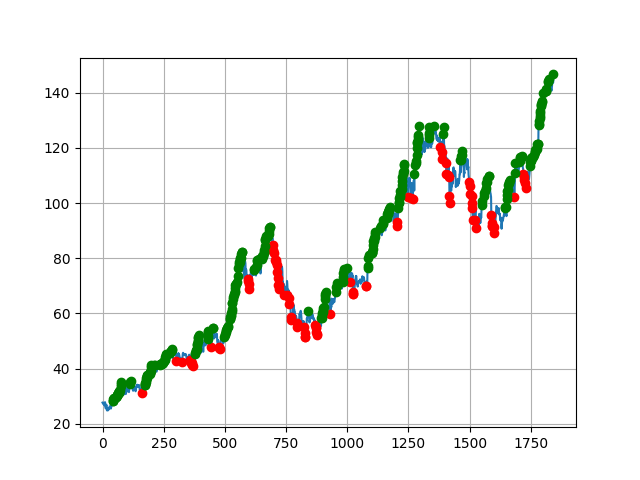
TrendLine.py Results
Regression
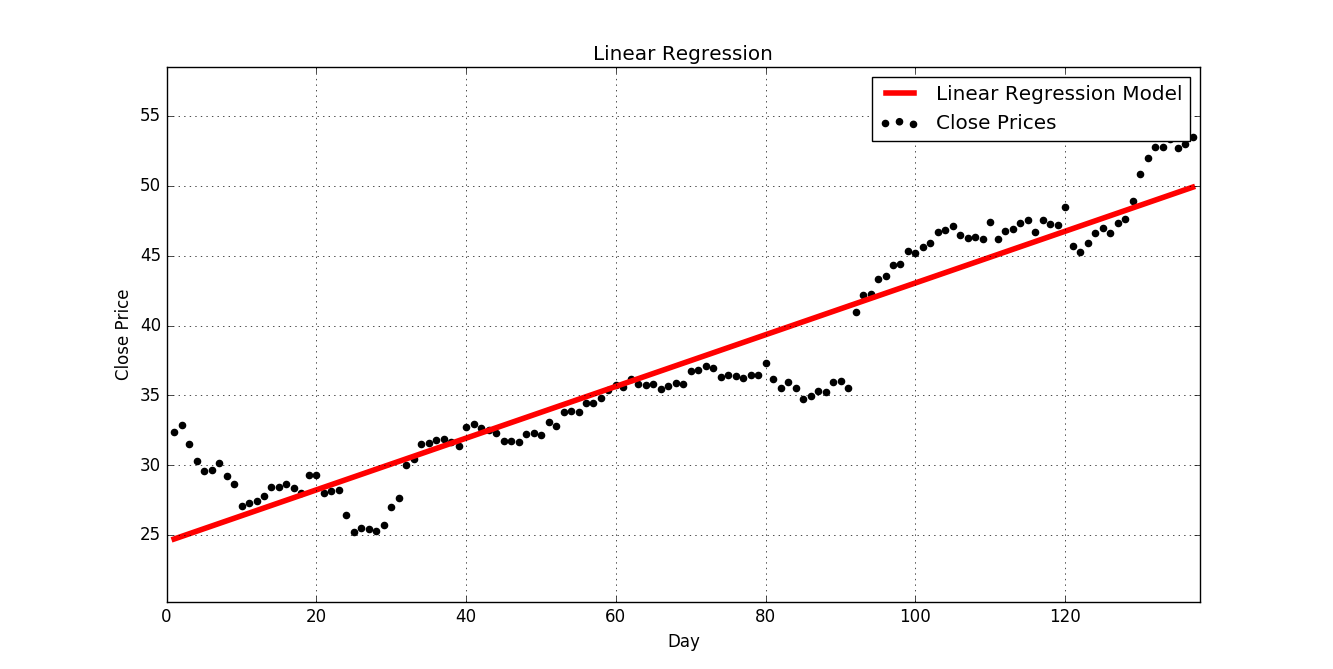
Using my code for linear regression and Nvidia's (NVDA) stock prices of each day. I got a slope of 0.1850399032986727 and a y intercept of 24.54867003005582. The 50.08 number is the price predicted for the next day based on the linear formula it calculated.
[0.1850399032986727, 24.54867003005582]
50.0841766853
Screenshots
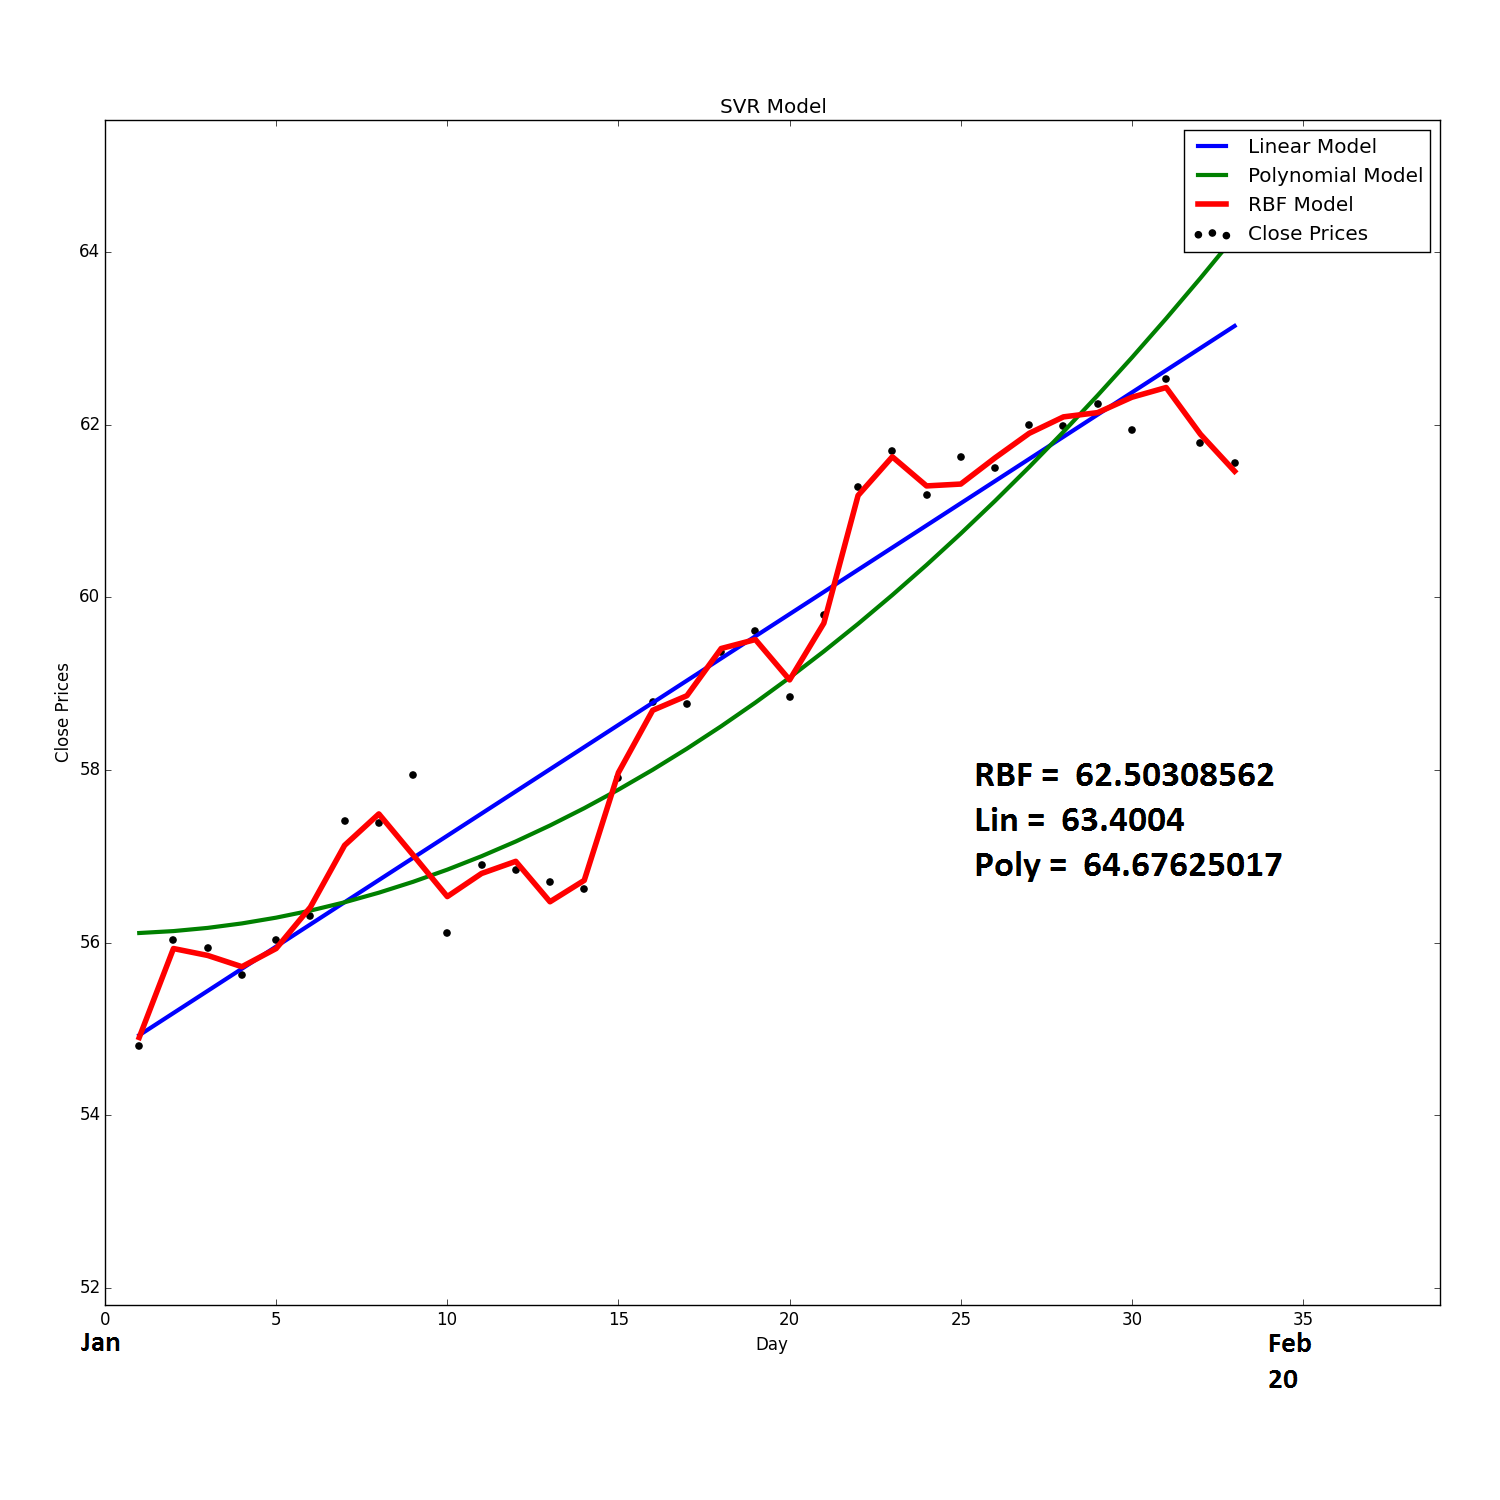
New Screenshots
AEIS
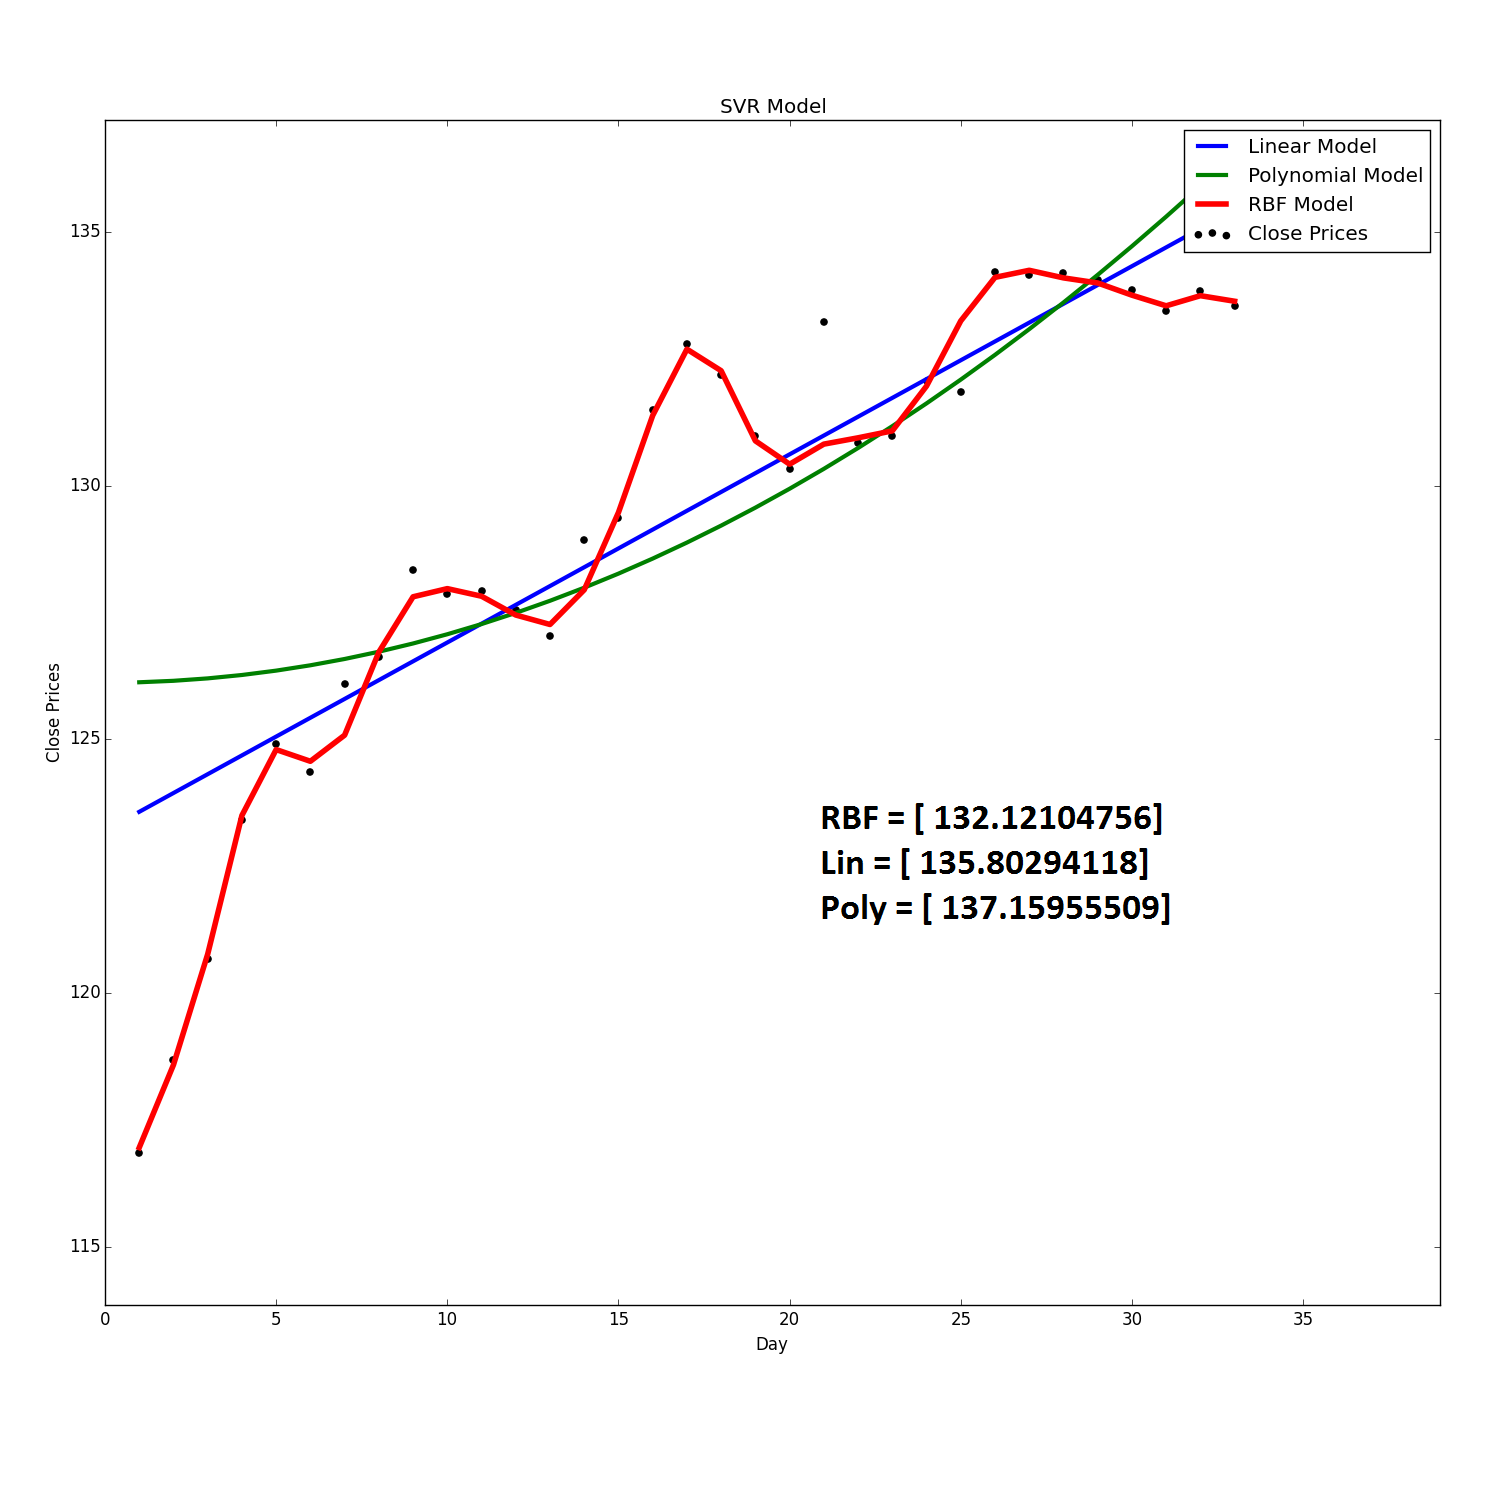
FB
Version
1.0.0 - Released Stock Scraper
1.0.1 - Minor bug fixes with duplicate entries in the CSV File
Todo
- [ ] Use Machine Learning algorithms to predict stock close price for the next day
- [ ] Add data visualization with technical indicators such as moving average, volume, STOCH.
- [ ] Add Stock screener, to screen through every stock and see which ones are best buys.
Star History
License
MIT
Free Software, Hell Yeah!


