
Automated stock screener scanning 3,800+ stocks daily for confirmed Stage 2 uptrends passing 8 strict criteria. Features: smart caching (74% fewer API calls), market regime filtering, automated stop-loss calculation, and GitHub Actions automation. Follows Mark Minervini's Trend Template.
Intelligent Stock Screener
A production-grade systematic trading system for identifying high-probability stock setups using phase-based technical analysis, relative strength momentum, and smart fundamental screening.




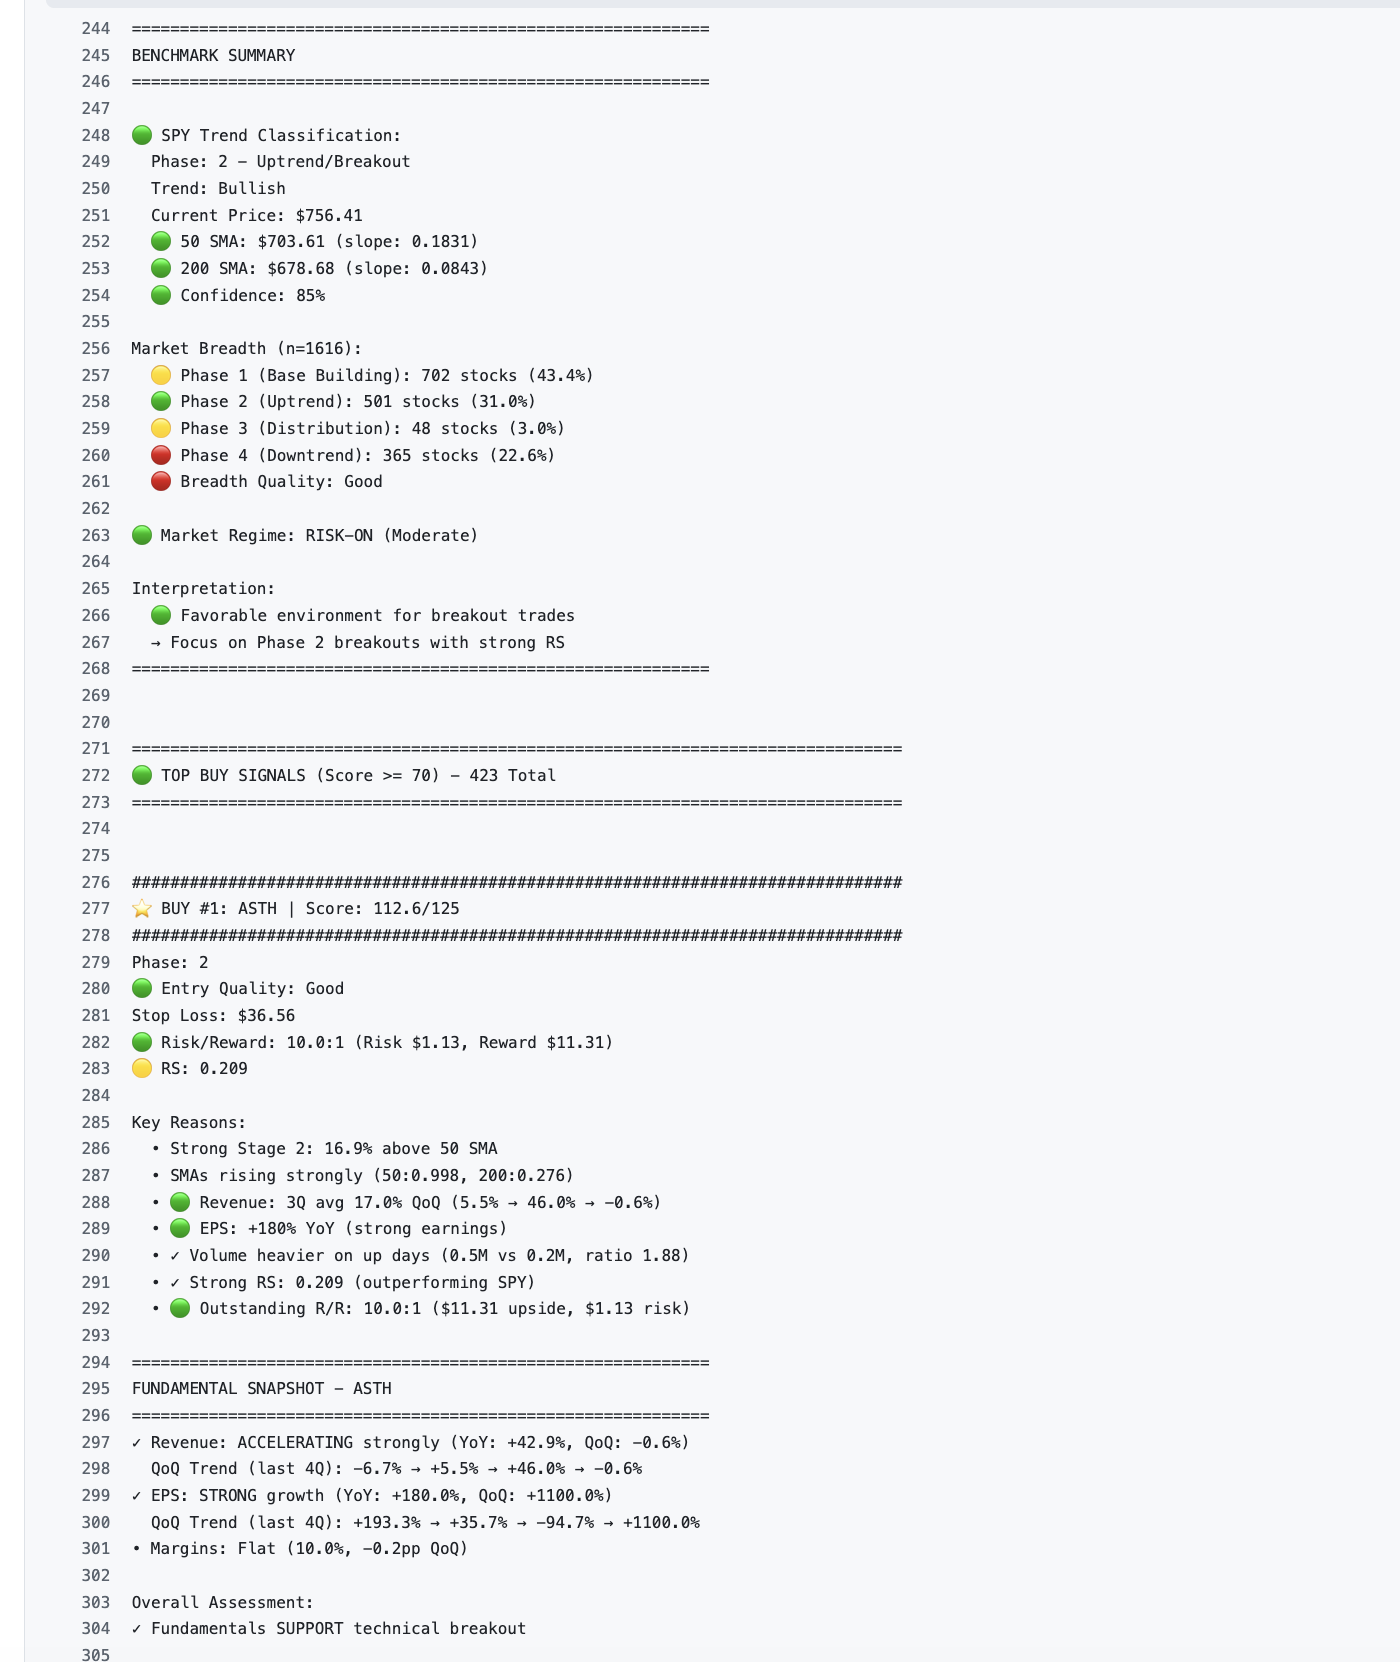
Table of Contents
- Overview
- System Architecture
- Key Features
- Design Philosophy
- Quick Start
- Daily Workflow
- Manual Position Management
- Project Structure
- Technical Details
- Future Improvements
- Contributing
- License
Overview
Intelligent Stock Screener is a fully automated, data-driven stock screening and position management system that scans 3,800+ US stocks daily to identify high-conviction buy and sell signals based on:
- Phase-based trend classification (4-stage market cycle analysis)
- Relative strength momentum (smooth linear scoring vs SPY)
- Fundamental quality filters (growth, profitability, financial health)
- Volume-weighted breakout detection
- Risk-managed stop loss recommendations
What This System Does
- Screens 3,800+ stocks every market day using GitHub Actions automation
- Identifies buy signals for stocks in confirmed Phase 2 uptrends that pass Minervini's 8-criteria Trend Template
- Identifies sell signals when stocks enter Phase 3 (distribution) or Phase 4 (downtrend) with weakening momentum
- Calculates precise stop losses with risk/reward ratios for every buy signal (max 10% risk, min 2:1 R:R)
- Generates daily reports with ranked opportunities and full technical analysis
- Manages existing positions with automated stop-loss trailing recommendations
Why I Built It This Way
Problem: Most stock screeners rely on static fundamental metrics (P/E, P/B) or generic technical patterns that don't adapt to market conditions. They ignore:
- Market regime (is SPY in an uptrend or downtrend?)
- Relative strength (is the stock outperforming the market?)
- Phase transitions (is the stock breaking out or breaking down?)
- Smart caching (redundant API calls wasting time and hitting rate limits)
- Only buy confirmed Phase 2 uptrends (not early Phase 1 bases)
- Must pass 7 of 8 strict technical criteria (50>150>200 SMA, price near highs, etc.)
- Timing matters - only buy when market (SPY) is also healthy
- Relative strength matters - only buy stocks outperforming the market
- Cache-first design - 74% reduction in API calls through Git-based fundamental storage
Methodology & Attribution
This system implements Mark Minervini's Trend Template (also known as SEPA - Specific Entry Point Analysis), a systematic approach to identifying high-probability stock setups in confirmed Stage 2 uptrends.
Mark Minervini's Influence
The core buy signal methodology is based on principles from:
- "Trade Like a Stock Market Wizard" (2013) - Minervini's systematic approach to stock selection using the Trend Template
- "Think & Trade Like a Champion" (2017) - Advanced stage analysis and risk management techniques
- "Momentum Masters" (2015) - Multi-contributor insights on momentum trading strategies
The Minervini Trend Template (8 Criteria)
Buy signals only trigger when stocks pass 7 of 8 strict criteria:
- ✅ Price > 150 SMA AND 200 SMA - Stock must be in established uptrend
- ✅ 150 SMA > 200 SMA - Moving averages in bullish alignment
- ✅ 200 SMA trending up ≥1 month - Long-term trend is bullish
- ✅ 50 SMA > 150 SMA > 200 SMA - Strongest SMA configuration (cascading)
- ✅ Price > 50 SMA - Stock respecting short-term support
- ✅ Price ≥30% above 52-week low - Stock has built significant base
- ✅ Price within 25% of 52-week high - Near new highs (not extended)
- ✅ Relative Strength ≥70 - Outperforming market (we use RS slope ≥ +0.15)
- Identifies stocks in confirmed uptrends (not early bases)
- Filters out weak stocks with poor price structure
- Ensures proper risk/reward (stocks near highs with strong momentum)
- Aligns with institutional buying (big money follows strong trends)
Additional Influences
While the core entry criteria follow Minervini's template, this system also incorporates concepts from:
- Stan Weinstein - 4-stage market cycle analysis ("Secrets for Profiting in Bull and Bear Markets")
- William O'Neil - Fundamental screening criteria (CANSLIM methodology)
- IBD Methodology - Relative strength ranking and market regime awareness
Our Implementation
We've automated Minervini's manual screening process with additional enhancements:
- Smooth linear scoring instead of binary pass/fail (reduces false signals)
- Market regime filtering (SPY phase + breadth checks - only buy in healthy markets)
- Automated fundamental screening (growth, profitability, financial health)
- Precise stop-loss calculation (ATR-based + swing lows, max 10% risk)
- R:R validation (only include signals with ≥2:1 reward/risk ratio)
System Architecture
graph TB
    subgraph "Data Layer"
        A[Universe Fetcher<br/>3800+ US Stocks] --> B[Price Fetcher<br/>1 Year OHLCV]
        B --> C[Fundamental Fetcher<br/>Quarterly Financials]
        C --> D[Git Storage<br/>Smart Caching]
    end
subgraph "Analysis Engine"         D --> E[Phase Classifier<br/>4-Stage Trend Analysis]         D --> F[RS Calculator<br/>Smooth Linear Scoring]         D --> G[Fundamental Analyzer<br/>Growth + Quality]
E --> H[Signal Engine]         F --> H         G --> H
H --> I[Buy Signals<br/>Phase 1/2 Breakouts]         H --> J[Sell Signals<br/>Phase 3/4 Breakdowns]     end
subgraph "Risk Management"         I --> K[Stop Loss Calculator<br/>ATR + Swing Lows]         K --> L[R:R Analysis<br/>Min 2:1 Ratio]     end
subgraph "Outputs"         L --> M[Daily Report<br/>Ranked Signals]         J --> M         M --> N[GitHub Actions<br/>Automated Delivery]     end
subgraph "Position Management"         O[Robinhood API<br/>Read-Only] --> P[Position Fetcher]         D --> P         P --> Q[Stop Adjuster<br/>Linear Trailing]         Q --> R[Position Report<br/>Manual Review]     end
style D fill:#e1f5e1     style H fill:#fff4e1     style M fill:#e1f0ff     style R fill:#ffe1f0
Data Flow
- Daily Scan (GitHub Actions, 1 PM UTC M-F):
- Signal Generation:
- Position Management (Manual):
Key Features
✅ Phase-Based Trend Classification
Stocks are classified into 4 phases based on moving average slopes and price position:
- Phase 1 (Base Building): Consolidation after decline. 50/200 SMA flattening, price finding support. NOT YET READY
- Phase 2 (Uptrend): Confirmed uptrend. 50>150>200 SMA (all rising), price above all SMAs. BUY ZONE ⭐
- Phase 3 (Distribution): Topping pattern. SMAs starting to flatten/cross, momentum weakening. SELL ZONE
- Phase 4 (Downtrend): Declining trend. 50 SMA < 200 SMA, both falling, price below both. AVOID
📈 Relative Strength Momentum
- Smooth linear scoring (0-10 scale) vs SPY benchmark
- 63-day RS slope calculation (captures 3-month momentum trend)
- Penalizes underperformance, rewards outperformance
- Crucial filter: only buy stocks beating the market
💰 Fundamental Quality Screening
- Growth: Revenue growth, EPS growth trends
- Profitability: Operating margins, ROE
- Financial Health: Debt ratios, current ratio
- Only applied to Phase 1/2 stocks (Phase 3/4 skip fundamentals - price action is king)
🎯 Risk-Managed Stop Losses
Every buy signal includes:
- Entry price: Current market price or breakout level
- Stop loss: ATR-based or swing low-based
- Risk amount: $ per share risked
- Reward target: 2-3x risk minimum
- R:R ratio: Always ≥ 2:1 for inclusion
🔄 Smart Caching Strategy
- Price data: Always fetch fresh (needed for current signals)
- Fundamentals: Git-based storage with earnings-aware refresh
🤖 Full Automation
- Runs daily via GitHub Actions (1 PM UTC, weekdays only)
- No manual intervention required
- Results committed to repository (full history)
- Adaptable to market conditions (skips buy signals in weak markets)
Design Philosophy
1. Cache-First, API-Second
Rationale: yfinance has strict rate limits (~2 req/sec). Scanning 3,800 stocks requires 3,800+ API calls. At 1 TPS, that's 63 minutes. But fundamentals change slowly (quarterly earnings), so why re-fetch every day?
Solution:
- Store fundamentals in Git repository as JSON files
- Add metadata with
fetched_attimestamp - During scan: Check if cache exists and is fresh
- Only fetch if stale or missing
- Result: 1,762 cached stocks = 74% fewer API calls = 15-20 min faster scans
2. Confirmed Uptrends Only (Minervini's Stage 2)
Rationale: Traditional screeners look for "cheap" stocks (low P/E) or early bases (Phase 1). But cheap stocks can get cheaper, and bases can fail. Minervini only buys confirmed Stage 2 uptrends.
Solution:
- Classify stocks into 4 phases based on SMA slopes and price position
- Only buy Phase 2 (confirmed uptrends with 50>150>200 SMA alignment)
- Reject Phase 1 (still basing, not confirmed)
- Only sell Phase 2 → 3/4 transitions (breakdowns from tops)
- This filters out 70%+ of stocks immediately, leaving only the highest-quality setups
3. Relative Strength as Primary Filter
Rationale: Absolute returns don't matter - relative returns do. A stock up 5% when SPY is up 10% is actually underperforming. Market leaders (high RS) tend to continue leading.
Solution:
- Calculate 63-day RS slope (3-month trend)
- Smooth linear scoring (not bucket-based)
- 10 points max for RS in buy signal scoring
- Filters out weak stocks even if other metrics look good
4. Linear Formulas Over Buckets
Rationale: Bucket-based scoring (e.g., "P/E < 15 = 10 points, P/E 15-20 = 5 points") creates artificial cliffs. A stock with P/E 14.9 and P/E 15.1 shouldn't have a 5-point difference.
Solution:
- All scoring uses linear interpolation
- Example: RS slope scoring scales smoothly from -0.3 (0 points) to +0.3 (10 points)
- Stop loss trailing scales linearly with gain % (5% gain → lock 1% profit, 40% gain → lock 18% profit)
- Result: Smoother, more reasonable scoring
5. Market Regime Awareness
Rationale: Buy signals in a bear market (SPY in Phase 4) have low win rates. Why generate signals that are likely to fail?
Solution:
- Classify SPY phase before generating signals
- Calculate market breadth (% stocks in Phase 2)
- Only generate buy signals if:
- Sell signals always generated (can exit in any market)
6. Read-Only Position Management
Rationale: Executing trades programmatically is risky and requires extensive safeguards. But analyzing positions and recommending adjustments can be automated safely.
Solution:
- Robinhood integration is read-only (only fetches positions)
- Never calls trading functions (no
orderbuy,ordersell) - Position manager recommends stop adjustments
- Human executes trades manually on Robinhood app
- Best of both worlds: automation + human oversight
Quick Start
Prerequisites
- Python 3.13+
- GitHub account (for automation)
- Robinhood account (optional, for position management)
Installation
# Clone repository
git clone https://github.com/RyanJHamby/stock-screener.git
cd stock-screener
Create virtual environment
python -m venv venv
source venv/bin/activate  # On Windows: venv\Scripts\activate
Install dependencies
pip install -r requirements.txt
(Optional) Install robin-stocks for position management
pip install robin-stocks
Configuration
# Copy environment template
cp .env.example .env
Edit .env (only needed for manual position management)
Add: ROBINHOODUSERNAME=youremail@example.com
Run Your First Scan
# Test mode: Scan 100 stocks to verify setup
python runoptimizedscan.py --test-mode
Full scan: All 3,800+ stocks (30-40 minutes)
python runoptimizedscan.py --conservative
View Results
# Latest scan results
cat data/dailyscans/latestoptimized_scan.txt
All historical scans
ls -l data/daily_scans/
Daily Workflow
Automated Mode (GitHub Actions)
The system runs automatically every weekday at 1 PM UTC (9 AM EST):
- Scan triggers via GitHub Actions schedule
- Fetches universe of 3,800+ US stocks
- Downloads price data for all stocks
- Loads cached fundamentals (or fetches if stale)
- Classifies phases and calculates RS
- Generates signals based on market regime
- Saves report to
data/dailyscans/latestoptimized_scan.txt - Commits results to repository
- Daily email/Slack notification (if configured)
- Ranked buy signals with stop losses
- Ranked sell signals with breakdown levels
- Market regime analysis (SPY phase + breadth)
Manual Mode (Local)
Run on-demand scans:
# Conservative scan (2 workers, 1.0s delay = ~2 TPS)
python runoptimizedscan.py --conservative
Default scan (3 workers, 0.5s delay = ~6 TPS)
python runoptimizedscan.py
Aggressive scan (5 workers, 0.3s delay = ~17 TPS) - MAY HIT RATE LIMITS
python runoptimizedscan.py --aggressive
Resume from interruption
python runoptimizedscan.py --resume
Clear cached progress and start fresh
python runoptimizedscan.py --clear-progress
Manual Position Management
⚠️ Note: Position management requires manual execution. This is intentional for safety.
Step 1: Ensure Robinhood Username is Set
In your .env file:
ROBINHOODUSERNAME=youremail@example.comImportant: Password is NEVER stored. You will be prompted interactively.
Step 2: Run Position Manager
# Basic analysis (prompts for password + SMS MFA)
python manage_positions.py
With entry dates for tax-aware recommendations
python managepositions.py --entry-dates entrydates.json
Export report to file
python manage_positions.py --export
Step 3: Interactive Authentication
Logging in to Robinhood...
Robinhood password for you@example.com:
MFA required - check your phone for SMS code from Robinhood Enter SMS code from Robinhood: 123456
✓ Robinhood login successful with SMS MFA
Step 4: Review Recommendations
The tool will:
- Fetch your current positions from Robinhood
- Analyze each using cached market data (zero extra API calls)
- Calculate phase, SMA levels, recent swing lows
- Recommend stop loss adjustments using linear formulas
Example Output
================================================================================
POSITION MANAGEMENT REPORT - STOP LOSS RECOMMENDATIONS
Generated: 2025-12-06 10:30:15
================================================================================
PORTFOLIO SUMMARY  Total Positions: 3 Need Stop Adjustment: 2 Short-term (<1 year): 2 Long-term (1+ years): 1 Average Gain: +8.47%
⚠️  URGENT ACTIONS NEEDED
NVDA (+10.10%)   • Big winner - consider taking partial profits
================================================================================
################################################################################ POSITION #1: AAPL ################################################################################ Entry: $175.50 | Current: $182.30 | Gain: +3.87% Tax Treatment: SHORT_TERM Days Held: 45
ACTION: HOLD
RATIONALE: Position up 3.9% - hold initial stop. Wait for 5-10% gain before adjusting.
Technical: Phase 2 | 50 SMA: $178.20
################################################################################
POSITION #2: NVDA ################################################################################ Entry: $495.00 | Current: $545.00 | Gain: +10.10% Tax Treatment: SHORT_TERM Days Held: 20
ACTION: TRAIL TO PROFIT
✓ RECOMMENDED STOP LOSS: $519.75
RATIONALE: Position up 10.1% - TRAIL TO PROFIT
NEW STOP LOSS: $519.75     • Locks in minimum +5.0% profit     • Stop type: profit-based
Technical: Phase 2 | 50 SMA: $512.30
################################################################################
POSITION #3: MSFT ################################################################################ Entry: $380.00 | Current: $385.50 | Gain: +1.45% Tax Treatment: LONG_TERM Days Held: 400
ACTION: HOLD
RATIONALE: LONG-TERM HOLD (400 days) - Preserve long-term capital gains tax rate. No stop adjustment recommended.
================================================================================
Stop Loss Logic
Recommendations use linear formulas (not buckets):
| Gain Range | Recommendation | Stop Level | |------------|----------------|------------| | 0-5% | Hold initial stop | Original stop | | 5-10% | Trail to breakeven | Entry price | | 10-20% | Trail to profit | Entry × (1 + lockedprofitpct/100) | | 20-30% | Take 25-30% partial | Remaining at +10% profit | | 30%+ | Take 50% partial | Remaining at tight trail |
Locked profit % formula:
lockedprofitpct = min(gainpct - 3, gainpct * 0.5)Examples:
- 5% gain → Lock 2% profit
- 10% gain → Lock 3.5% profit
- 20% gain → Lock 8.5% profit
- 40% gain → Lock 18.5% profit
Tax-Aware Filtering
Long-term positions (365+ days held) are excluded from stop adjustments to preserve favorable capital gains tax treatment (15-20% vs ordinary income rate).
To enable:
- Create
entry_dates.json:
{
  "AAPL": "2024-10-18T00:00:00",
  "NVDA": "2024-11-13T00:00:00",
  "MSFT": "2023-05-10T00:00:00"
}- Run with
--entry-dates:
python managepositions.py --entry-dates entrydates.jsonProject Structure
stock-screener/
├── .github/
│   └── workflows/
│       └── dailyscreeninggit_storage.yml  # Automated daily scan
│
├── src/                                # Core library
│   ├── data/
│   │   ├── fetcher.py                  # YahooFinanceFetcher (price data)
│   │   ├── fundamentals_fetcher.py     # Quarterly financials fetcher
│   │   ├── gitstoragefetcher.py      # Smart cache (74% API reduction)
│   │   ├── enhanced_fundamentals.py    # FMP integration (optional)
│   │   ├── universe_fetcher.py         # NASDAQ/NYSE stock universe
│   │   └── robinhood_positions.py      # Robinhood read-only API
│   ├── screening/
│   │   ├── phase_indicators.py         # 4-phase classification
│   │   ├── signal_engine.py            # Buy/sell signal scoring
│   │   ├── benchmark.py                # SPY analysis + market breadth
│   │   └── optimizedbatchprocessor.py
│   └── analysis/
│       └── position_manager.py         # Stop loss recommendations
│
├── tests/                              # Test suite
├── examples/                           # Demo scripts and sample configs
├── scripts/                            # Utility runners and shell scripts
├── assets/                             # Screenshots and images
├── docs/                               # Extended documentation
│
├── data/
│   ├── fundamentals_cache/             # Git-tracked fundamentals (1,762 stocks)
│   ├── daily_scans/                    # Historical scan reports
│   └── position_reports/               # Position management reports
│
├── runoptimizedscan.py               # Main scanner CLI
├── manage_positions.py                 # Position management CLI
├── automatedpositionreport.py        # GitHub Actions position report
├── run_screen.sh                       # Convenience wrapper (full scan)
├── run_test.sh                         # Convenience wrapper (test scan)
│
├── config.yaml                         # Scan configuration
├── requirements.txt
├── README.md
├── CHANGELOG.md
├── CONTRIBUTING.md
└── LICENSE
Technical Details
Phase Classification Algorithm
def classifyphase(pricedata: pd.DataFrame, current_price: float) -> Dict:
    """
    Classifies stock into 4 phases based on SMA slopes and price position.
Returns:         {             'phase': int (1-4),             'phase_name': str,             'confidence': float (0-100),             'sma_50': float,             'sma_200': float,             'slope_50': float (annualized),             'slope_200': float (annualized),             'reasons': List[str]         }     """
Logic:
- Calculate 50-day and 200-day SMAs
- Calculate slopes (annualized % change rate)
- Classify phase based on:
- Return phase with confidence score
Relative Strength Calculation
def calculaterelativestrength(
    stock_prices: pd.Series,
    spy_prices: pd.Series,
    period: int = 63
) -> pd.Series:
    """
    Calculates smooth RS using linear regression slope.
Args:         stock_prices: Stock close prices         spy_prices: SPY close prices (benchmark)         period: Lookback window (63 days = 3 months)
Returns:         Series of RS slopes (annualized)     """
Formula:
RSratio = stockreturn / spy_return RSslope = linearregressionslope(RSratio, period) RSscore = clip((RSslope + 0.3) / 0.6 * 10, 0, 10)Interpretation:
- RS slope +0.3 = 10 points (strong outperformance)
- RS slope 0.0 = 5 points (matching market)
- RS slope -0.3 = 0 points (strong underperformance)
Buy Signal Scoring (110 points max)
| Component | Max Points | Criteria | |-----------|------------|----------| | Phase | 30 | Phase 2 = 30, Phase 1 = 20 | | RS Momentum | 10 | Linear scale from RS slope | | Volume | 10 | Breakout on high volume | | Proximity to Breakout | 10 | Close to resistance level | | Fundamentals | 50 | Growth (20) + Profitability (15) + Health (15) |
Threshold: Buy signal score ≥ 70 for inclusion in report.
Sell Signal Scoring (110 points max)
| Component | Max Points | Criteria | |-----------|------------|----------| | Phase | 30 | Phase 4 = 30, Phase 3 = 20 | | RS Momentum | 10 | Negative RS (underperformance) | | Volume | 10 | Breakdown on high volume | | SMA Breakdown | 15 | Broke below 50/200 SMA | | Price Action | 15 | Lower highs, lower lows | | Severity | 30 | Combination of above factors |
Threshold: Sell signal score ≥ 60 for inclusion in report.
Stop Loss Calculation
def calculatestoploss(
    entry_price: float,
    price_data: pd.DataFrame,
    atr_period: int = 14,
    atr_multiplier: float = 2.0
) -> Dict:
    """
    Calculates stop loss using ATR or swing lows.
Returns:         {             'stop_price': float,             'risk_amount': float,             'stoptype': str ('atr' or 'swinglow')         }     """
Method 1: ATR-Based
ATR = Average True Range (14 days) Stop = Entry - (ATR × 2.0)Method 2: Swing Low-Based
Swing_Low = Lowest low in last 20 days Stop = Swing_Low × 0.98 (2% buffer)Uses whichever is higher (more conservative).
Risk/Reward Validation
Every buy signal calculates:
risk = entryprice - stoploss reward = (entryprice × 1.20) - entryprice # 20% target rrratio = reward / riskFilter: Only include signals with R:R ≥ 2:1.
Future Improvements
Short-Term (Next 3 Months)
- [ ] Backtesting Engine
- [ ] Enhanced Reporting
- [ ] Smart Alerts
Medium-Term (3-6 Months)
- [ ] Multi-Timeframe Analysis
- [ ] Sector Rotation
- [ ] Options Integration
- [ ] Paper Trading
Long-Term (6-12 Months)
- [ ] Machine Learning Enhancement
- [ ] Alternative Data Sources
- [ ] Portfolio Construction
- [ ] Execution Optimization
Infrastructure
- [ ] Database Migration
- [ ] Real-Time Data
- [ ] Web UI
Contributing
This project is currently a personal trading system. If you'd like to contribute:
- Fork the repository
- Create a feature branch (
git checkout -b feature/amazing-feature) - Make your changes with tests
- Commit (
git commit -m 'Add amazing feature') - Push (
git push origin feature/amazing-feature) - Open a Pull Request
- Python 3.13+
- Type hints required
- Docstrings for all public functions
- Black code formatting
- pytest for tests (>80% coverage)
License
MIT License - See LICENSE file for details.
Disclaimer
This system is for educational and informational purposes only.
- Not financial advice
- Past performance does not guarantee future results
- Trading stocks involves risk of loss
- Always do your own research
- Never invest more than you can afford to lose
- Consult a licensed financial advisor before making investment decisions
Contact
Ryan Hamby GitHub: github.com/RyanJHamby LinkedIn: linkedin.com/in/ryanhamby
Built with Python, powered by data, driven by discipline.


