
JavaScript diagramming library for interactive flowcharts, org charts, design tools, planning tools, visual languages.
GoJS, a JavaScript Library for HTML Diagrams

GoJS is a JavaScript and TypeScript library for creating and manipulating diagrams, charts, and graphs.





GoJS is a flexible library that can be used to create a number of different kinds of interactive diagrams, including data visualizations, drawing tools, and graph editors. There are samples for flowchart, org chart, business process BPMN, swimlanes, timelines, state charts, kanban, network, mindmap, sankey, family trees and genogram charts, fishbone diagrams, floor plans, UML, decision trees, PERT charts, Gantt, and hundreds more. GoJS includes a number of built in layouts including tree layout, force directed, circular, and layered digraph layout, and many custom layout extensions and examples.
GoJS is renders either to an HTML Canvas element (with export to SVG or image formats) or directly as SVG DOM. GoJS can run in a web browser, or server side in Node or Puppeteer. GoJS Diagrams are backed by Models, with saving and loading typically via JSON-formatted text.
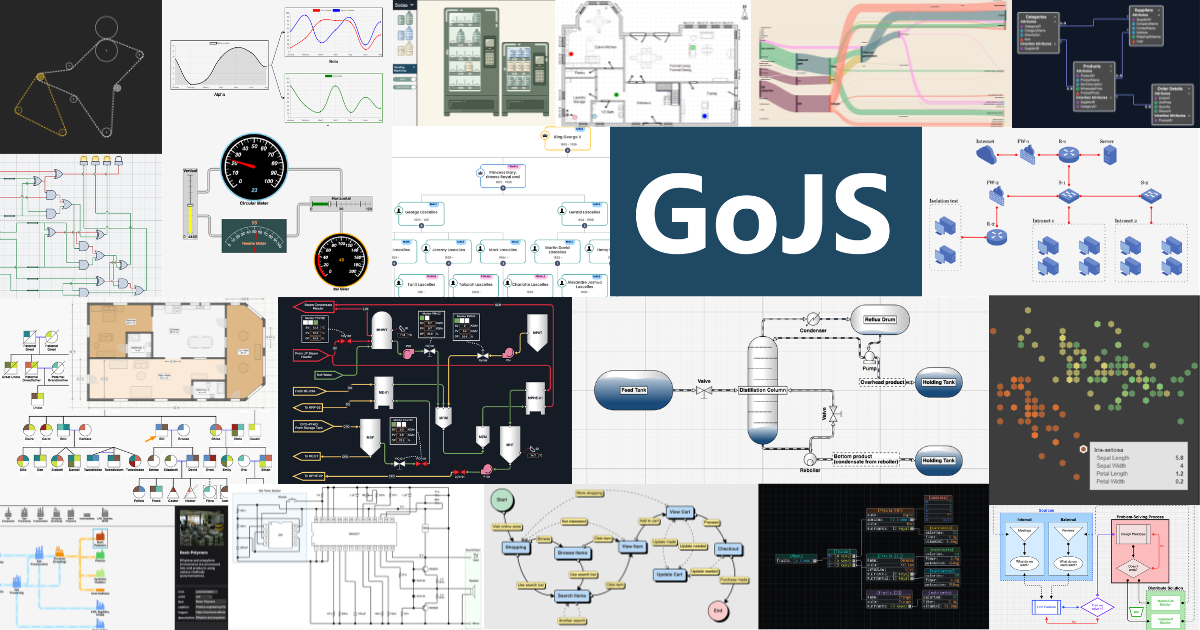
Read more about GoJS at gojs.net
The GitHub repository and the GoJS website contain not only the library, but also the sources for all samples, extensions, and documentation.
However the npm package contains only the library. You can install the GoJS library using npm:
$ npm install gojsThe samples, extensions, and documentation can be installed by running:
$ npm create gojs-kitYou can use the GitHub repository to quickly search through all of the sources.
Minimal Sample
Diagrams are built by creating one or more templates, with desired properties data-bound, and adding model data.
<div id="myDiagramDiv" style="width:400px; height:200px;"></div>The above diagram and model code creates the following graph. The user can now click on nodes or links to select them, copy-and-paste them, drag them, delete them, scroll, pan, and zoom, with a mouse or with fingers.
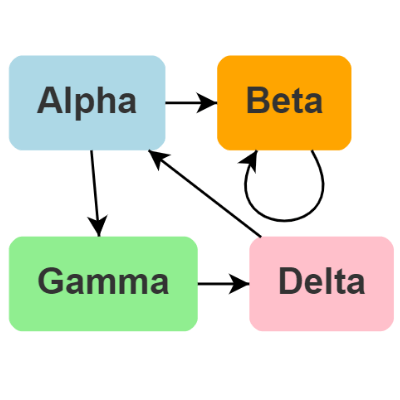
Click the above image to see the interactive GoJS Diagram
Support
Northwoods Software offers a month of free developer-to-developer support for GoJS to prospective customers so you can finish your project faster.
Read and search the official GoJS forum for any topics related to your questions.
Posting in the forum is the fastest and most effective way of obtaining support for any GoJS related inquiries. Please register for support at Northwoods Software's registration form before posting in the forum.
For any nontechnical questions about GoJS, such as about sales or licensing, please visit Northwoods Software's contact form.
License
The GoJS software license.
The GoJS evaluation license.
Copyright Northwoods Software Corporation


