
EDA and comparative analysis of machine learning models for predicting NIFTY50 stock trends using Python.
NIFTY50 Prediction using EDA and Machine Learning
Overview
This project focuses on analyzing historical NIFTY50 stock market data using Exploratory Data Analysis (EDA) and building machine learning models to predict market trends. It includes a comparative study of multiple models to evaluate their effectiveness in financial prediction.
Problem Statement
Stock market prediction is inherently complex due to volatility, noise, and multiple influencing factors. The objective of this project is to extract meaningful insights from NIFTY50 data and compare machine learning models to improve predictive understanding.
Objectives
- Perform data cleaning and preprocessing
- Conduct exploratory data analysis to identify trends and patterns
- Engineer relevant features for modeling
- Build and compare multiple machine learning models
- Evaluate model performance using standard metrics
Dataset
The dataset consists of historical NIFTY50 stock data containing features such as opening price, closing price, high, low, and trading volume.
Location: data/final_dataset.xlsx
Project Structure
.
├── data/
│   └── final_dataset.xlsx
├── notebooks/
│   └── NIFTY50MLPrediction.ipynb
├── outputs/
│   ├── dailymarketmovement.png
│   ├── yearlyavgclosing.png
│   ├── monthlyavgclosing.png
│   ├── correlation_heatmap.png
│   ├── model_comparison.png
│   └── ...
├── requirements.txt
└── README.md
Methodology
1. Data Preprocessing
- Handling missing values
- Converting date columns
- Sorting and structuring time-series data
2. Exploratory Data Analysis
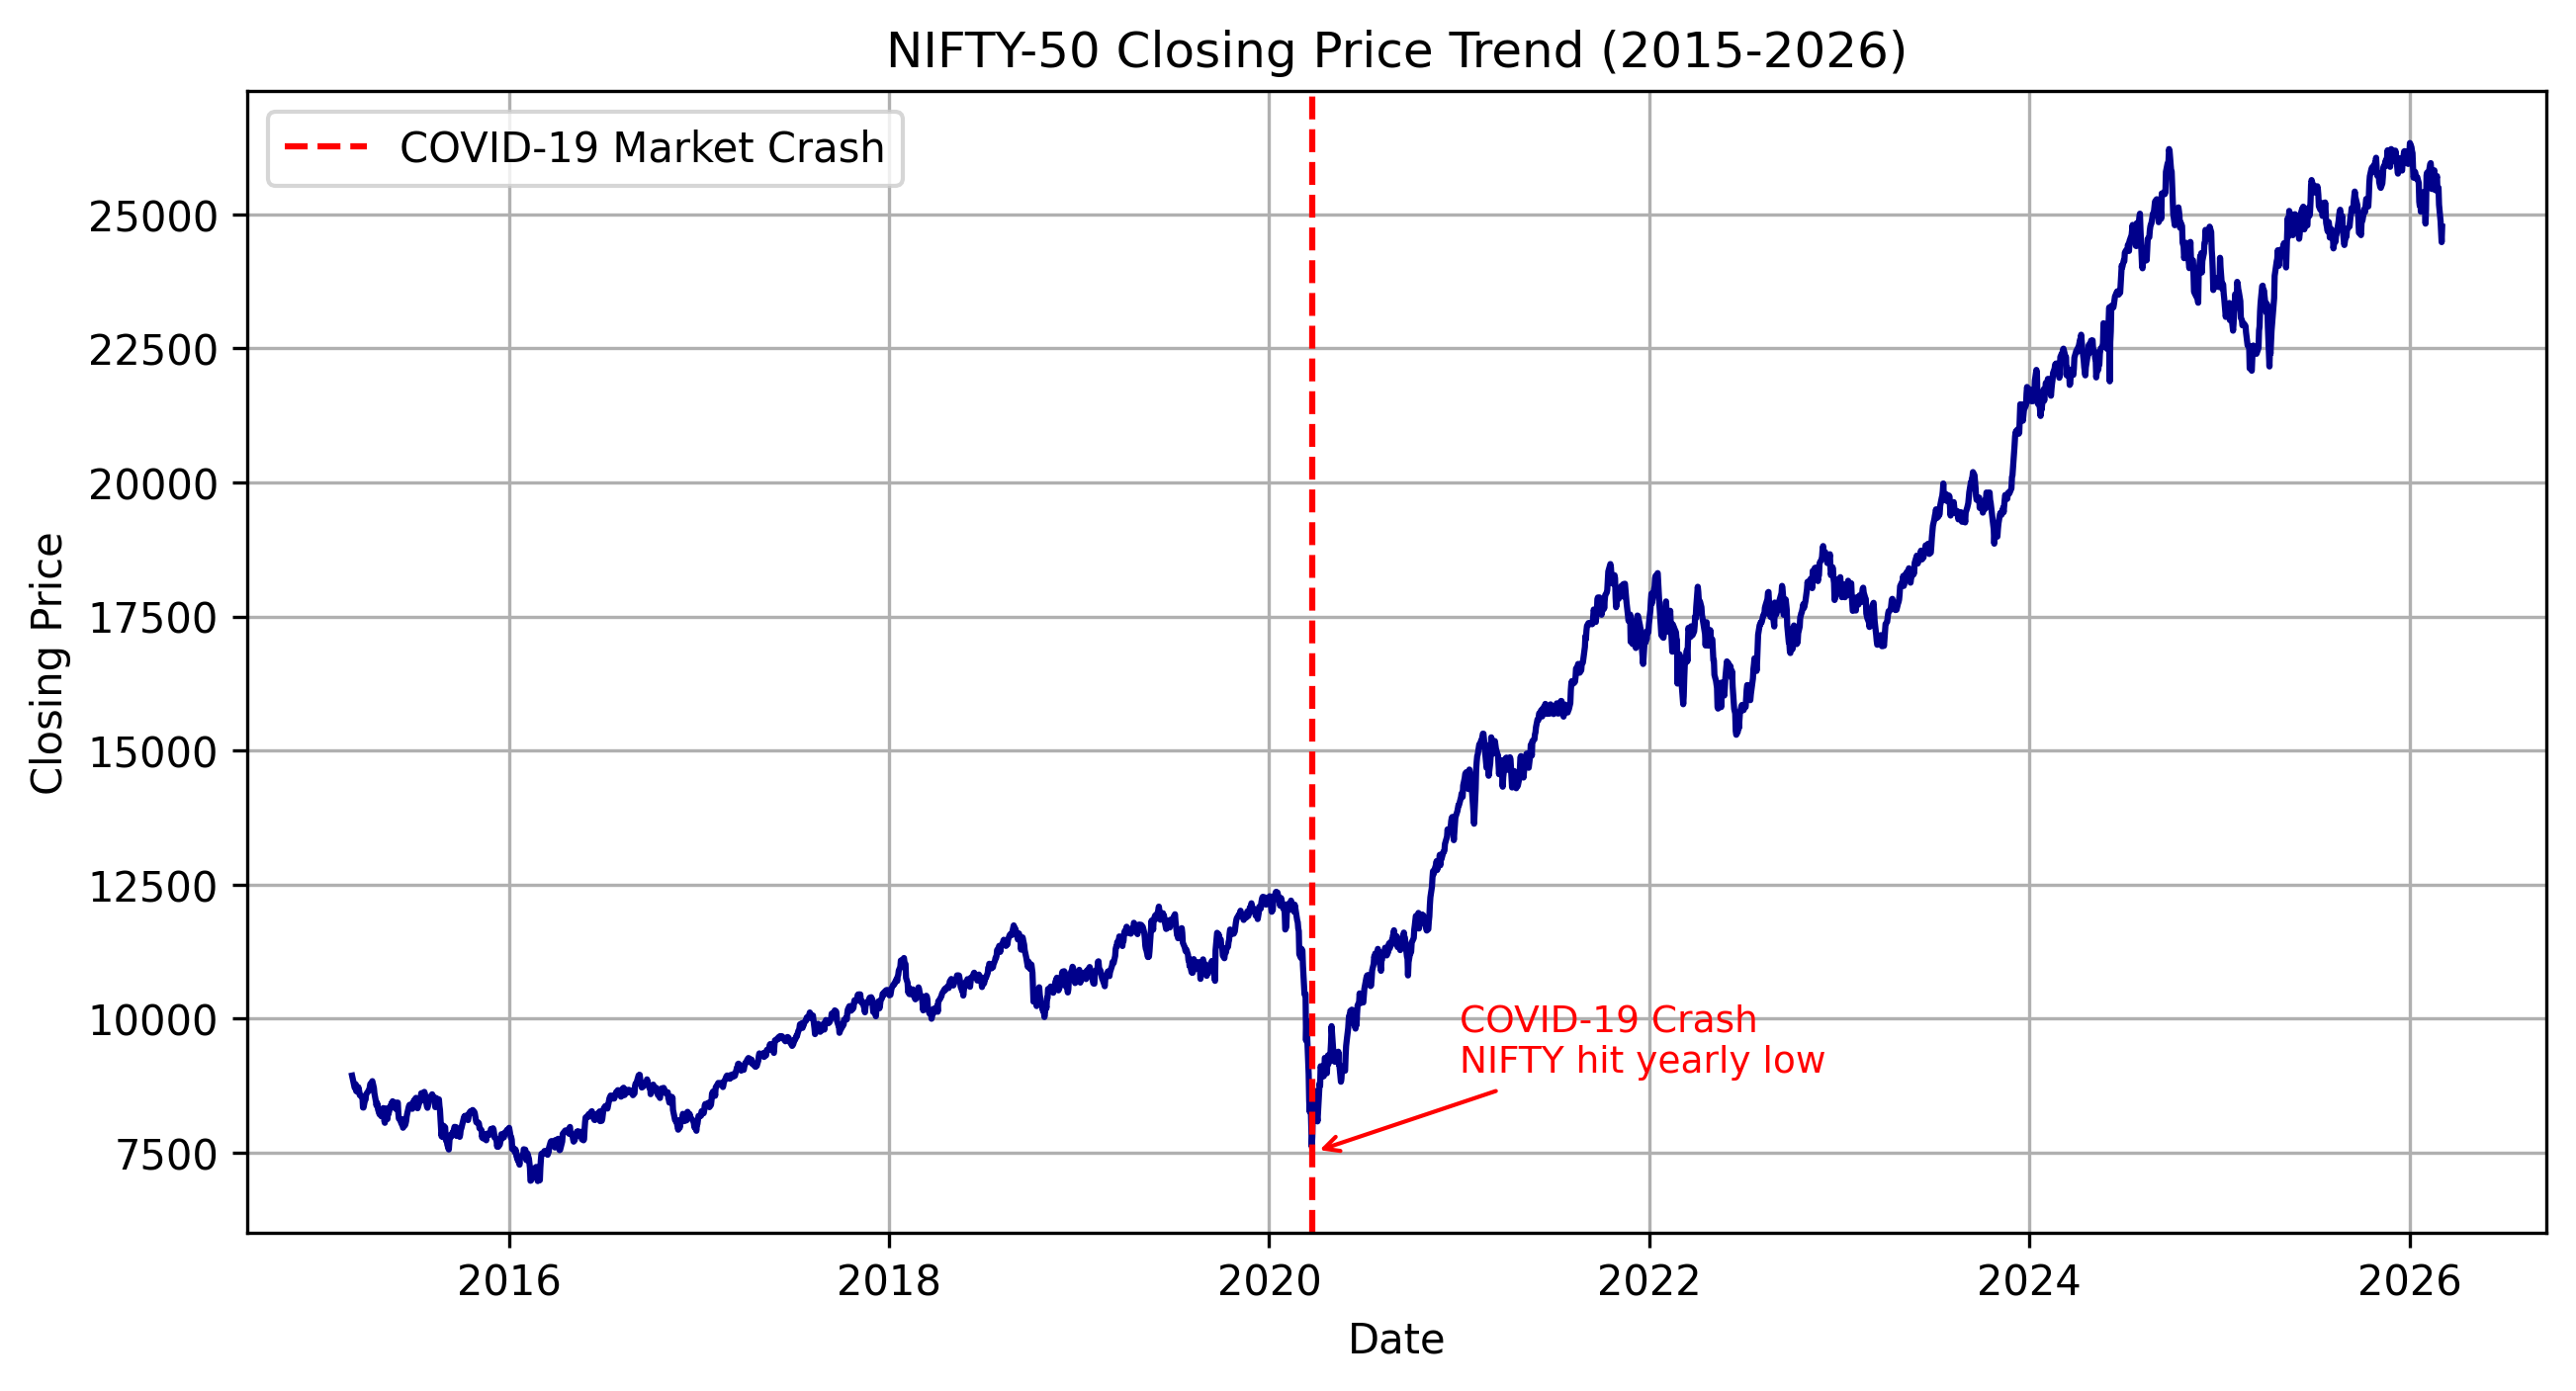
- Trend analysis of NIFTY50 over time
- Monthly and yearly average comparisons
- Distribution of closing prices
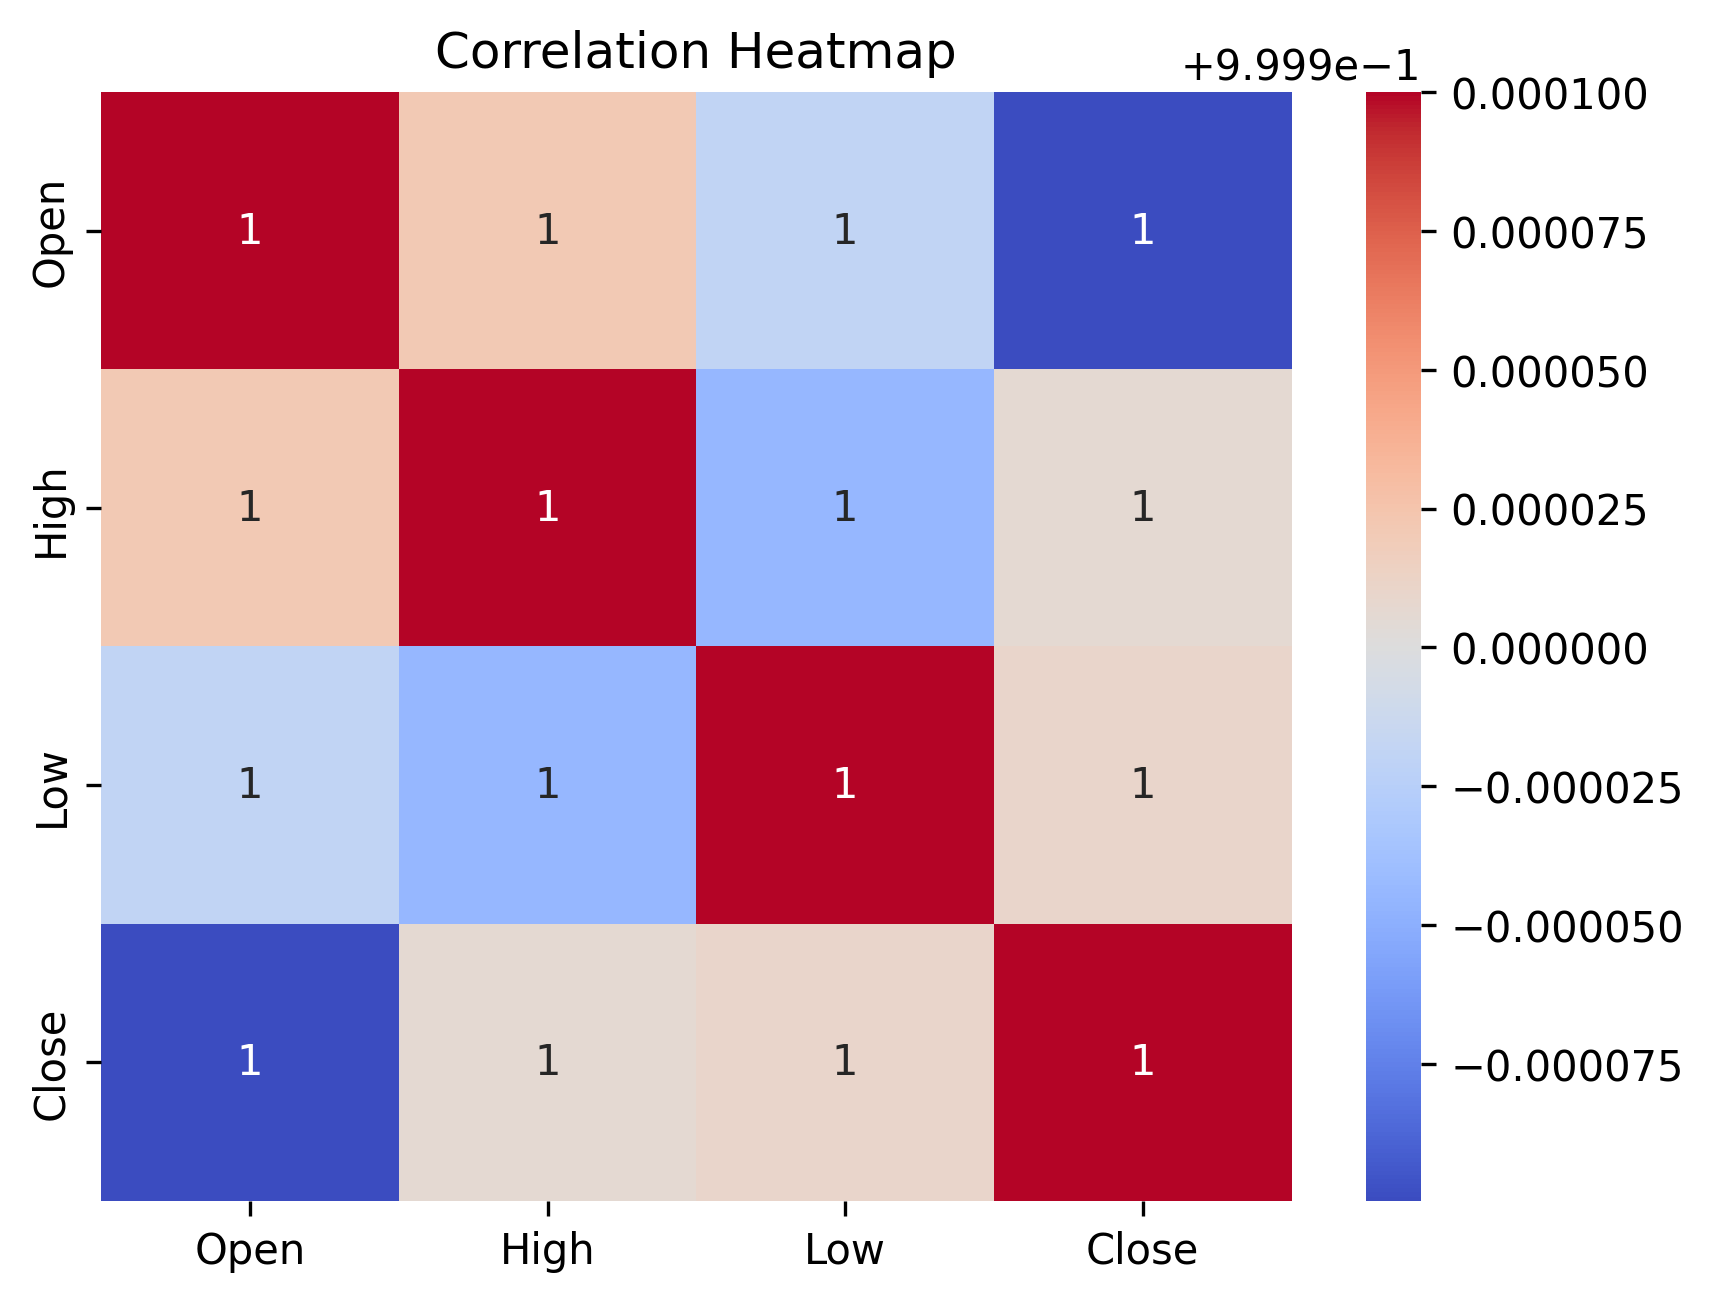
- Correlation analysis between features
3. Feature Engineering
- Extraction of year and month
- Daily price change calculation
- Derived statistical features
4. Model Building
The following machine learning models were implemented:
- Linear Regression
- Decision Tree Regressor
5. Model Evaluation
Models were evaluated using standard regression metrics such as error comparison and trend consistency.
Model Performance
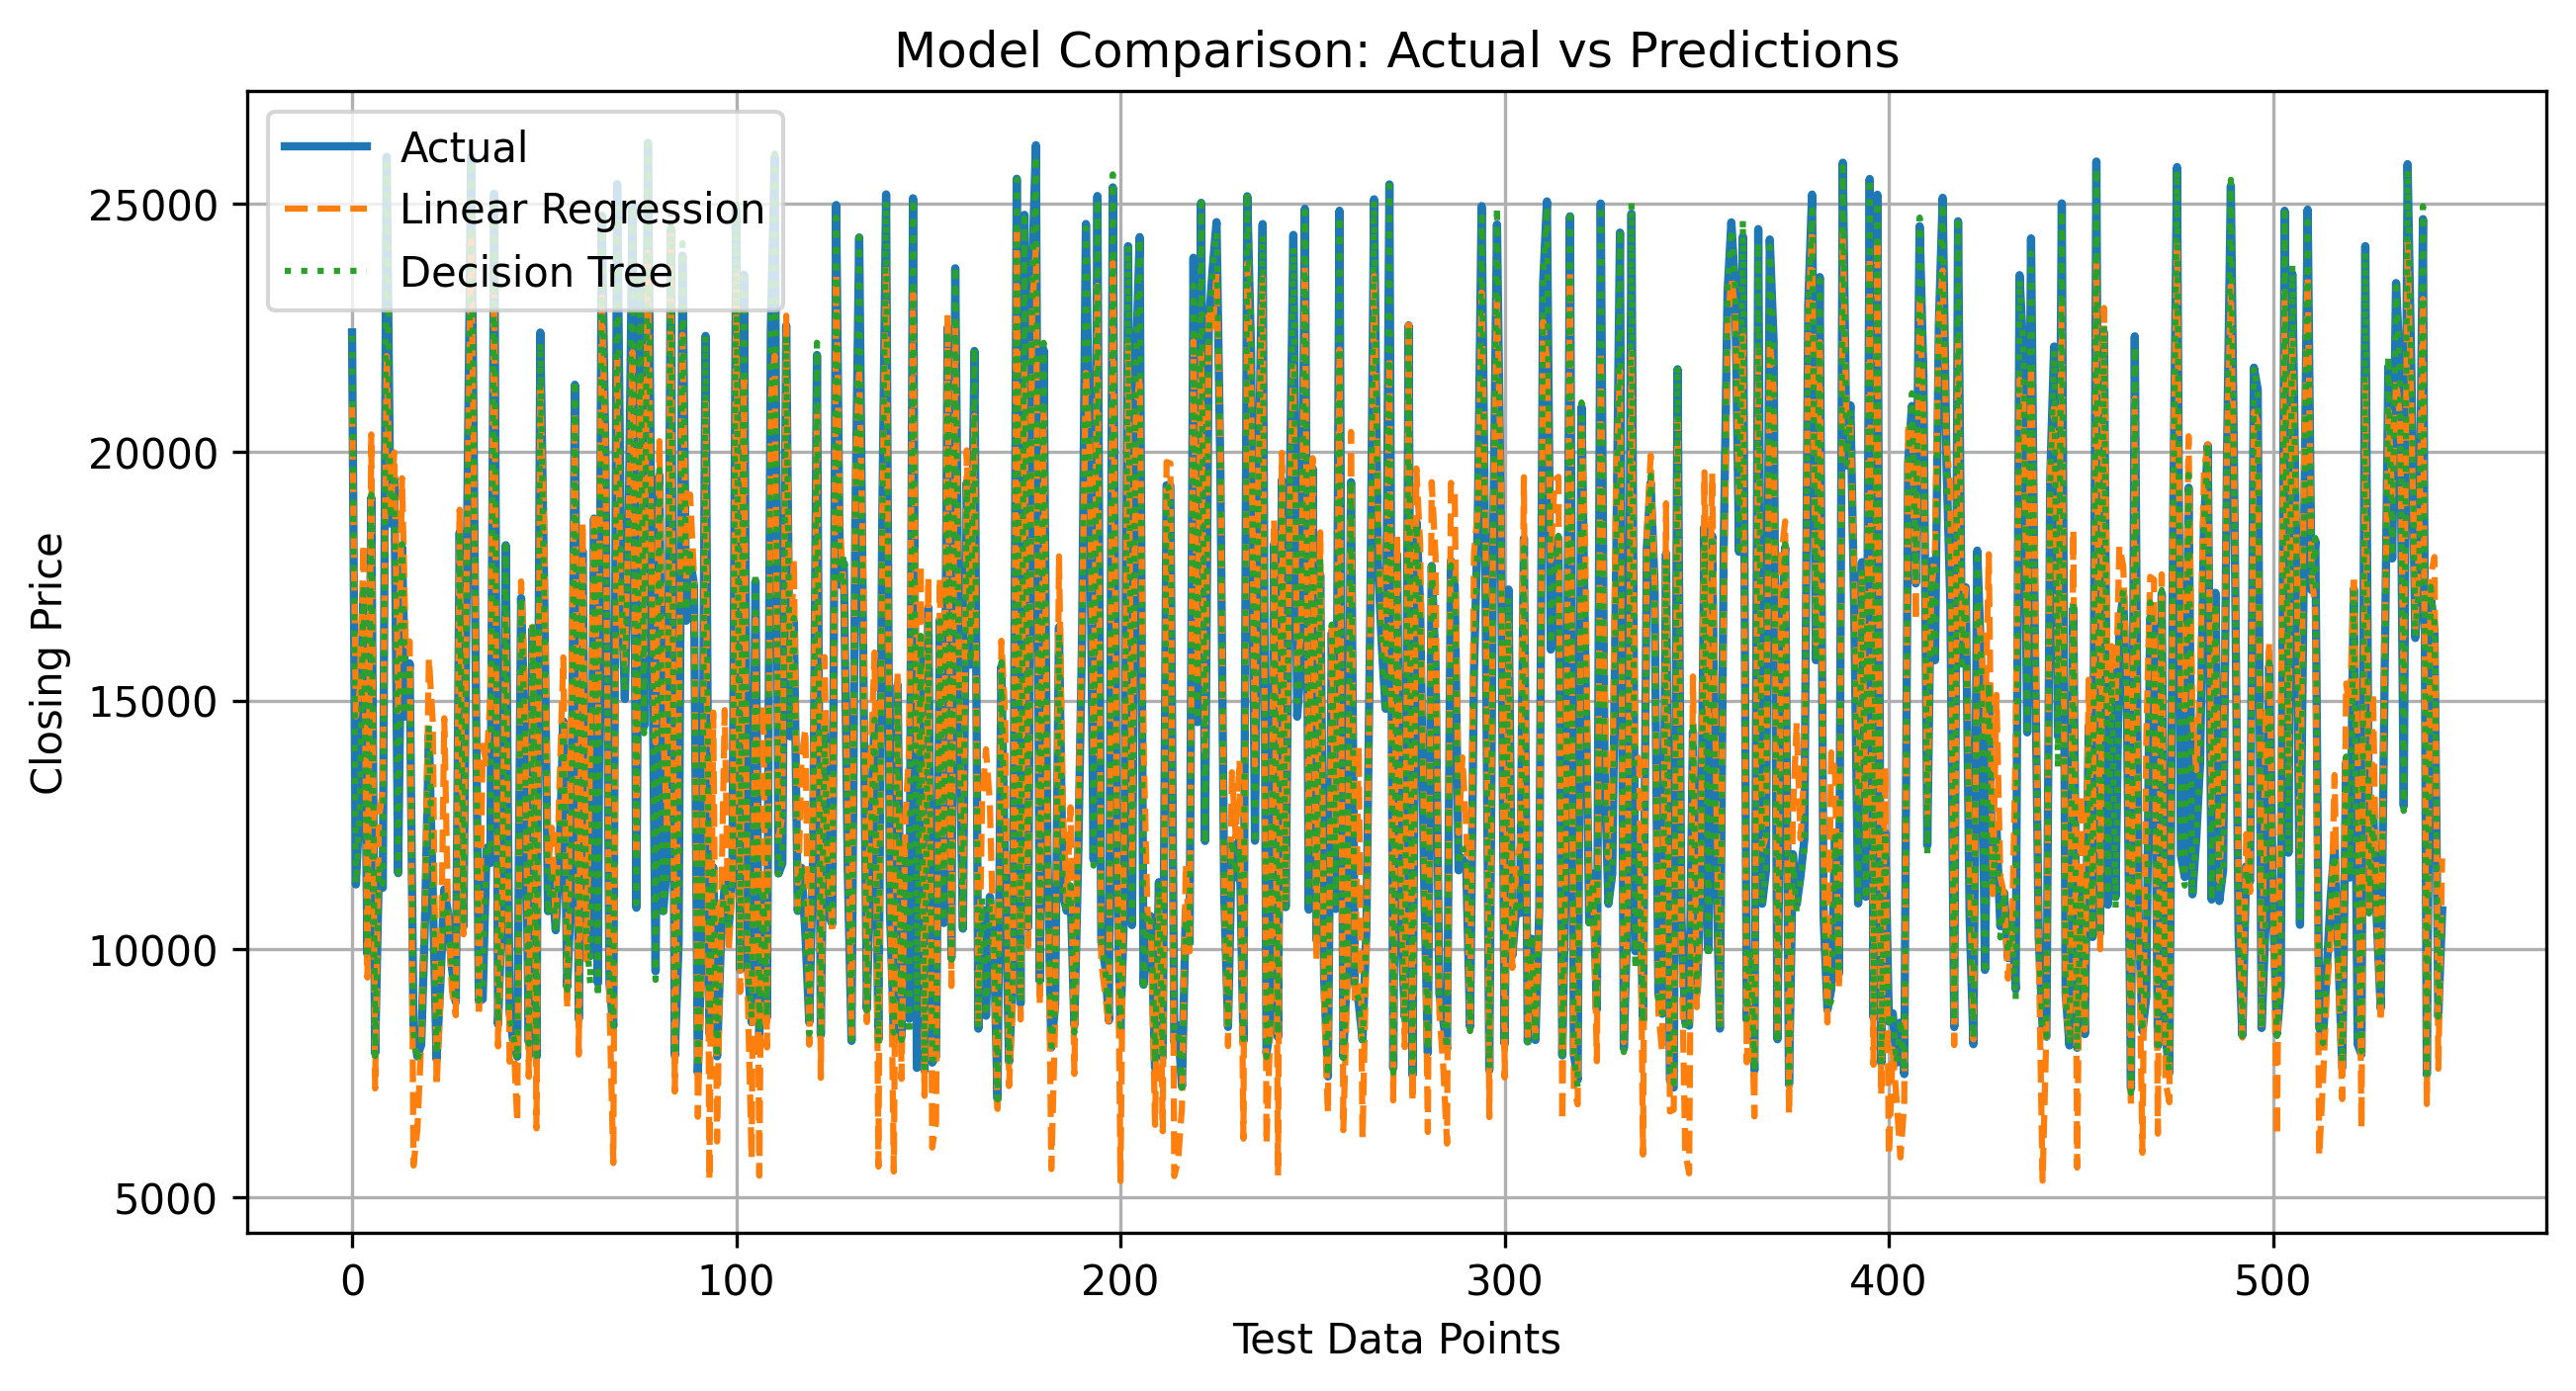
| Model | Observation | | ----------------- | ---------------------------------------------------------------------------- | | Linear Regression | Provides a stable baseline with limited ability to capture non-linear trends | | Decision Tree | Captures patterns better but prone to overfitting | |
Visual Analysis
Market Trend
Correlation Heatmap
Model Comparison
Price Distribution

Visual Insights
Key visualizations highlighting market trends, correlations, model performance and other important are included in the outputs folder and explained in detail within the notebook.How to Run
- Clone the repository
- Navigate to the project folder
- Install required libraries
- Run the notebook
Requirements
- Python 3.x
- pandas
- numpy
- matplotlib
- seaborn
- scikit-learn
- openpyxl
Results and Insights
- Identified key trends and seasonal patterns in NIFTY50
- Observed correlations between price-related features
- Demonstrated the effectiveness of combining EDA with machine learning
Future Work
- Hyperparameter tuning for improved accuracy
- Implementation of advanced models such as XGBoost and LSTM
- Deployment as a real-time prediction system
Research Reference
This project is based on the research work titled: "Exploratory Data Analysis and Comparative Study of Machine Learning Models for NIFTY50 Prediction"
Author
Mandeep Kumar Roshan


