
Data pipeline to extract and provide Brazil inflation data
Brazil Inflation Data Model
This project aims to create a data model to store the inflation data from the Brazilian Institute of Geography and Statistics (IBGE) API.
Table of Contents:
- Brazil Inflation - Data Source - Data Model - Usages - Data Engineering - Technologies Used - How to run - Prerequisites - Running the projectBrazil Inflation
Brazil historically has a traumatic inflation history. The country has faced hyperinflation in the past, with inflation rates reaching 81.3% in March 1990.
Nowadays, the inflation rate is under control, but it is still a relevant economic indicator.
The inflation rate is calculated by the National Consumer Price Index (IPCA), which is released monthly by the Brazilian Institute of Geography and Statistics (IBGE).
The IPCA is calculated based on the prices of a basket of goods and services consumed by Brazilian families.
Data Source
The data source is the IPCA API from the Brazilian Institute of Geography and Statistics (IBGE).
For API details, check the API documentation.
Data Model
The data model is composed of 4 tables.
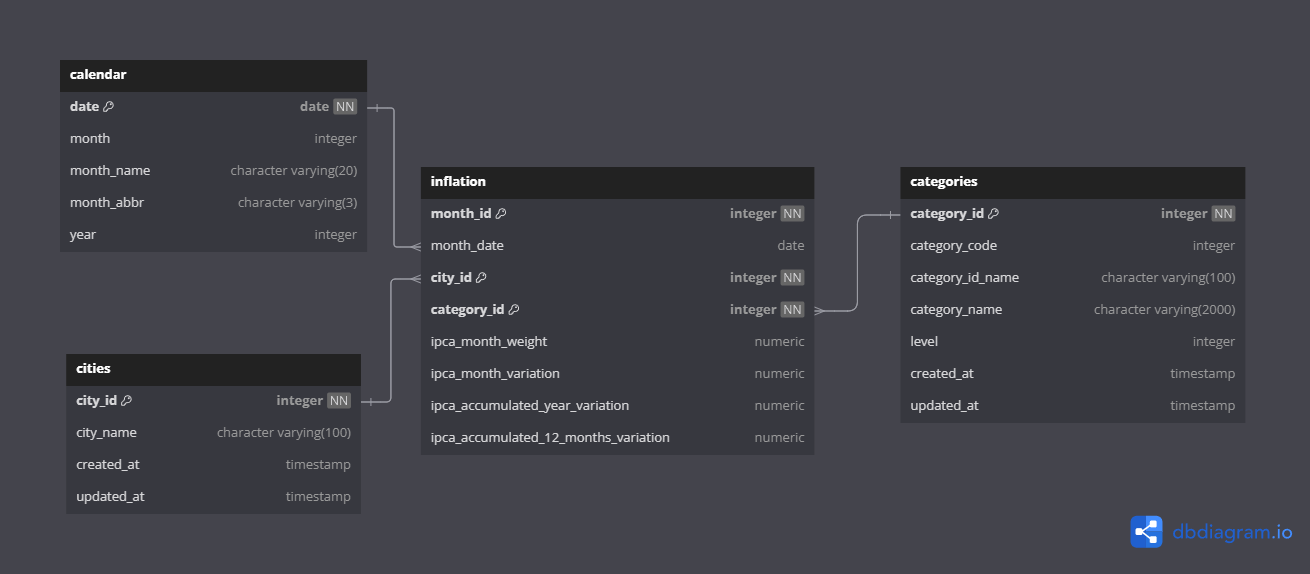
inflationis the fact table with inflation datacitiesis a dimension table with the cities where the inflation data was collectedcategoriesis a dimension table with the categories of products and servicescalendaris a dimension table with the dates of the inflation data
Usages
The data is ready to be used in any data analysis tool, such as Power BI or Python.
For example, from this query:
select
    cal.month_abbr || '/' || cal.year as month,
    i.ipcaaccumulated12monthsvariation as value
from
    inflation i
join categories cat
        using (category_id)
join cities cit
        using (city_id)
join calendar cal on
    cal."date" = i.month_date
where
    cat."level" = 0
    and cit.city_name = 'São Paulo'
    and i.ipcaaccumulated12monthsvariation is not null
The following graph can be generated, to show the inflation rate 12 months accumulated value for São Paulo city:

Data Engineering
This project is a good example of API data ingestion framework.
Read more in the Data Engineering documentation for details on the data pipeline.
Technologies Used
for infrastructure and containerization
for data storage
for data processing
for data pipeline orchestration
How to run
Prerequisites
This project uses Docker to run the PostgreSQL database and Airflow services.Install Docker Desktop for your OS and make sure it is running.
- Optional: Python
- Optional: DBeaver
Running the project
- Clone the repository:
git clone https://github.com/IsmaelMiranda11/inflation-data-model.git- Run
docker composein the root directory of the project:
cd path/where/you/cloned/the/repo
docker compose up -d
- Access the Airflow UI in your browser at port
8980:
http://localhost:8980Note: user: admin, password: admin
- Access the PostgreSQL database with your favorite database client at port
5432:
Host: localhost
Port: 5432
Database: postgres
User: postgres
Password: postgres123


