
Everything is Linkable
linkET
The goal of linkET is to visualize simply and directly a matrix heatmap based on ‘ggplot2’. **Note: all functions of network have been merged in netET package.**
Installation
You can install the released version of linkET from GitHub with:
r
install.packages("devtools")
devtools::install_github("Hy4m/linkET", force = TRUE)
packageVersion("linkET")
Example
This is a basic example which shows you how to solve a common problem:
Data processing
r
library(linkET)
matrix_data
matrix_data(list(mtcars = mtcars))
#> A matrix data object:
#> Number:  1
#> Names:  mtcars
#> Dimensions:  32 rows, 11 columns
#> Row names:  Mazda RX4, Mazda RX4 Wag, Datsun 710, Hornet 4 Drive, Hor...
#> Column names:  mpg, cyl, disp, hp, drat, wt, qsec, vs, am, gear, carb
md_tbl
matrix_data(list(mtcars = mtcars)) %>%
  asmdtbl()
#> # A tibble: 352 × 3
#>    .rownames         .colnames mtcars
#>  * <chr>             <chr>      <dbl>
#>  1 Mazda RX4         mpg         21
#>  2 Mazda RX4 Wag     mpg         21
#>  3 Datsun 710        mpg         22.8
#>  4 Hornet 4 Drive    mpg         21.4
#>  5 Hornet Sportabout mpg         18.7
#>  6 Valiant           mpg         18.1
#>  7 Duster 360        mpg         14.3
#>  8 Merc 240D         mpg         24.4
#>  9 Merc 230          mpg         22.8
#> 10 Merc 280          mpg         19.2
#> # … with 342 more rows
as method
asmatrixdata(mtcars)
#> A matrix data object:
#> Number:  1
#> Names:  mtcars
#> Dimensions:  32 rows, 11 columns
#> Row names:  Mazda RX4, Mazda RX4 Wag, Datsun 710, Hornet 4 Drive, Hor...
#> Column names:  mpg, cyl, disp, hp, drat, wt, qsec, vs, am, gear, carb
asmdtbl(mtcars) #> # A tibble: 352 × 3 #>    .rownames         .colnames mtcars #>  * <chr>             <chr>      <dbl> #>  1 Mazda RX4         mpg         21   #>  2 Mazda RX4 Wag     mpg         21   #>  3 Datsun 710        mpg         22.8 #>  4 Hornet 4 Drive    mpg         21.4 #>  5 Hornet Sportabout mpg         18.7 #>  6 Valiant           mpg         18.1 #>  7 Duster 360        mpg         14.3 #>  8 Merc 240D         mpg         24.4 #>  9 Merc 230          mpg         22.8 #> 10 Merc 280          mpg         19.2 #> # … with 342 more rows
special function for correlation matrix
correlate(mtcars) %>%
  asmatrixdata()
#> A matrix data object:
#> Number:  2
#> Names:  r, p
#> Dimensions:  11 rows, 11 columns
#> Row names:  mpg, cyl, disp, hp, drat, wt, qsec, vs, am, gear, carb
#> Column names:  mpg, cyl, disp, hp, drat, wt, qsec, vs, am, gear, carb
correlate(mtcars) %>%    asmdtbl() #> # A tibble: 121 × 4 #>    .rownames .colnames      r        p #>  * <chr>     <chr>      <dbl>    <dbl> #>  1 mpg       mpg        1     0        #>  2 cyl       mpg       -0.852 6.11e-10 #>  3 disp      mpg       -0.848 9.38e-10 #>  4 hp        mpg       -0.776 1.79e- 7 #>  5 drat      mpg        0.681 1.78e- 5 #>  6 wt        mpg       -0.868 1.29e-10 #>  7 qsec      mpg        0.419 1.71e- 2 #>  8 vs        mpg        0.664 3.42e- 5 #>  9 am        mpg        0.600 2.85e- 4 #> 10 gear      mpg        0.480 5.40e- 3 #> # … with 111 more rows
Heatmap
r
library(ggplot2)
matrix_data(list(mtcars = mtcars)) %>%
  hyplot(aes(fill = mtcars)) +
  geom_tile()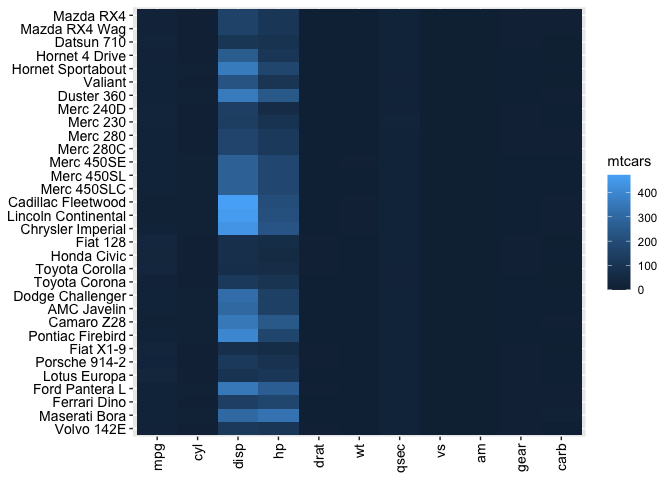
r
asmdtbl(mtcars) %>%
  hyplot(aes(size = mtcars)) +
  geom_point(shape = 21, fill = NA)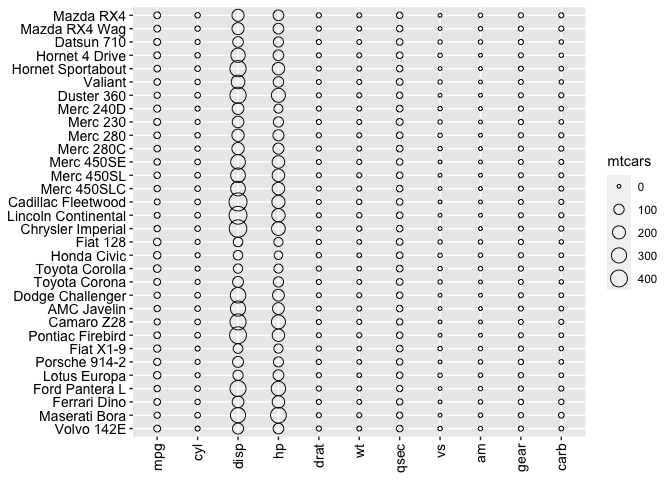
r
correlate(mtcars) %>%
  asmdtbl() %>%
  qcorrplot() +
  geom_square()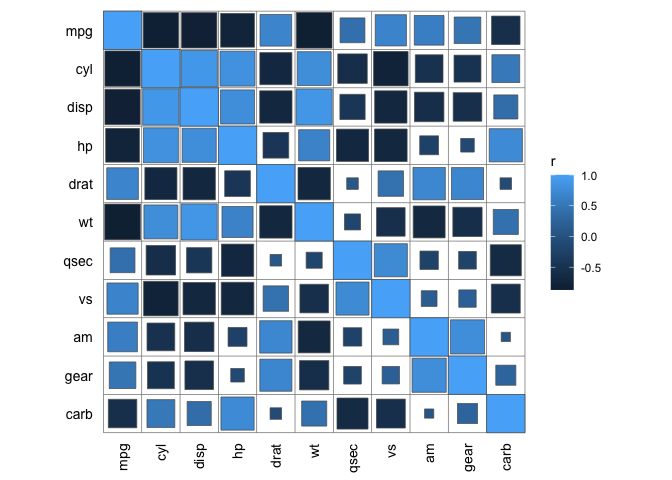
r
library(vegan)
#> 载入需要的程辑包:permute
#> 载入需要的程辑包:lattice
#> This is vegan 2.6-4
data("varespec")
data("varechem")
correlate(varespec[1:30], varechem) %>%
  qcorrplot() +
  geom_square() +
  scalefillgradientn(colours = RColorBrewer::brewer.pal(11, "RdBu"))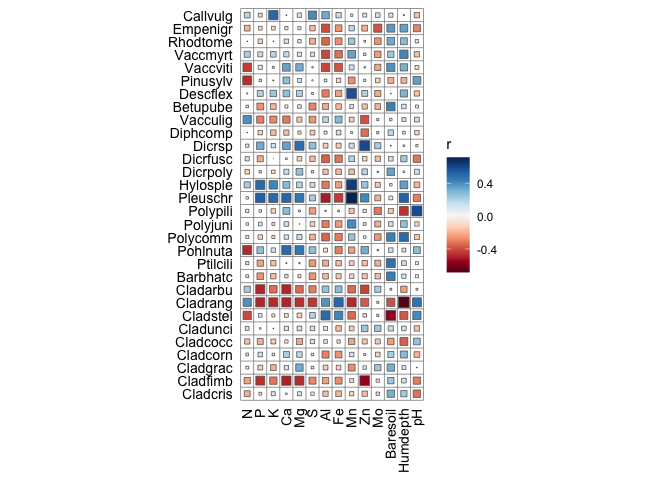
r
qcorrplot(varespec[1:30], type = "lower") +
  geom_square() +
  scalefillgradientn(colours = RColorBrewer::brewer.pal(11, "RdBu"))
#> The input data is not a correlation matrix,
#> you can override this behavior by setting the is_corr parameter.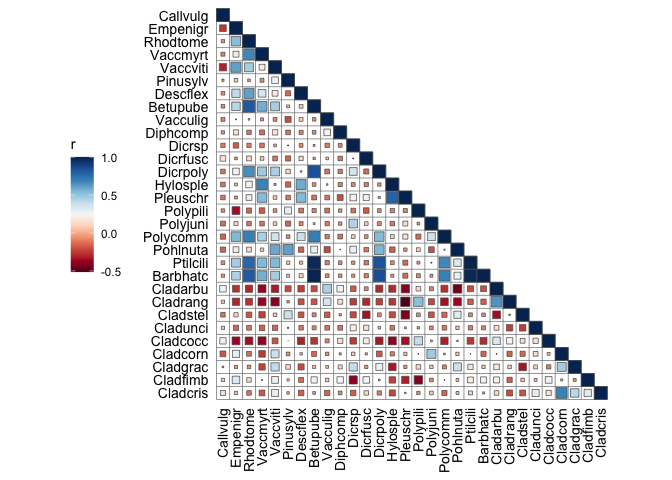
r
you can set your style
setcorrplotstyle()
qcorrplot(mtcars) + geom_square()
#> The input data is not a correlation matrix,
#> you can override this behavior by setting the is_corr parameter.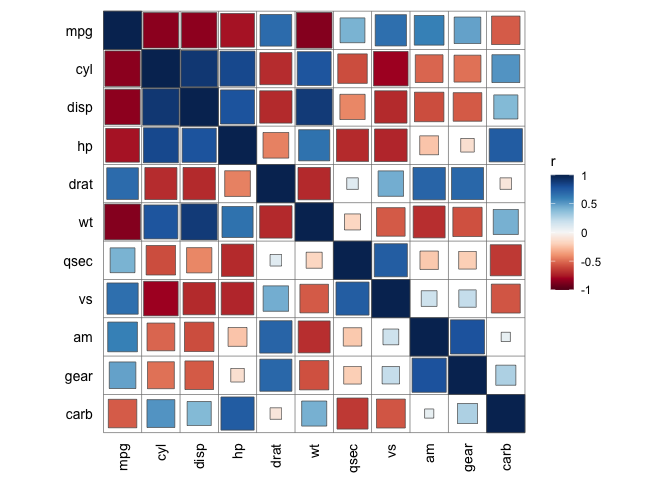
r
reset to default style
setdefaultstyle()
mantel test
r
library(dplyr)
#>
#> 载入程辑包:'dplyr'
#> The following objects are masked from 'package:stats':
#>
#>     filter, lag
#> The following objects are masked from 'package:base':
#>
#>     intersect, setdiff, setequal, union
data("varechem", package = "vegan")
data("varespec", package = "vegan")
mantel <- mantel_test(varespec, varechem,                       spec_select = list(Spec01 = 1:7,                                          Spec02 = 8:18,                                          Spec03 = 19:37,                                          Spec04 = 38:44)) %>%    mutate(rd = cut(r, breaks = c(-Inf, 0.2, 0.4, Inf),                   labels = c("< 0.2", "0.2 - 0.4", ">= 0.4")),          pd = cut(p, breaks = c(-Inf, 0.01, 0.05, Inf),                   labels = c("< 0.01", "0.01 - 0.05", ">= 0.05"))) #> mantel_test() using 'bray' dist method for 'spec'. #> mantel_test() using 'euclidean' dist method for 'env'.
qcorrplot(correlate(varechem), type = "lower", diag = FALSE) +   geom_square() +   geom_couple(aes(colour = pd, size = rd),                data = mantel,                curvature = nice_curvature()) +   scalefillgradientn(colours = RColorBrewer::brewer.pal(11, "RdBu")) +   scalesizemanual(values = c(0.5, 1, 2)) +   scalecolourmanual(values = color_pal(3)) +   guides(size = guide_legend(title = "Mantel's r",                              override.aes = list(colour = "grey35"),                               order = 2),          colour = guide_legend(title = "Mantel's p",                                 override.aes = list(size = 3),                                 order = 1),          fill = guide_colorbar(title = "Pearson's r", order = 3))
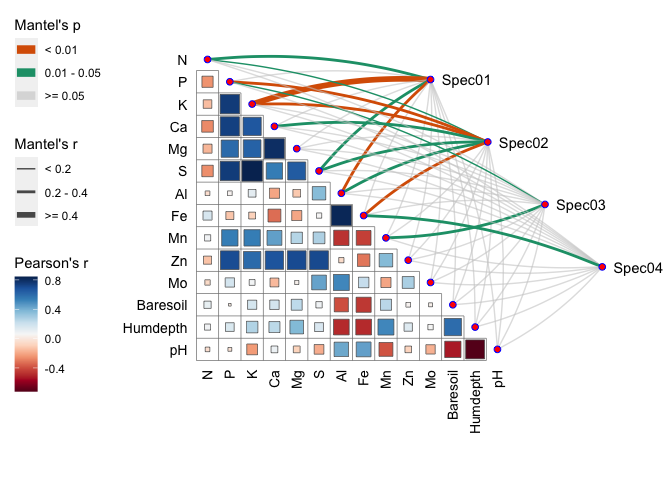
pairs plot
r
qpairs(iris) + geom_pairs()
#> Warning: 'use_md' has been deprecated,
#> please set 'parse' parameter instead.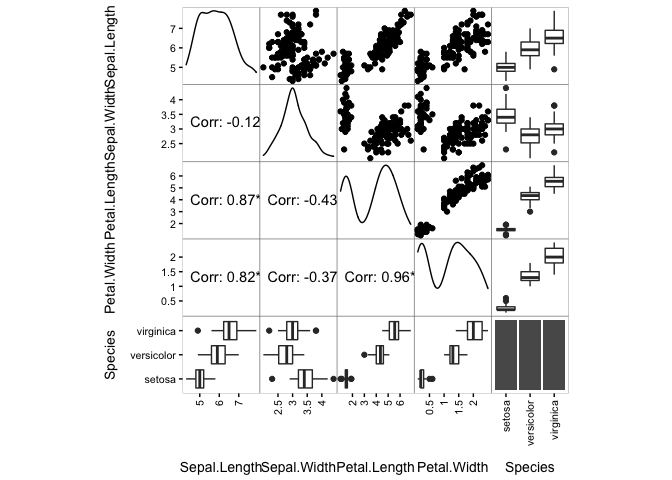
Citation
To cite linkET in publications use:
Houyun Huang(2021). linkET: Everything is Linkable. R package version 0.0.3.


