
Python library for plotting on google earth
googleearthplot ===============
Python library for plotting on google earth
Galleries
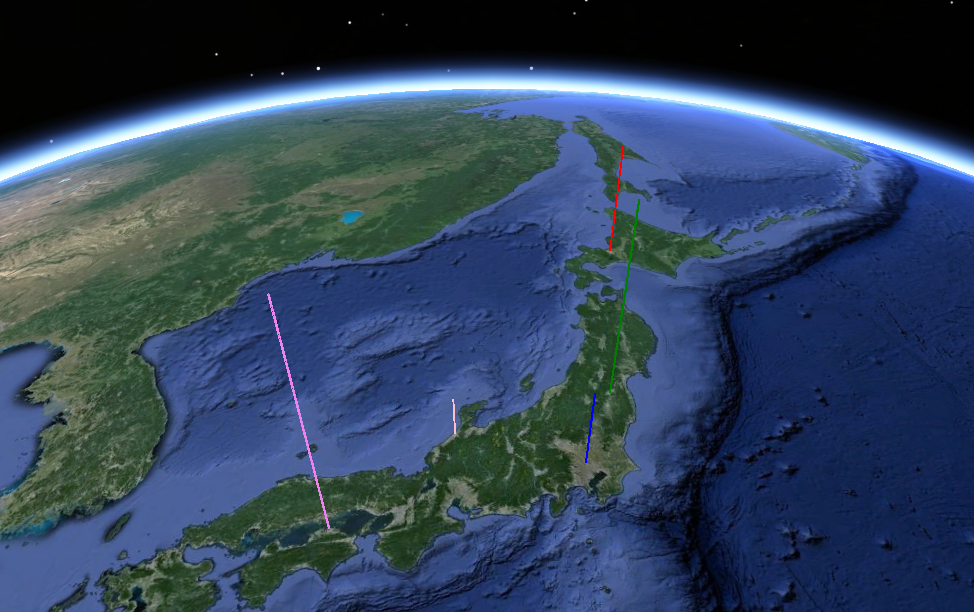
Requirements
simplekml
pandas
Google Earth (Pro)
install:from the upper link
Install
You can install to use pip:
sudo pip install googleearthplot
Usages
This library generates a kml file for plot as below.
First of all, import the lib:
from googleearthplot.googleearchplot import googleearthplot
The import code depends on the script path which use googleearchplot.
Point plot
A point plot is created like this:
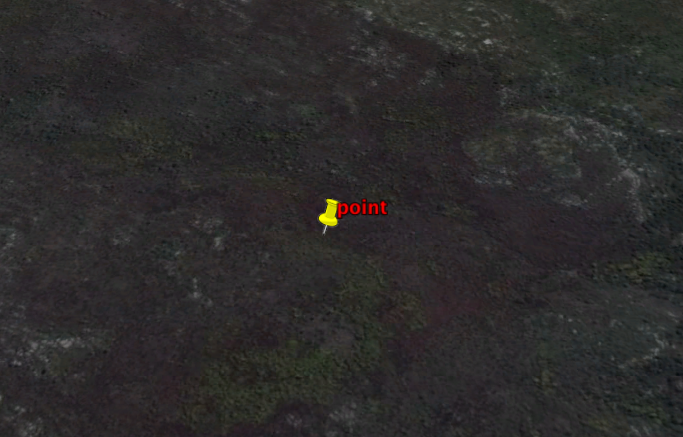
#Plot point lon=18.333868#degree lat=-34.038274#degree gep9=googleearthplot() gep9.PlotPoints(lat,lon,"point") gep9.GenerateKMLFile(filepath="sample9.kml")
Then, you can see
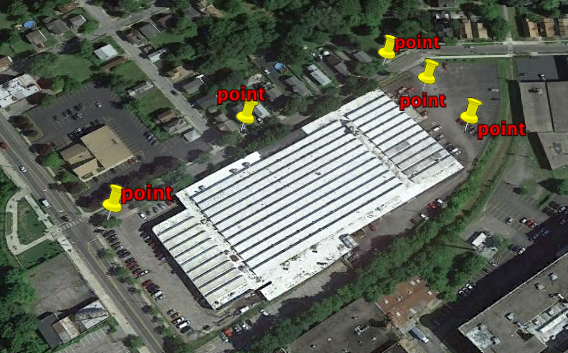
Of course, you can plot mutipul points.
# Plot point chart gep10 = googleearthplot() lat = [ -77.6192, -77.6195, -77.6198, -77.6208, -77.6216] lon = [43.1725, 43.1728, 43.173, 43.1725, 43.1719, 43.1719] for (ilat,ilon) in zip(lat,lon): gep10.PlotPoints(ilat, ilon, "point") gep10.GenerateKMLFile(filepath="sample10.kml")
A bar plot
You can plot a bar chart like:
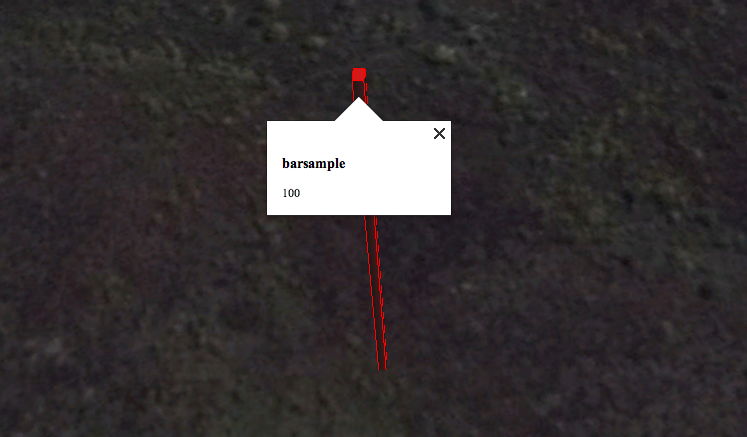
#A bar plot gep1=googleearthplot() lat=18.333868#degree lon=-34.038274#degree num=100 #bar height size size=1 #meter name="barsample" color="red" gep1.PlotBarChart(lat,lon,num,size,name,color); gep1.GenerateKMLFile(filepath="sample1.kml")
If you click the generated kml file,
you can see the plot on Google Earth.
The addLabel flag is on,
PlotBarChart(lat,lon,num,size,name,color,addLabel=True)
you can add labels on the plot
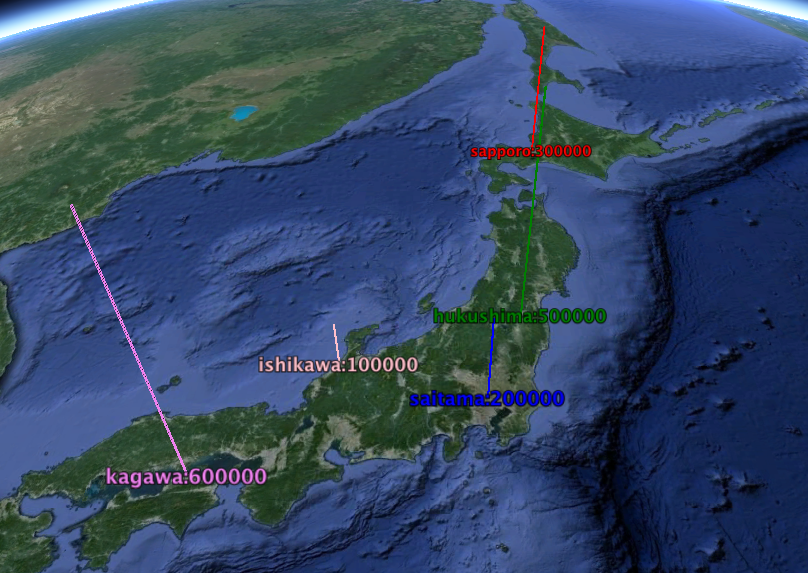
Bar plots from csv data
You can plot bar charts from a csv file like:
#bar plot from csv gep=googleearthplot() gep.PlotBarChartsFromCSV("barchartsampledata.csv") gep.GenerateKMLFile(filepath="sample2.kml")
you can see plots when you click the generated kml file.
The CSV file format should be like the sample file:
Line plot
You can plot a line chart:
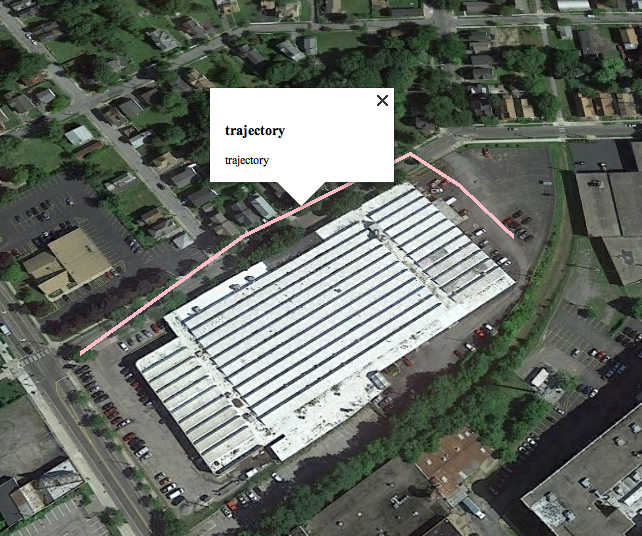
#Plot line chart gep2=googleearthplot() lat=[-77.6192,-77.6192,-77.6195,-77.6198,-77.6208,-77.6216,-77.6216,-77.6216] lon=[43.1725,43.1725,43.1728,43.173,43.1725,43.1719,43.1719,43.1719,43.1719] gep2.PlotLineChart(lat, lon, name="trajectory",color="pink") gep2.GenerateKMLFile(filepath="sample3.kml") Then, you can see:
Line plot with height
You can plot a line chart with height data:
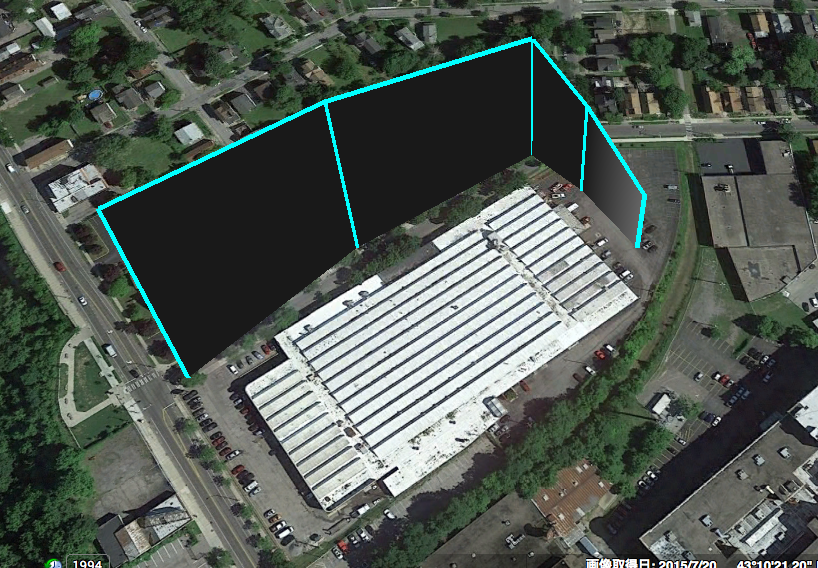
#Plot line chart with height gep3=googleearthplot() lat=[-77.6192,-77.6192,-77.6195,-77.6198,-77.6208,-77.6216] lon=[43.1725,43.1725,43.1728,43.173,43.1725,43.1719,43.1719] height=[10,40,60,80,100,120,140] gep3.PlotLineChart(lat, lon, heightList=height, name="trajectory2",color="aqua") gep3.GenerateKMLFile(filepath="sample4.kml")
you can see:
Line plot from csv file
You can plot the line chart from a csv file:
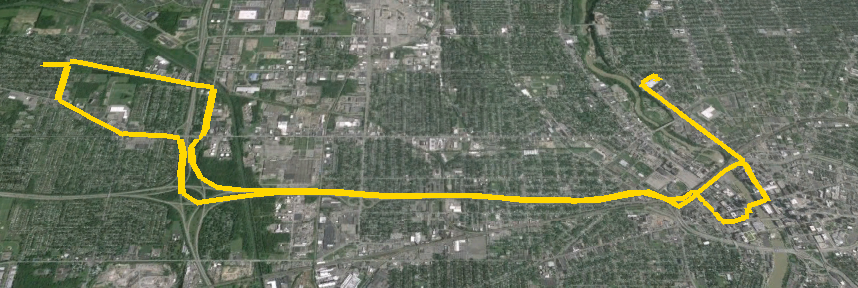
#line plot from csv file gep4=googleearthplot() gep4.PlotLineChartFromCSV("sampledata/lineplotsampledata.csv", name="trajectory3", color="gold", width=10) gep4.GenerateKMLFile(filepath="sample5.kml")
you can get the image:
Check the csv file format
Line plot with height from csv file
You can plot the line chart with height from a csv file:
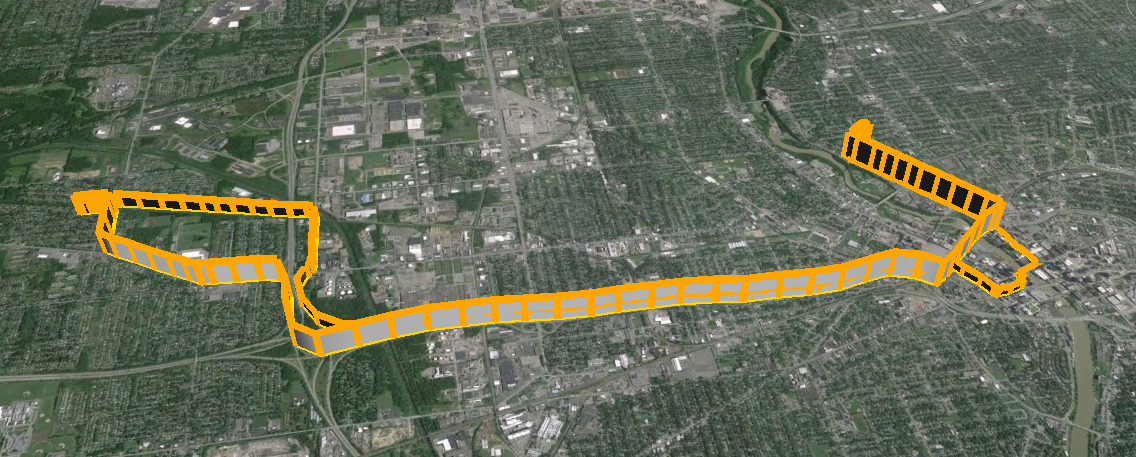
#line plot from csv file with height gep5=googleearthplot() gep5.PlotLineChartFromCSV("sampledata/lineplotsampledata2.csv", name="trajectory4", color="orange", width=10) gep5.GenerateKMLFile(filepath="sample6.kml")
you can get:
see the csv sample file
Plot Overlay Image
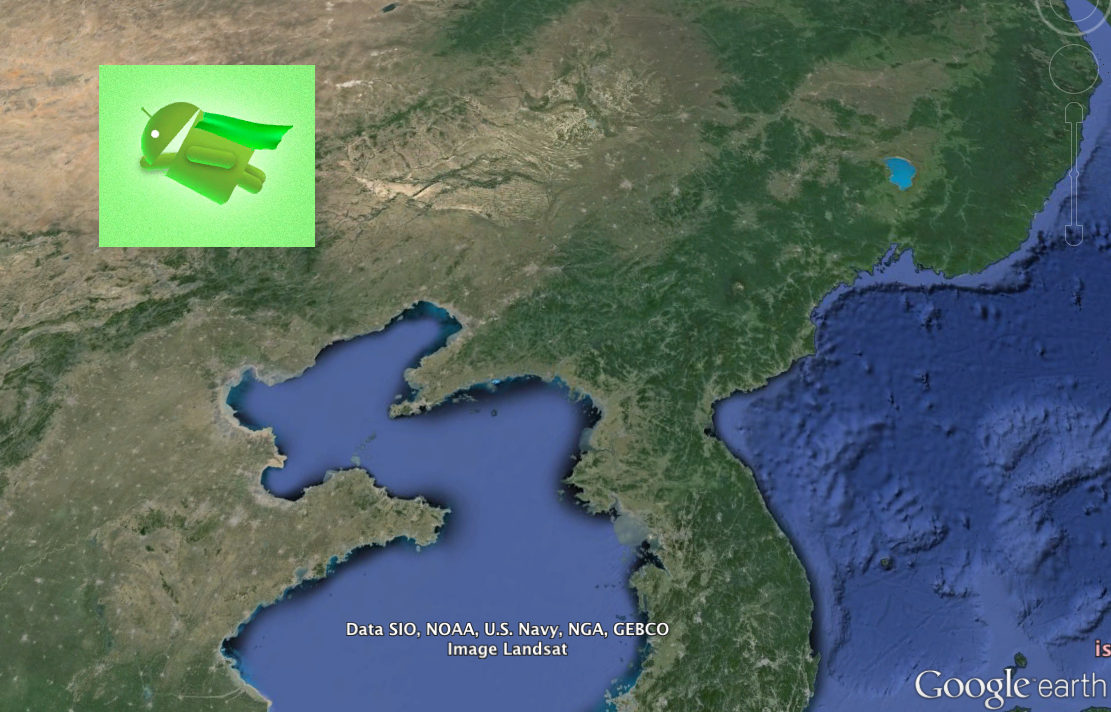
You can plot a overlay image (logo, etc.)
#Plot overlay image sample gep8=googleearthplot() gep8.PlotOverlayImg("img/samplelogo.png",200,300,name="logo") gep8.GenerateKMLFile(filepath="sample8.kml")
This is a sample screenshot:
Color options
You can choose a color option from belows:
'aliceblue', 'antiquewhite', 'aqua', 'aquamarine', 'azure', 'beige', 'bisque', 'black', 'blanchedalmond', 'blue', 'blueviolet', 'brown', 'burlywood', 'cadetblue', 'changealpha', 'changealphaint', 'chartreuse', 'chocolate', 'coral', 'cornflowerblue', 'cornsilk', 'crimson', 'cyan', 'darkblue', 'darkcyan', 'darkgoldenrod', 'darkgray', 'darkgreen', 'darkgrey', 'darkkhaki', 'darkmagenta', 'darkolivegreen', 'darkorange', 'darkorchid', 'darkred', 'darksalmon', 'darkseagreen', 'darkslateblue', 'darkslategray', 'darkslategrey', 'darkturquoise', 'darkviolet', 'deeppink', 'deepskyblue', 'dimgray', 'dimgrey', 'dodgerblue', 'firebrick', 'floralwhite', 'forestgreen', 'fuchsia', 'gainsboro', 'ghostwhite', 'gold', 'goldenrod', 'gray', 'green', 'greenyellow', 'grey', 'hex', 'hexa', 'honeydew', 'hotpink', 'indianred', 'indigo', 'ivory', 'khaki', 'lavender', 'lavenderblush', 'lawngreen', 'lemonchiffon', 'lightblue', 'lightcoral', 'lightcyan', 'lightgoldenrodyellow', 'lightgray', 'lightgreen', 'lightgrey', 'lightpink', 'lightsalmon', 'lightseagreen', 'lightskyblue', 'lightslategray', 'lightslategrey', 'lightsteelblue', 'lightyellow', 'lime', 'limegreen', 'linen', 'magenta', 'maroon', 'mediumaquamarine', 'mediumblue', 'mediumorchid', 'mediumpurple', 'mediumseagreen', 'mediumslateblue', 'mediumspringgreen', 'mediumturquoise', 'mediumvioletred', 'midnightblue', 'mintcream', 'mistyrose', 'moccasin', 'navajowhite', 'navy', 'oldlace', 'olive', 'olivedrab', 'orange', 'orangered', 'orchid', 'palegoldenrod', 'palegreen', 'paleturquoise', 'palevioletred', 'papayawhip', 'peachpuff', 'peru', 'pink', 'plum', 'powderblue', 'purple', 'red', 'rgb', 'rosybrown', 'royalblue', 'saddlebrown', 'salmon', 'sandybrown', 'seagreen', 'seashell', 'sienna', 'silver', 'skyblue', 'slateblue', 'slategray', 'slategrey', 'snow', 'springgreen', 'steelblue', 'tan', 'teal', 'thistle', 'tomato', 'turquoise', 'violet', 'wheat', 'white', 'whitesmoke', 'yellow', 'yellowgreen'


