
Data Analysis with Bootstrapped ESTimation
DABEST-Python





Recent Version Update
✨ DABEST “Bingka” v2025.10.20 for Python is now released! ✨
Dear DABEST users, The latest version of the DABEST Python library brings new visualizations, refined plots, and improved accuracy.
- Whorlmap 🌀: Compact visualization for multi-dimensional effects
Whorlmaps condense information from the full bootstrap distributions of many contrast objects into a **2D heatmap-style grid of “whorled” cells**. This provides an overview of the entire dataset while preserving the underlying distributional detail.
They are especially useful for large-scale or multi-condition experiments, serving as a **space-efficient alternative to stacked forest plots**.
You can generate a Whorlmap directly from multi-dimensional DABEST objects using the .whorlmap() method. See the Whorlmap tutorial for more details.
- Slopegraphs 📈: Enhanced summaries for paired data
- By default, a thick trend line connects group means, with vertical bars showing standard deviation.
- Choose the summary type via the group_summaries argument in .plot() — options include 'meansd', 'medianquartiles', or None.
- Customize appearance with groupsummarieskwargs.
See the Group Summaries section in the Plot Aesthetics tutorial for more details.
- Mini-meta Weighted Delta Fix 🧮
- Expanded custom_palette functionality 🎨
custom_palette can now
take 1 and 0 as dictionary keys to color the filled and
unfilled portions of the plot.
- Slopegraphs (paired, non-proportional): custom_palette can now color contrast bars and effect-size curves.
See the Custom Palette section in the Plot Aesthetics tutorial for examples.
Thank you for your continued support!
The DABEST Development Team
Contents
- About
- Installation
- Usage
- How to cite
- Bugs
- Contributing
- Acknowledgements
- Testing
- DABEST in other languages
About
DABEST is a package for Data Analysis using Bootstrap-Coupled ESTimation.
Estimation statistics are a simple framework that avoids the pitfalls of significance testing. It employs familiar statistical concepts such as means, mean differences, and error bars. More importantly, it focuses on the effect size of one’s experiment or intervention, rather than succumbing to a false dichotomy engendered by P values.
An estimation plot comprises two key features.
- It presents all data points as a swarm plot, ordering each point to
- It illustrates the effect size as a **bootstrap 95% confidence
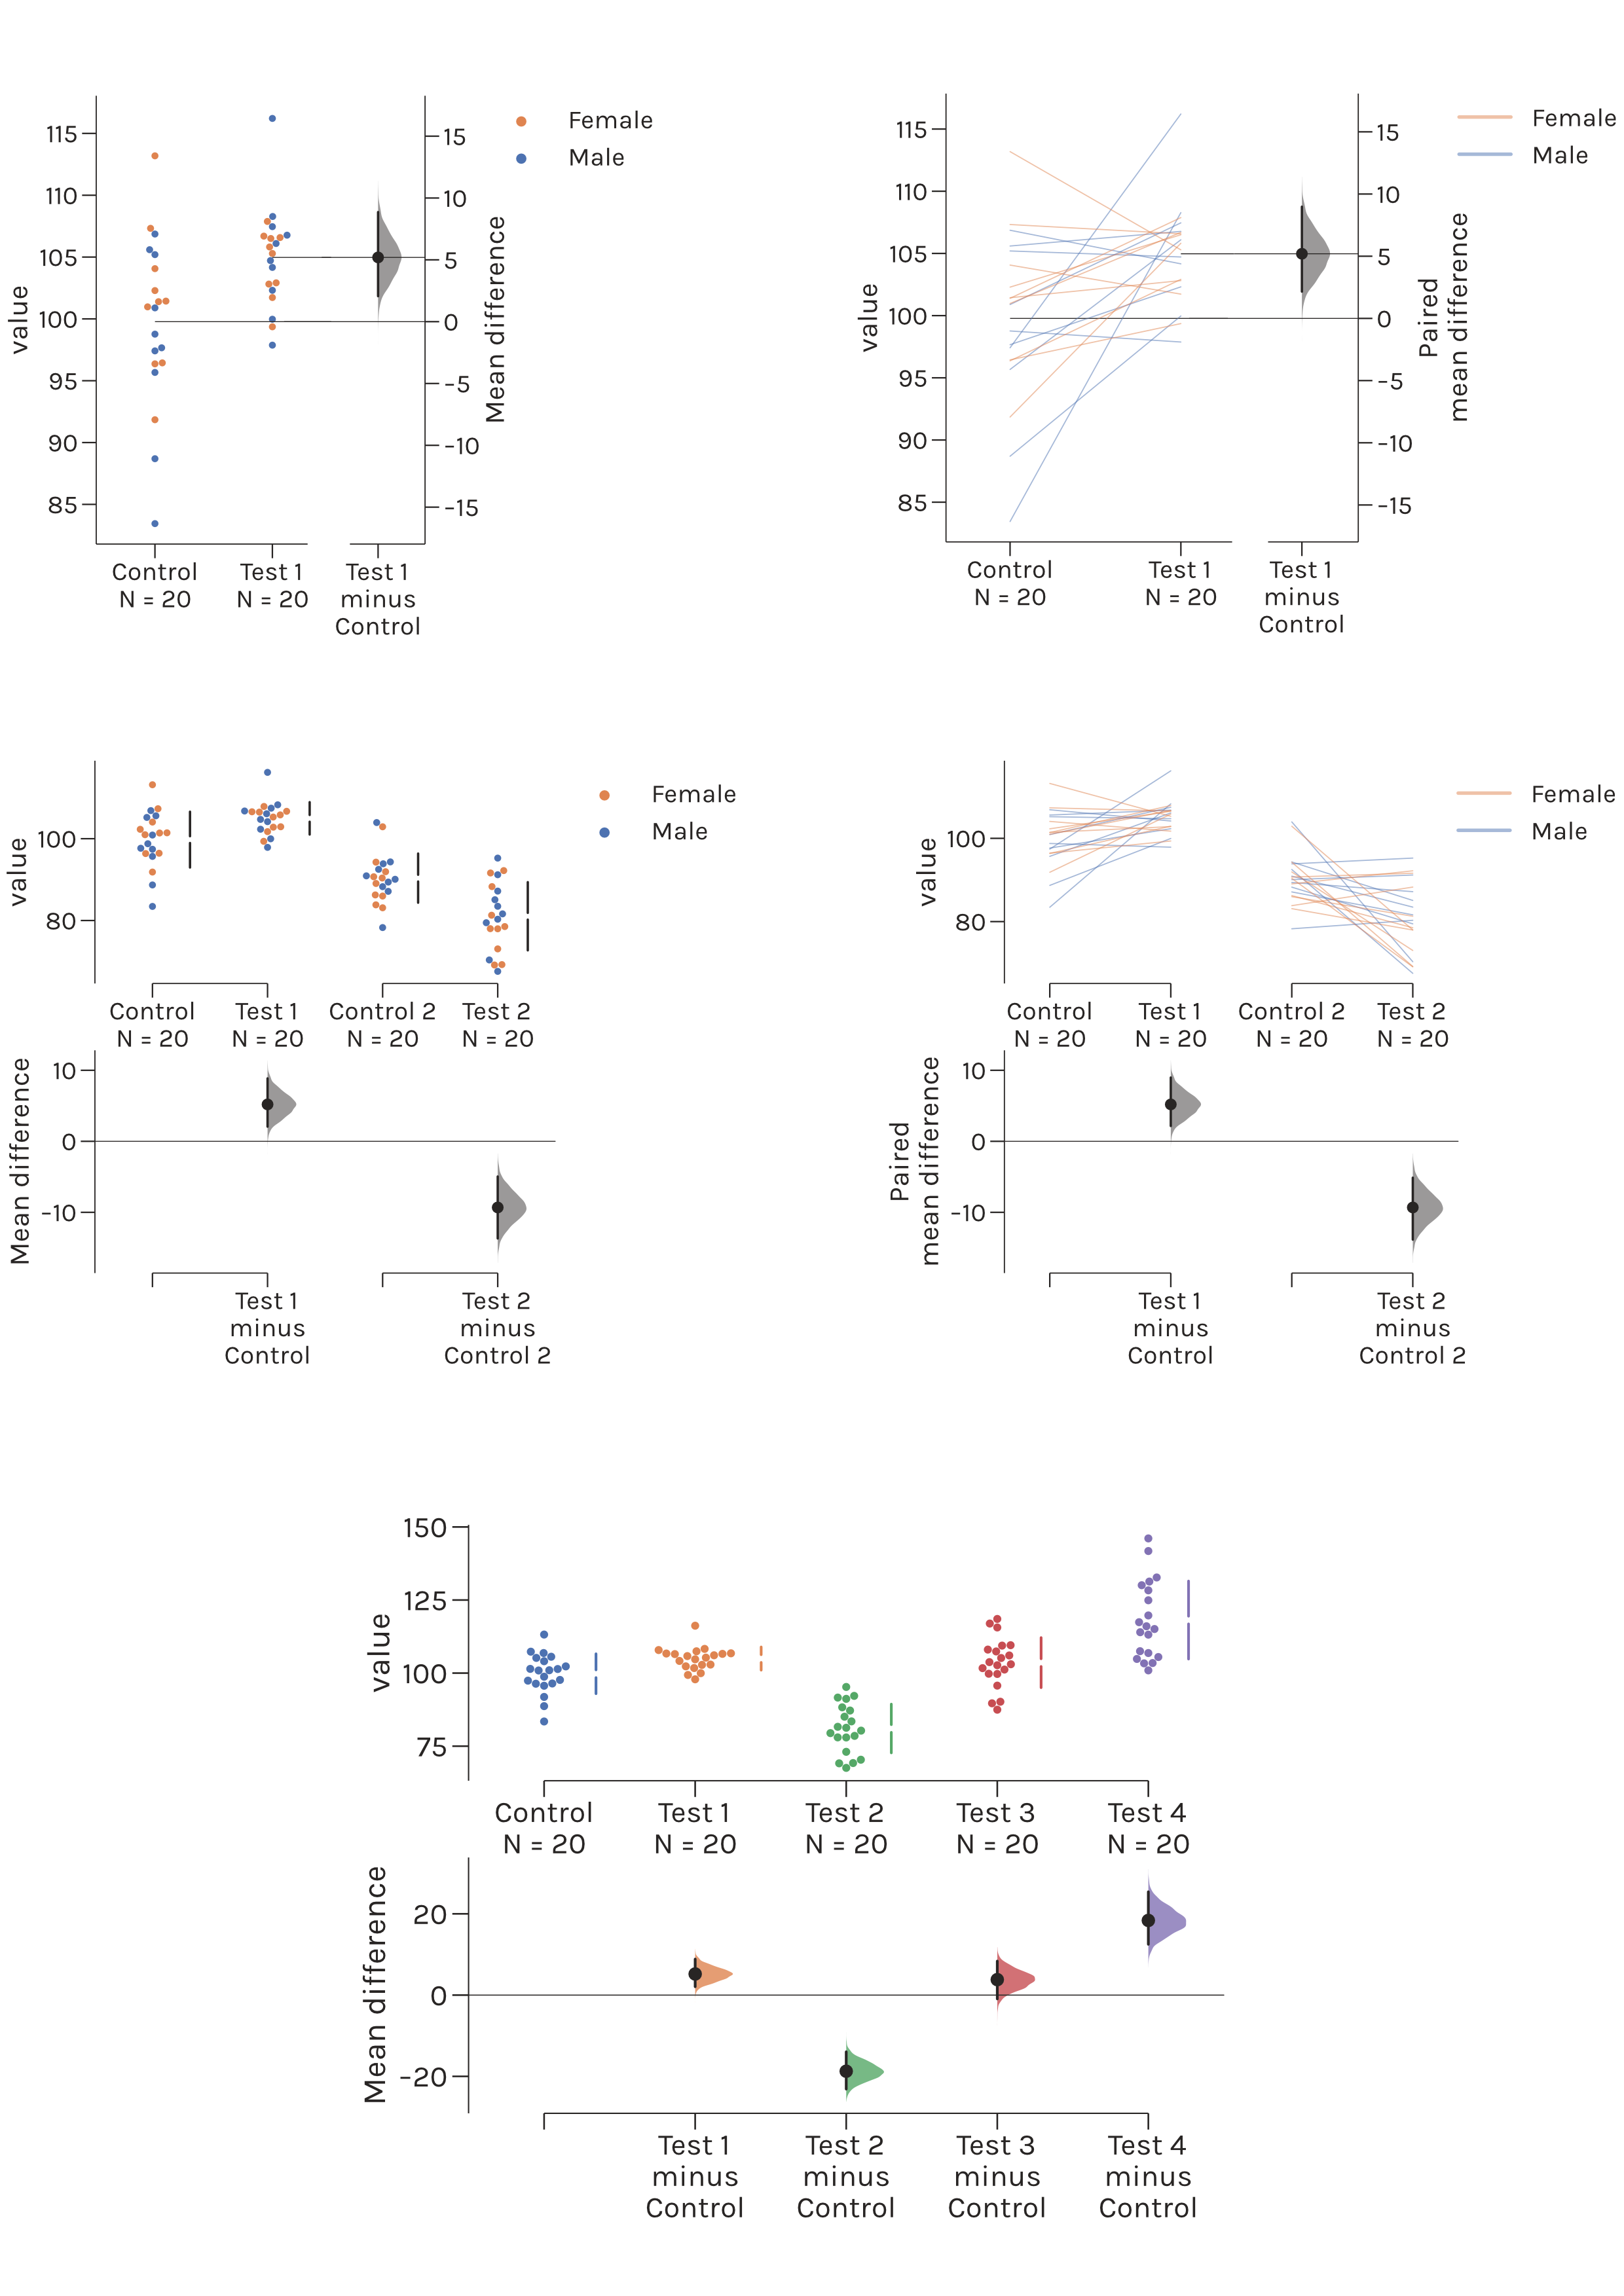
DABEST powers estimationstats.com, allowing everyone access to high-quality estimation plots.
Installation
This package is tested on Python 3.11 and onwards. It is highly recommended to download the Anaconda distribution of Python in order to obtain the dependencies easily.
You can install this package via pip.
To install, at the command line run
shell
pip install dabest
You can also clone this repo locally.
Then, navigate to the cloned repo in the command line and run
shell
pip install .
Usage
python3
import pandas as pd
import dabest
Load the iris dataset. This step requires internet access.
iris = pd.read_csv("https://github.com/mwaskom/seaborn-data/raw/master/iris.csv")
Load the above data into dabest.
irisdabest = dabest.load(data=iris, x="species", y="petalwidth",
                          idx=("setosa", "versicolor", "virginica"))
Produce a Cumming estimation plot.
irisdabest.meandiff.plot();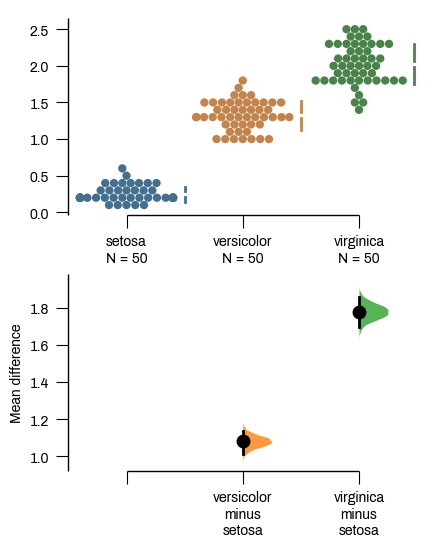
Please refer to the official tutorial for more useful code snippets.
How to cite
Getting over ANOVA: Estimation graphics for multi-group comparisons
*Zinan Lu, Jonathan Anns, Yishan Mai, Rou Zhang, Kahseng Lian, Nicole MynYi Lee, Shan Hashir, Lucas Wang Zhuoyu, A. Rosa Castillo Gonzalez, Joses Ho, Hyungwon Choi, Sangyu Xu, Adam Claridge-Chang*
bioRxiv preprint 2026. 10.64898/2026.01.26.701654
Moving beyond P values: Everyday data analysis with estimation plots
*Joses Ho, Tayfun Tumkaya, Sameer Aryal, Hyungwon Choi, Adam Claridge-Chang*
Nature Methods 2019, 1548-7105. 10.1038/s41592-019-0470-3
Paywalled publisher site; Free-to-view PDF
Bugs
Please report any bugs on the issue page.
Contributing
All contributions are welcome; please read the Guidelines for contributing first.
We also have a Code of Conduct to foster an inclusive and productive space.
A wish list for new features
If you have any specific comments and ideas for new features that you would like to share with us, please read the Guidelines for contributing, create a new issue using Feature request template or create a new post in our Google Group.
Acknowledgements
We would like to thank alpha testers from the Claridge-Chang lab: Sangyu Xu, Xianyuan Zhang, Farhan Mohammad, Jurga Mituzaitė, and Stanislav Ott.
Testing
To test DABEST, you need to install pytest and nbdev.
- Run
pytestin the root directory of the source distribution. This
dabest/tests/mplimagetests.
- Run
nbdev_testin the root directory of the source distribution.
dabest/tests
The test suite ensures that the bootstrapping functions and the plotting functions perform as expected.
For detailed information, please refer to the test folder
DABEST in other languages
DABEST is also available in R (dabestr) and Matlab (DABEST-Matlab).


