
📈📊⛰⛰⛰An elegant modern declarative data visualization chart framework for Android . Extremely powerful, supports line, spline, area, areaspline, column, bar, pie, scatter, angular gauges, arearange, areasplinerange, columnrange, bubble, box plot, error bars, funnel, waterfall and polar chart types.极其精美而又强大的 Android 数据可视化图表框架,支持柱状图、条形图、折线图、曲线图、折线填充图、曲线填充图、气泡图、扇形图、环形图、散点图、雷达图、混合图等各种类型的多达几十种的信息图图表,完全满足工作所需.
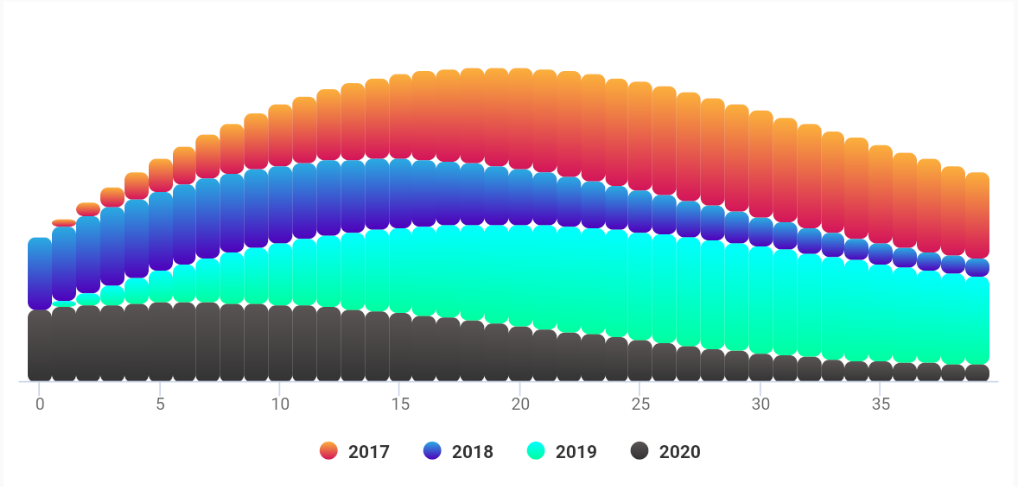
AAInfographics









English Document 🇬🇧 | 简体中文文档 🇨🇳
There is the link of Java version of AAChartCore-Kotlin as follow
https://github.com/AAChartModel/AAChartCore
Preface
AAInfographics is theKotlin language version of AAChartKit which is object-oriented, a set of easy-to-use, extremely elegant graphics drawing controls,based on the popular open source front-end chart library Highcharts. It makes it very fast to add interactive charts to your mobile projects. It supports single touch-drag for data inspection, multi-touch for zooming, and advanced responsiveness for your apps .
Features
- Support
Android、Kotlin&Java. - Powerful,support the
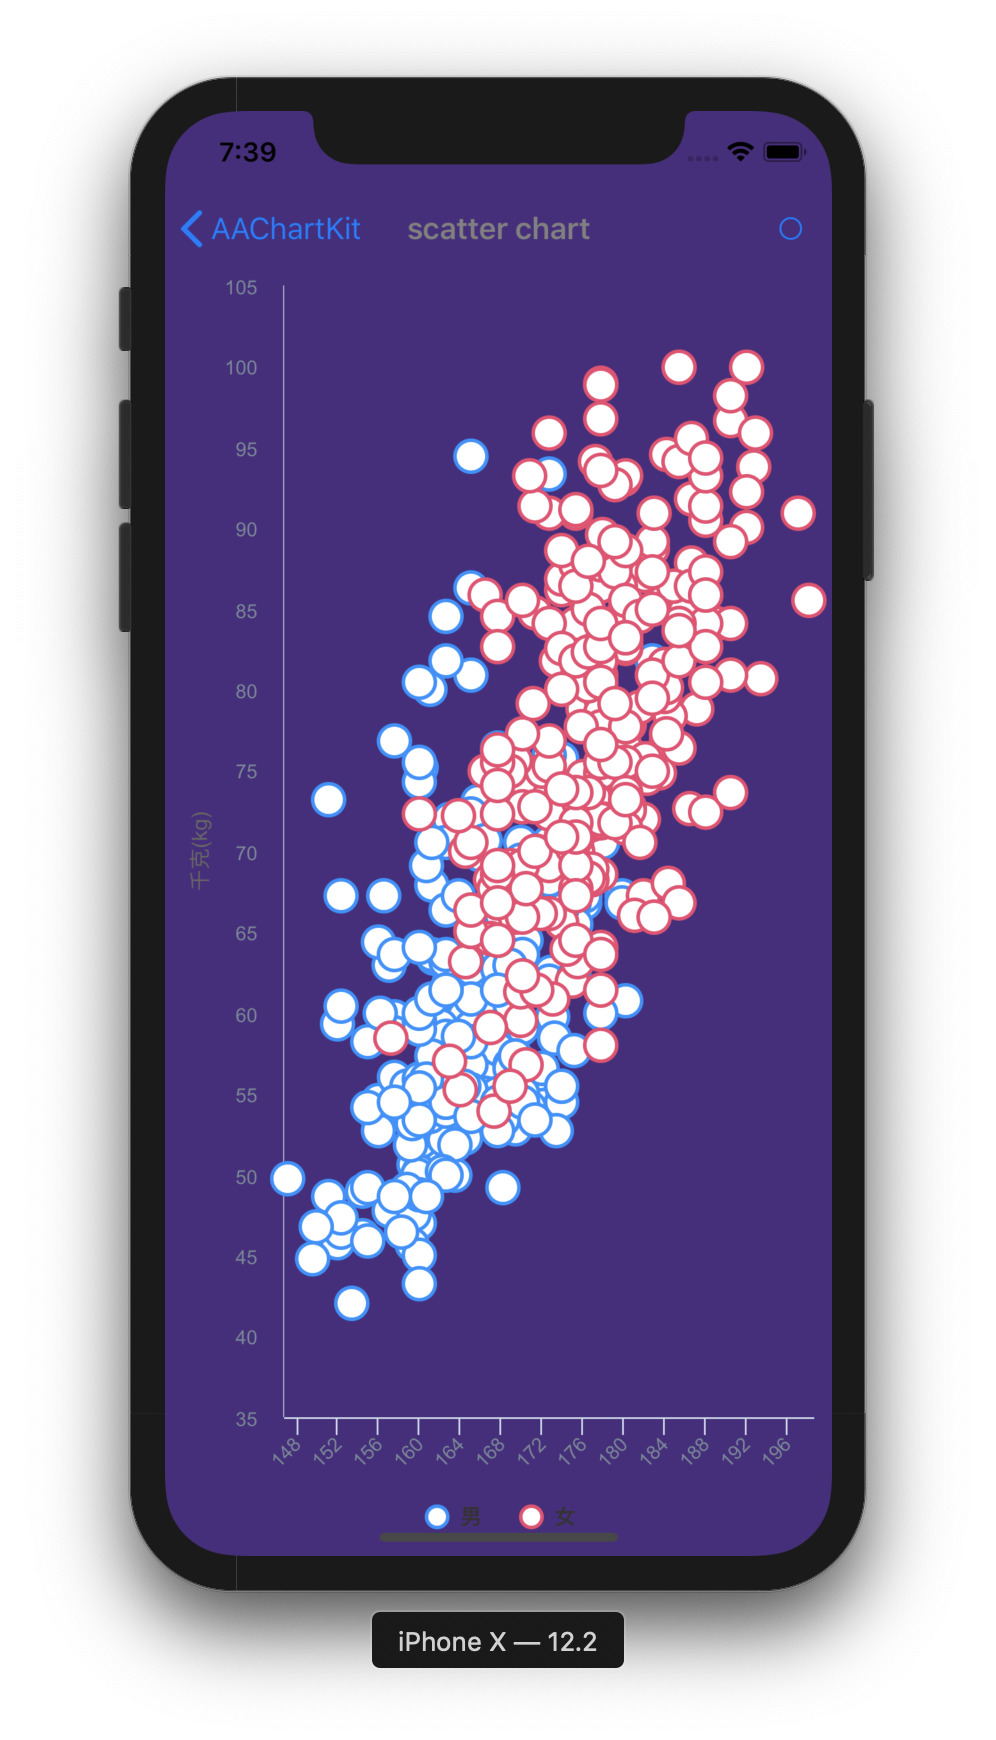
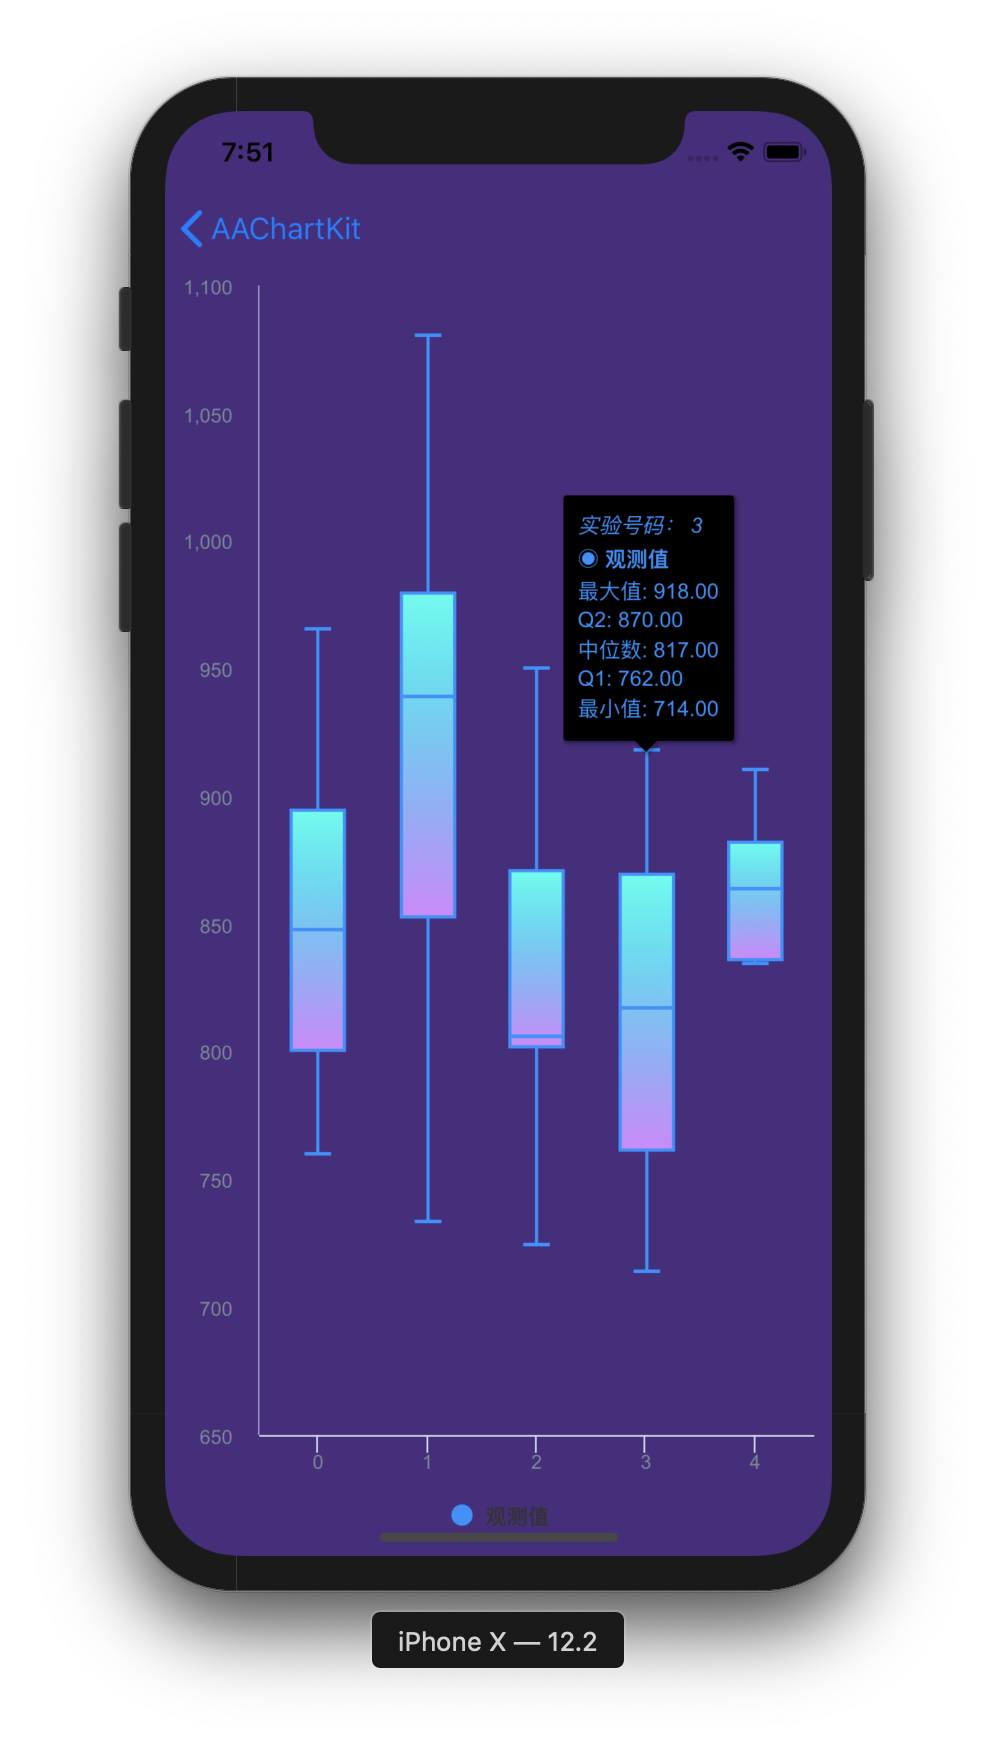
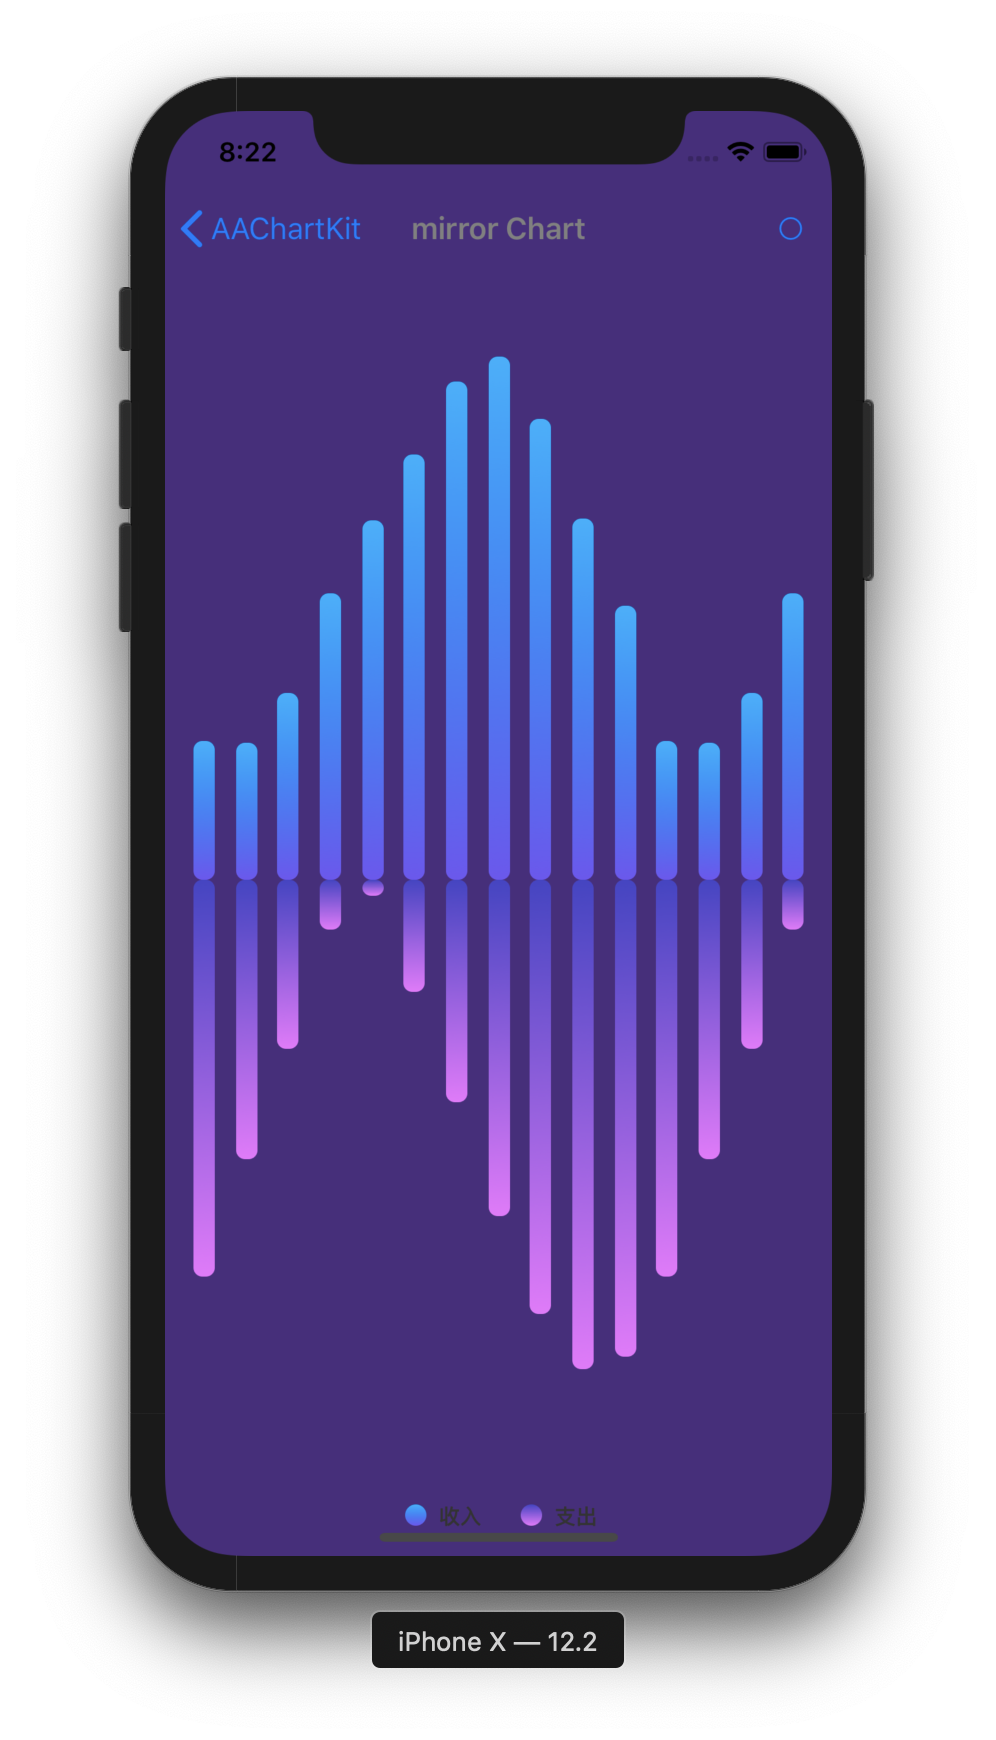
column chart、bar chart、area chart、areaspline chart、line chart、spline chart、radar chart、polar chart、pie chart、bubble chart、pyramid chart、funnel chart、columnrange chartand other graphics. - Interactive、animated, the
animationeffect is exquisite 、delicate、 smooth and beautiful. - Support
chain programming syntaxlike system framework. AAChartView + AAChartModel = ChartIn the AAInfographics,it follows a minimalist formula:Chart view + Chart model = The chart you want. Just like the other powerful charts framework AAChartKit、AAChartKit-Swift、AAChartCore.
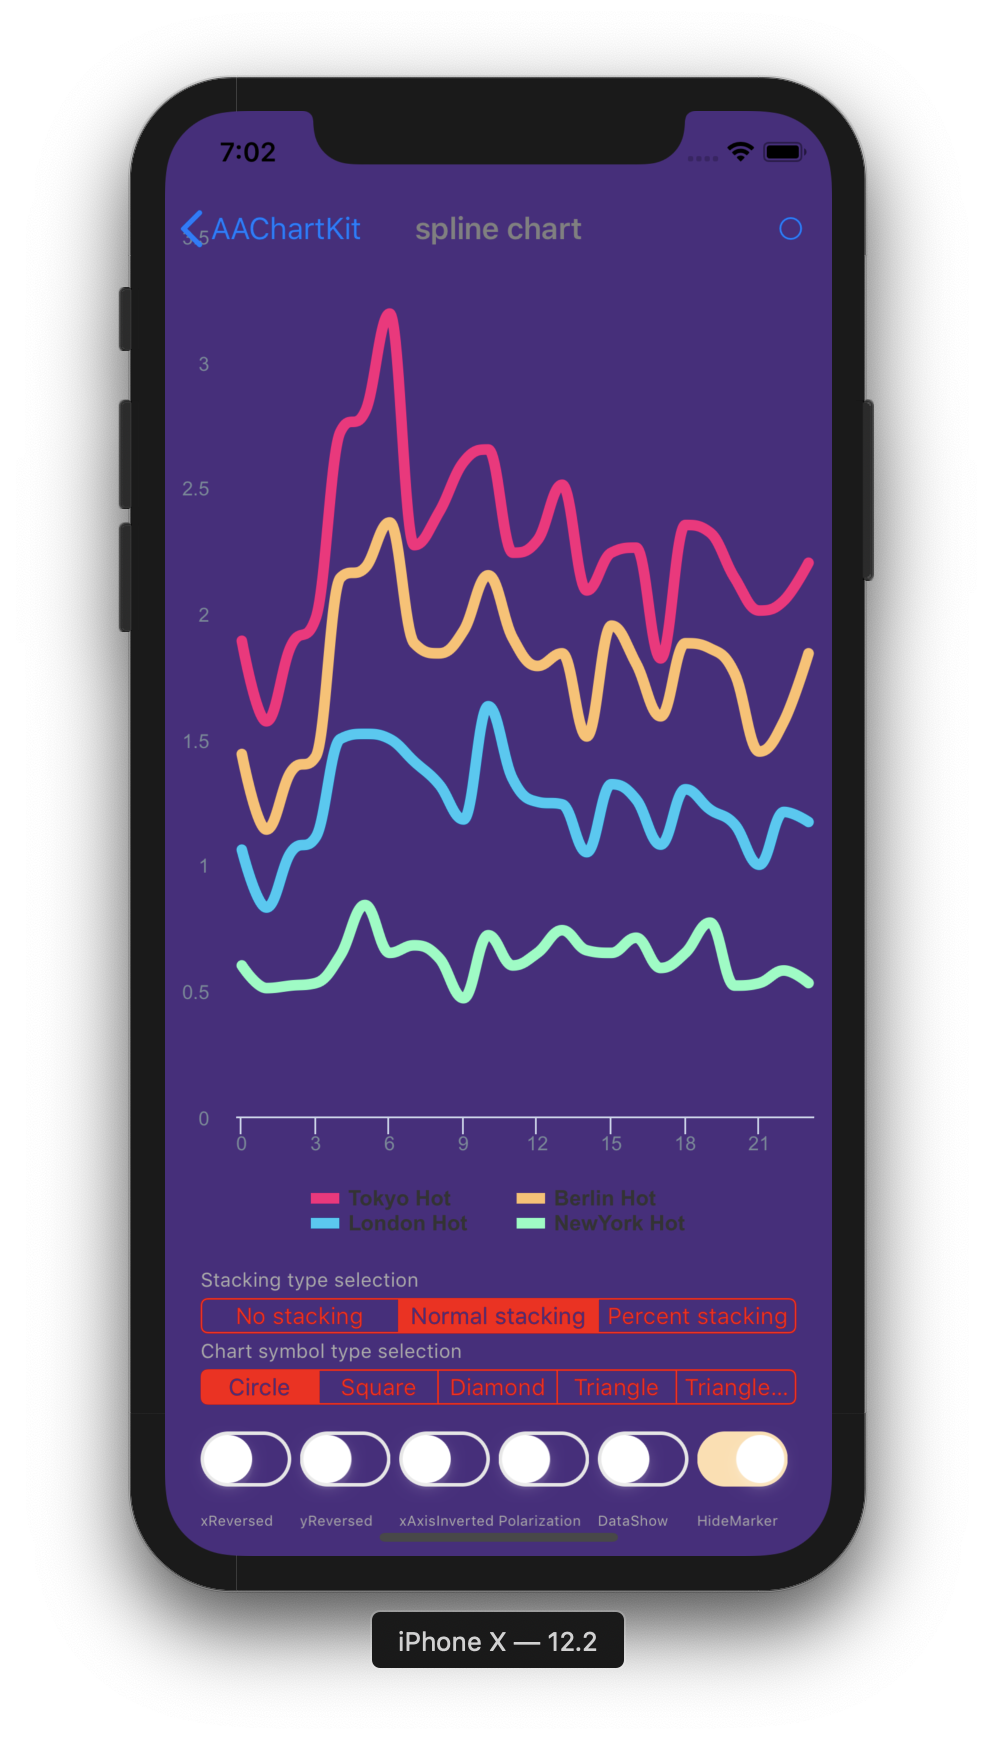
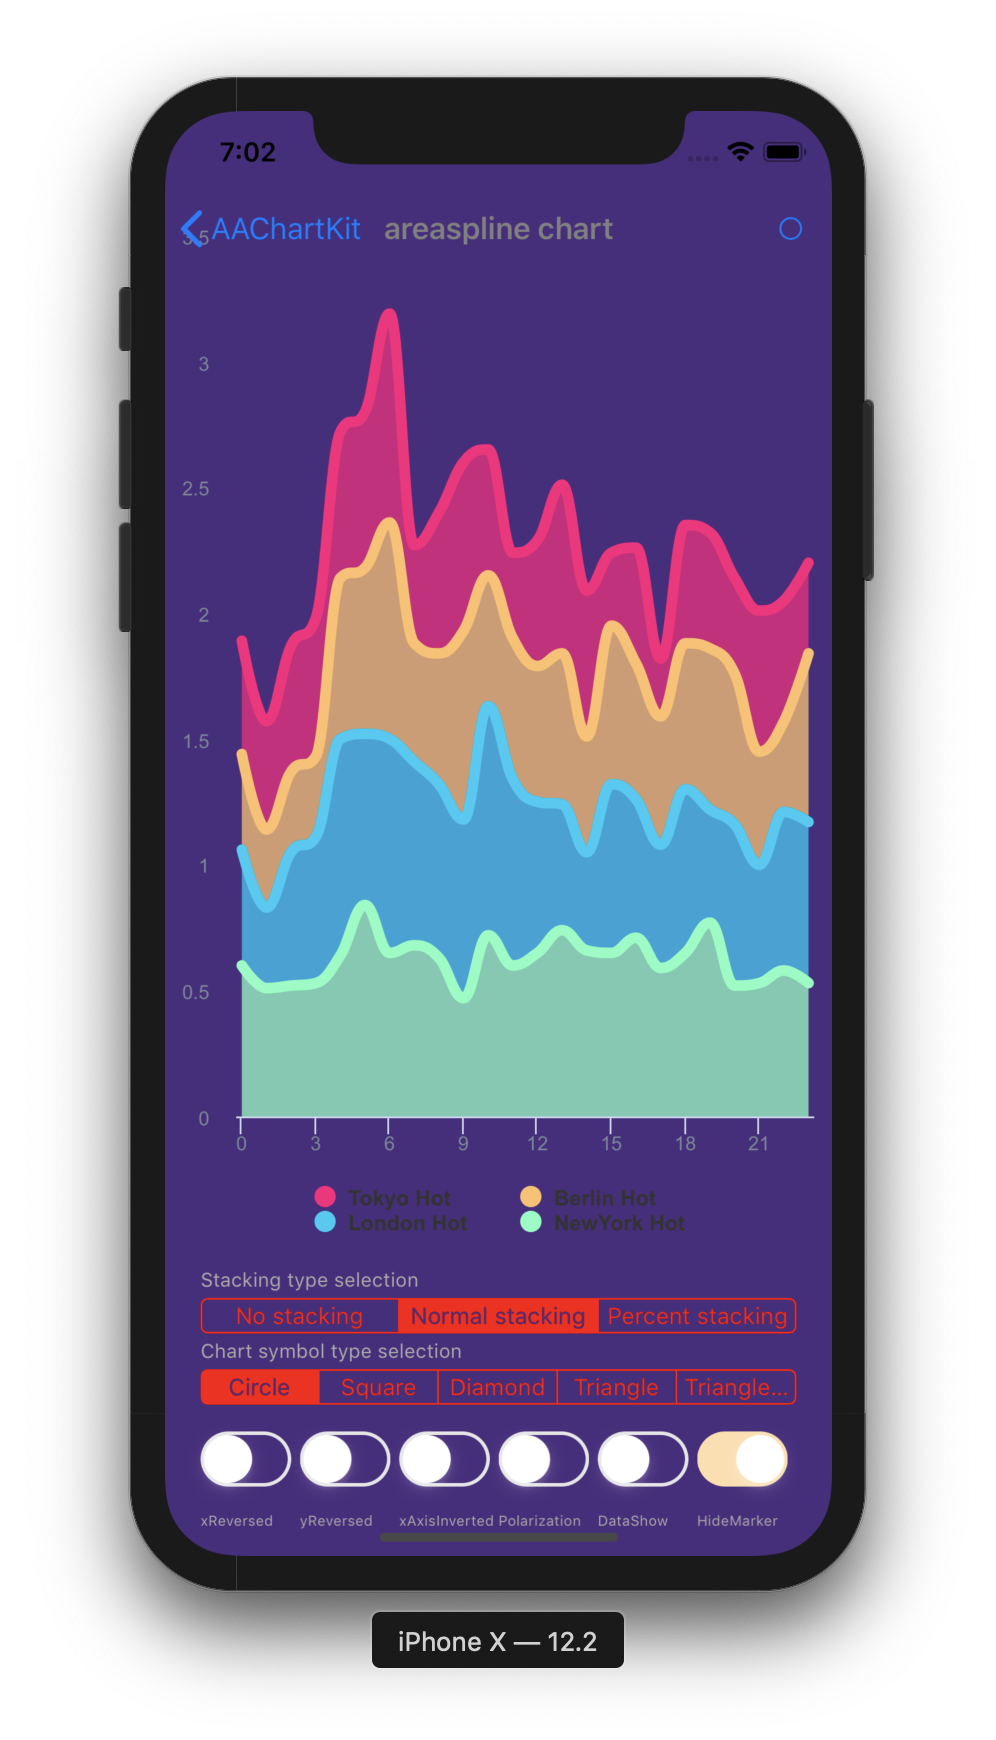
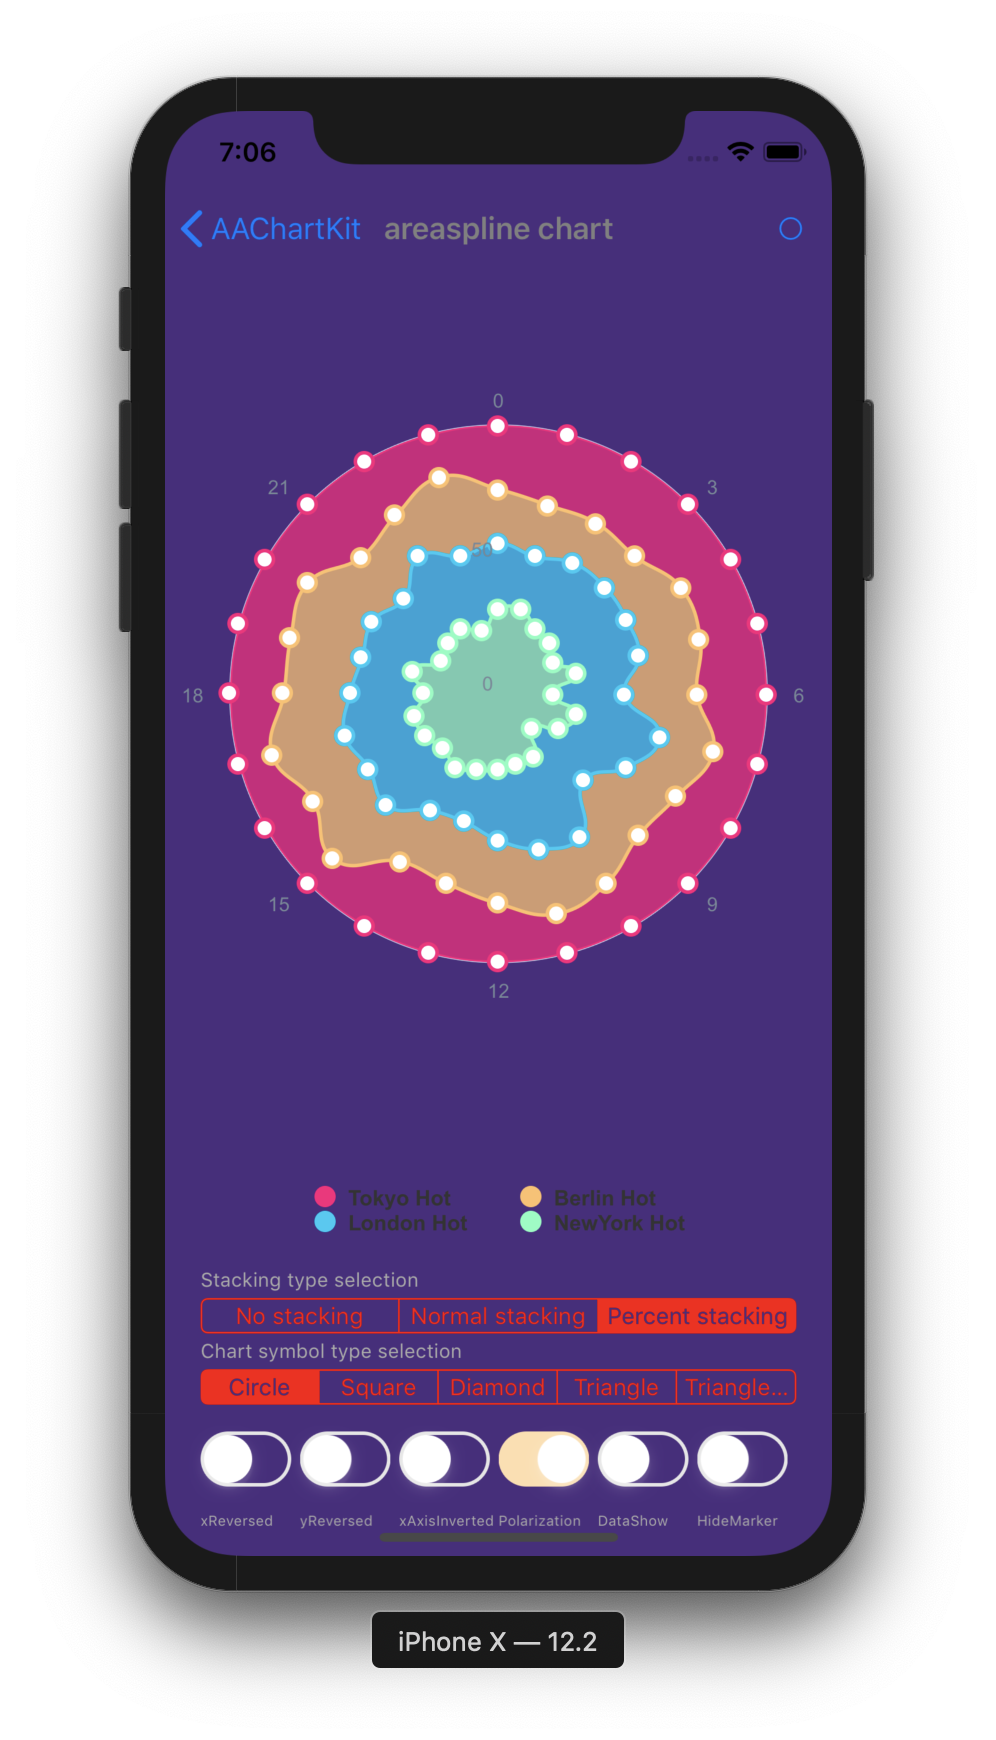
Appreciation




Installation
Gradle
Step 1. Add the JitPack repository to your build file
Add it in your root build.gradle at the end of repositories:
allprojects {
		repositories {
			...
			maven { url 'https://www.jitpack.io' }
		}
	}
Step 2. Add the dependency
dependencies {
	        implementation 'com.github.AAChartModel:AAChartCore-Kotlin:-SNAPSHOT'
	}
You're all set, enjoy!
Usage
- Create the instance object of chart view:
AAChartView
<com.github.aachartmodel.aainfographics.aachartcreator.AAChartView
        android:id="@+id/aachartview"
        android:layoutwidth="matchparent"
        android:layoutheight="matchparent">
</com.github.aachartmodel.aainfographics.aachartcreator.AAChartView>
val aaChartView = findViewById<AAChartView>(R.id.aachartview)- Configure the properties of chart model:
AAChartModel
val aaChartModel : AAChartModel = AAChartModel()
    .chartType(AAChartType.Area)
    .title("title")
    .subtitle("subtitle")
    .backgroundColor("#4b2b7f")
    .dataLabelsEnabled(true)
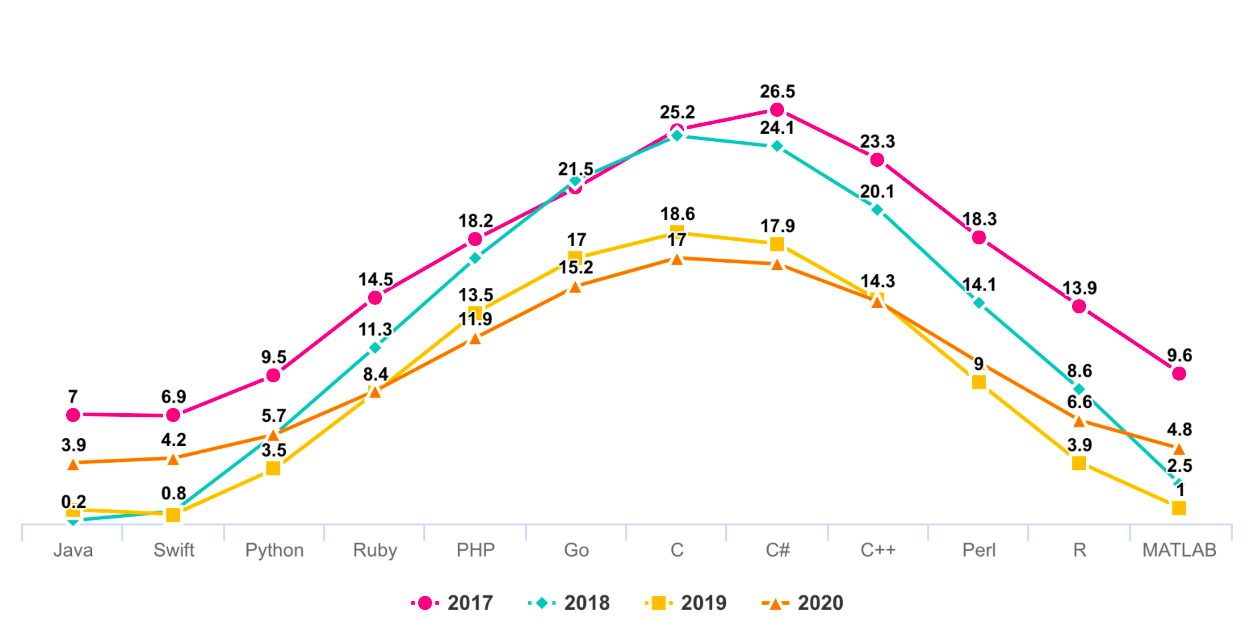
    .series(arrayOf(
        AASeriesElement()
            .name("Tokyo")
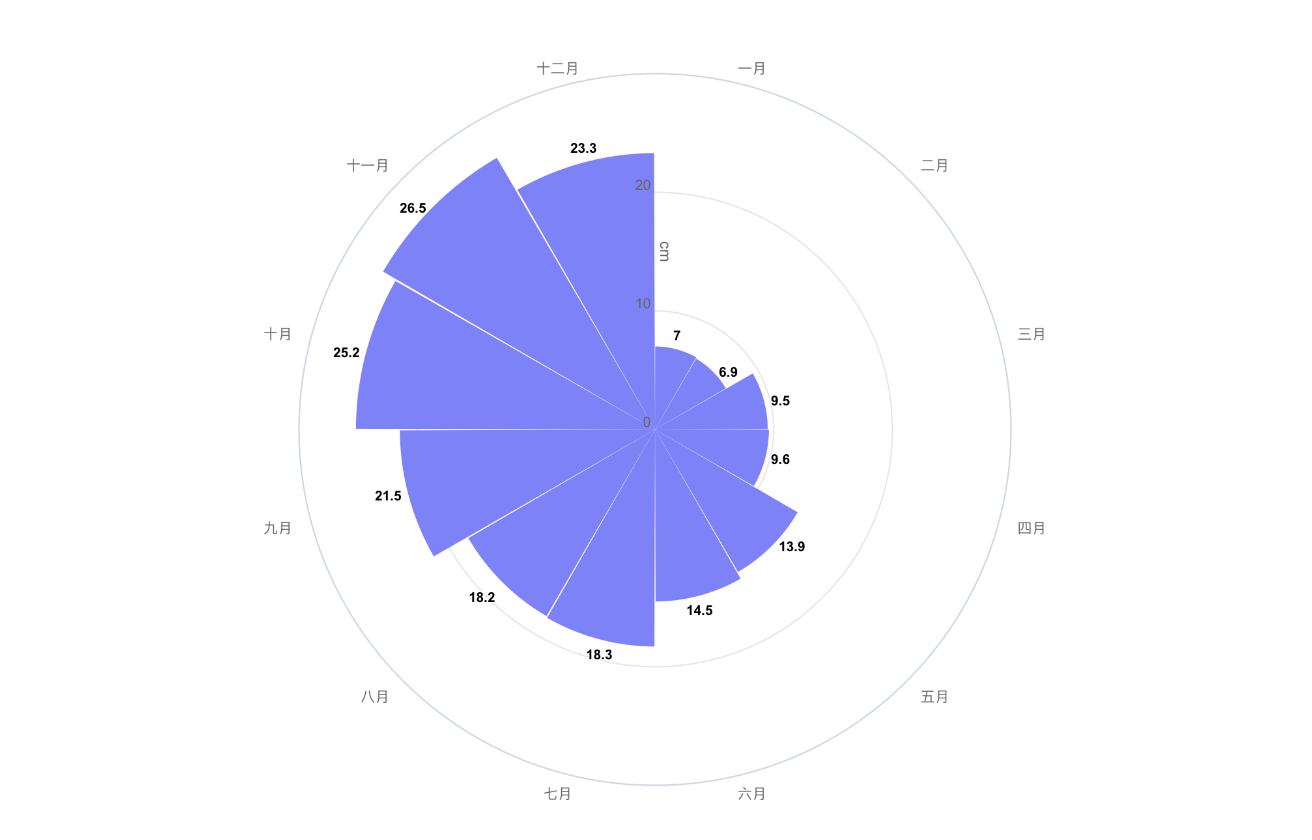
            .data(arrayOf(7.0, 6.9, 9.5, 14.5, 18.2, 21.5, 25.2, 26.5, 23.3, 18.3, 13.9, 9.6)),
        AASeriesElement()
            .name("NewYork")
            .data(arrayOf(0.2, 0.8, 5.7, 11.3, 17.0, 22.0, 24.8, 24.1, 20.1, 14.1, 8.6, 2.5)),
        AASeriesElement()
            .name("London")
            .data(arrayOf(0.9, 0.6, 3.5, 8.4, 13.5, 17.0, 18.6, 17.9, 14.3, 9.0, 3.9, 1.0)),
        AASeriesElement()
            .name("Berlin")
            .data(arrayOf(3.9, 4.2, 5.7, 8.5, 11.9, 15.2, 17.0, 16.6, 14.2, 10.3, 6.6, 4.8))
    )
)- Draw the chart(This method is called only for the first time after you create an AAChartView instance object)
//The chart view object calls the instance object of AAChartModel and draws the final graphic
aaChartView.aa_drawChartWithChartModel(aaChartModel)- Finally add this line to your proguard file:
-keep class com.github.aachartmodel.aainfographics.* { ; }🌹🌹🌹Congratulations! Everything was done!!! You will get what you want!!!
Update chart content
if you want to refresh chart content,you should do something as follow.According to your actual needs, select the function that fits you.- Only refresh the chart data(This method is recommended to be called for updating the series data dynamically)
//Only refresh the chart series data
aaChartView.aa_onlyRefreshTheChartDataWithChartModelSeries(chartModelSeriesArray)- Refresh the chart, minus the chart data (this method is recommended for subsequent refreshes after the first drawing of graphics has completed. If you want to update the chart data only, you should use the function
aa_onlyRefreshTheChartDataWithChartModelSeries)
//Refresh the chart after the AAChartModel whole content is updated
        aaChartView.aa_refreshChartWholeContentWithChartModel(aaChartModel)
Infographics sample
- ### line chart
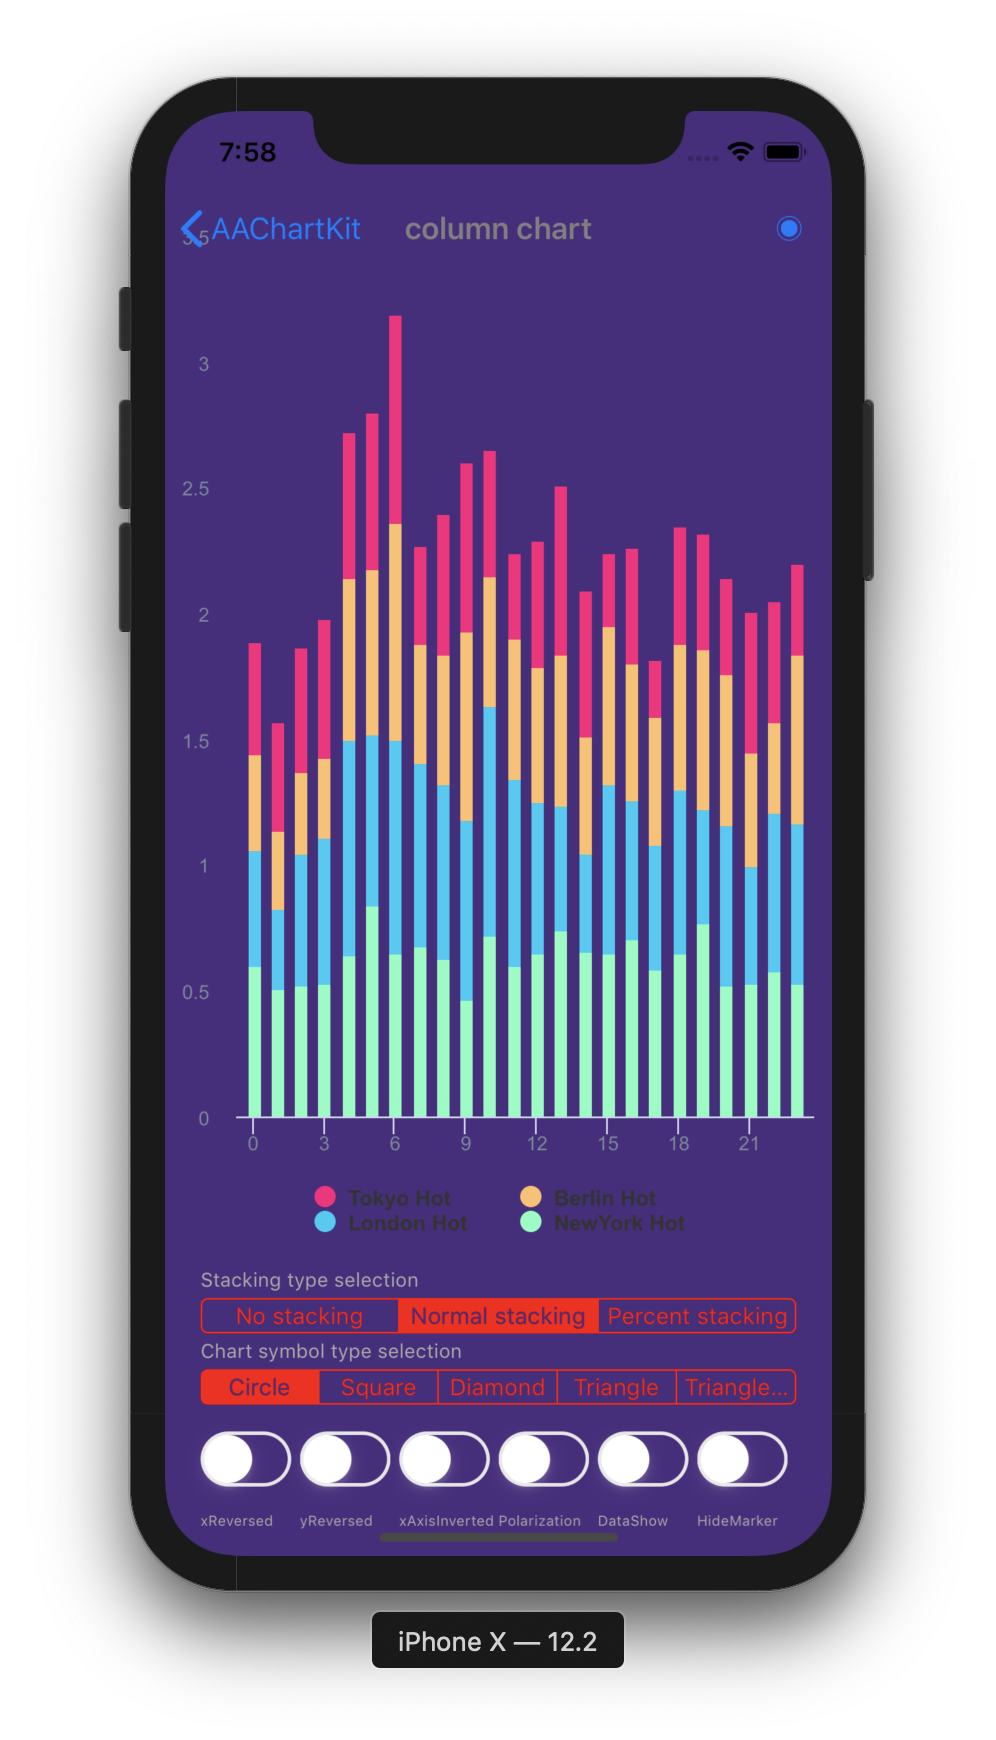
- ### column chart
- ### bar chart
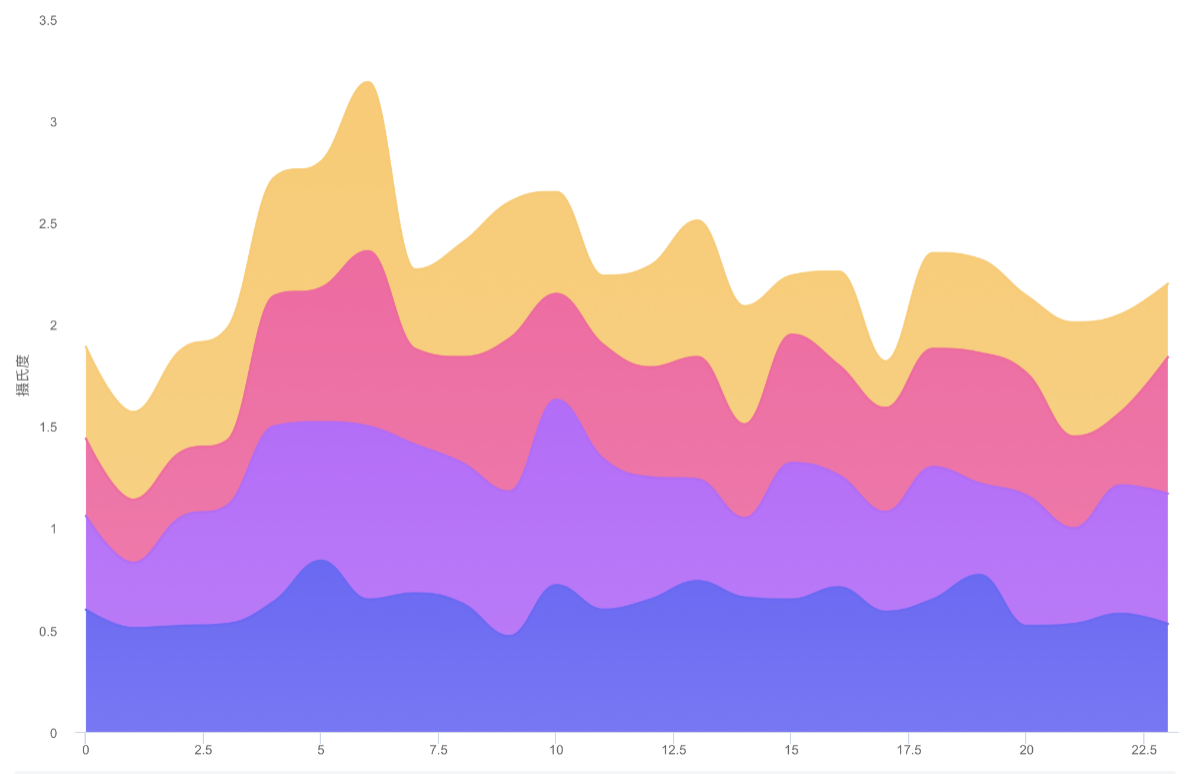
- ### special area chart one

- ### special area chart two
- ### special area chart three
- ### polar chart
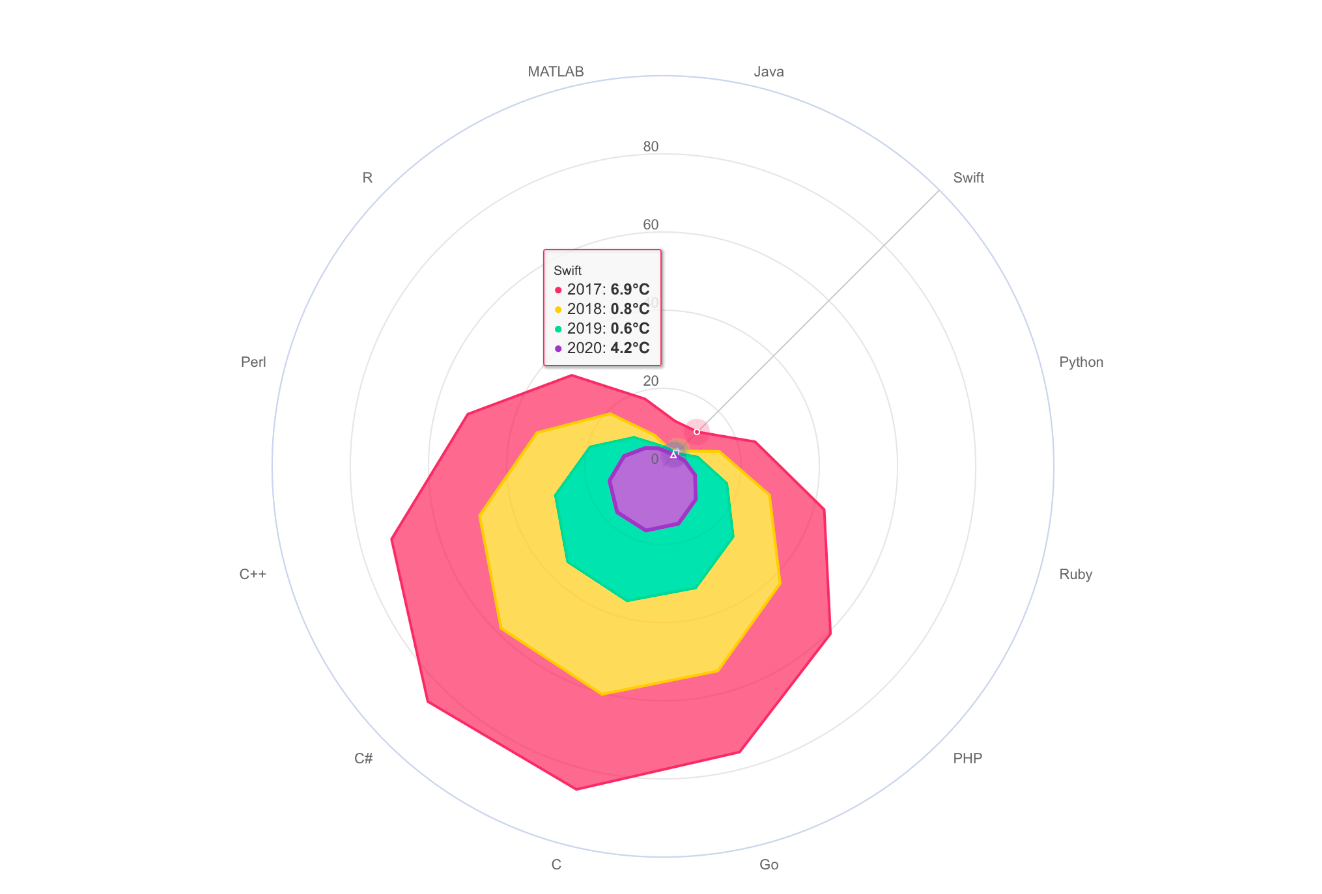
- ### radar chart
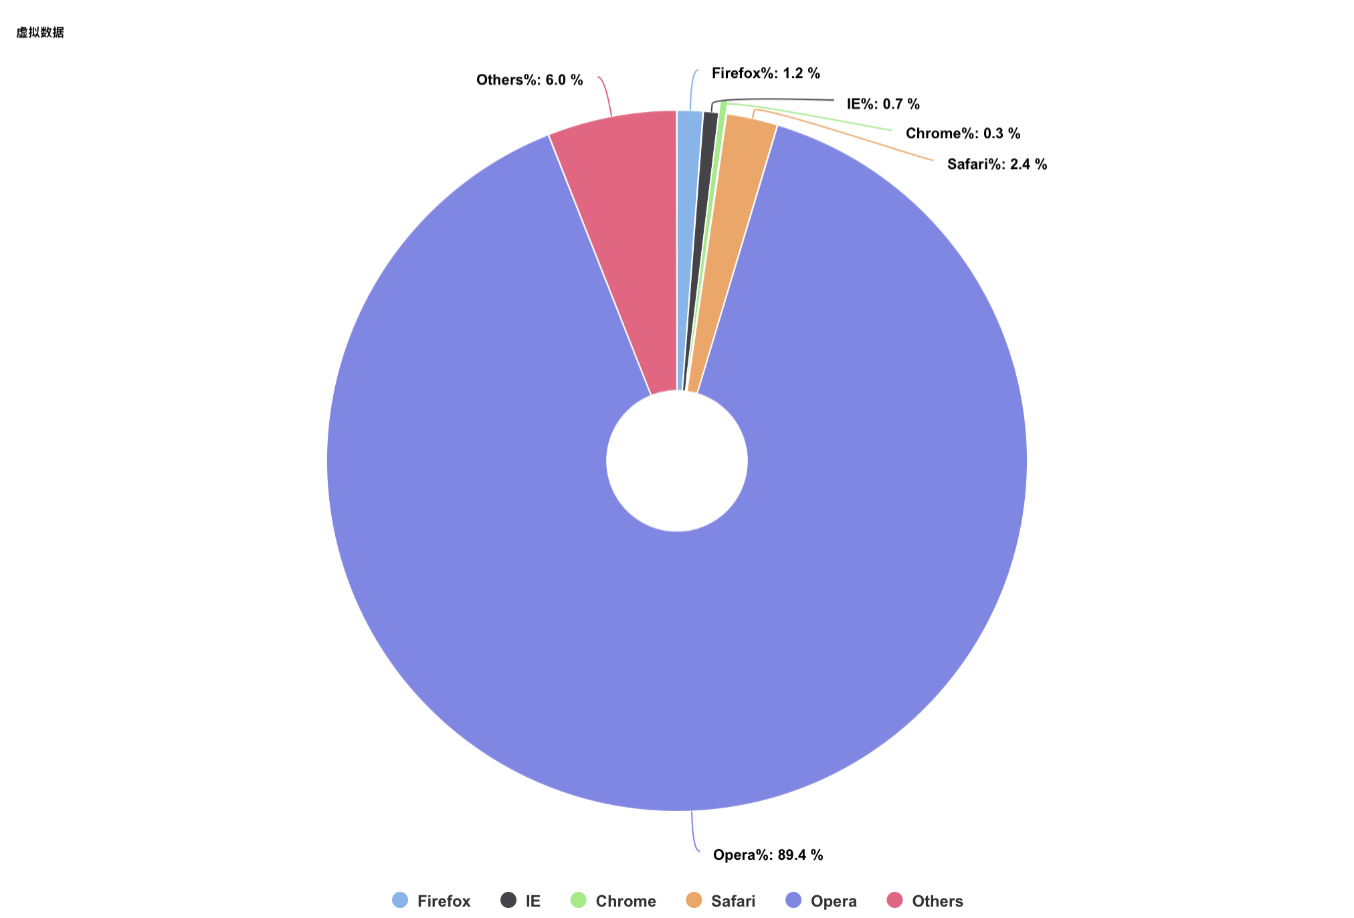
- ### pie chart
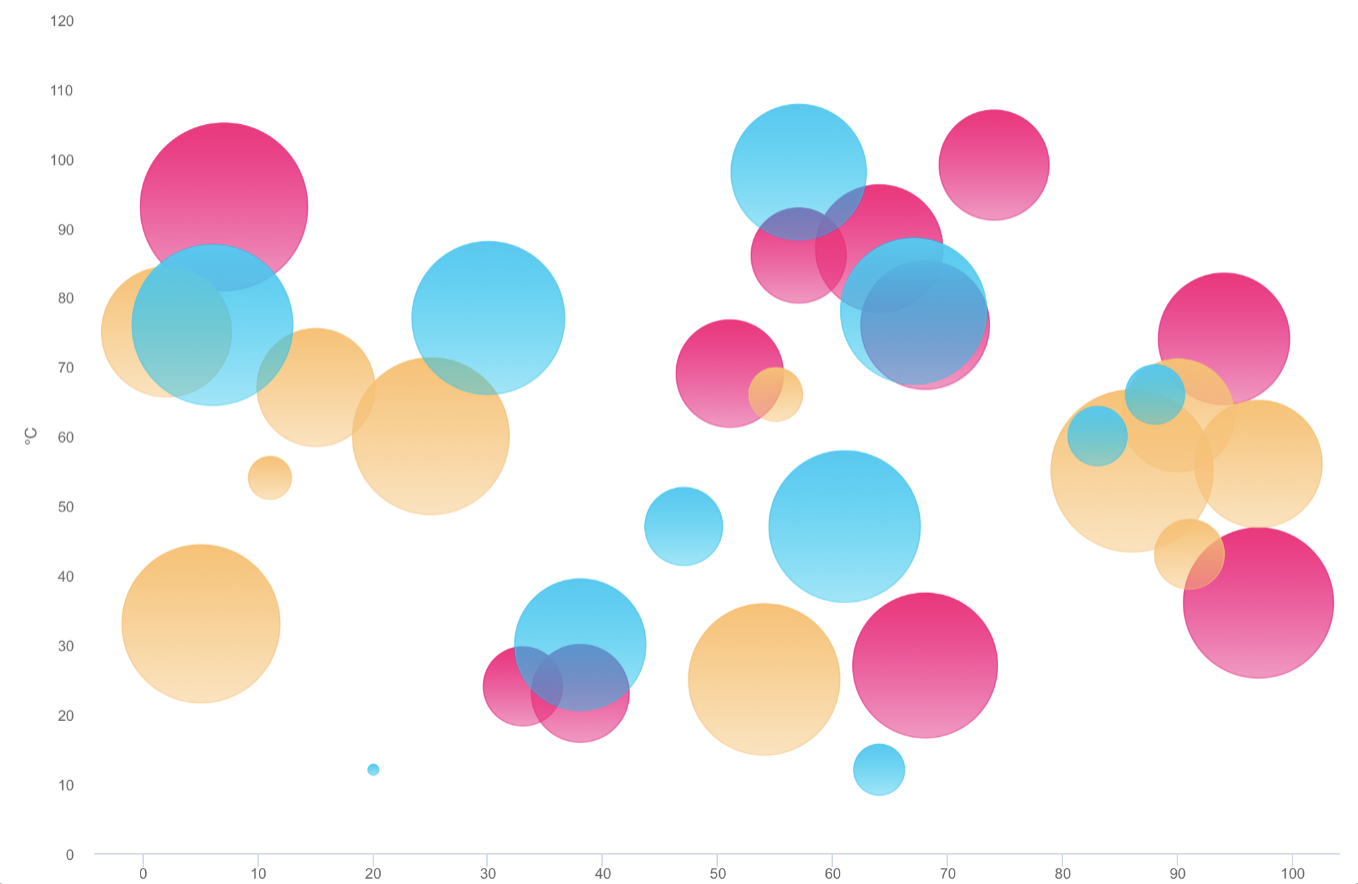
- ### bubble chart
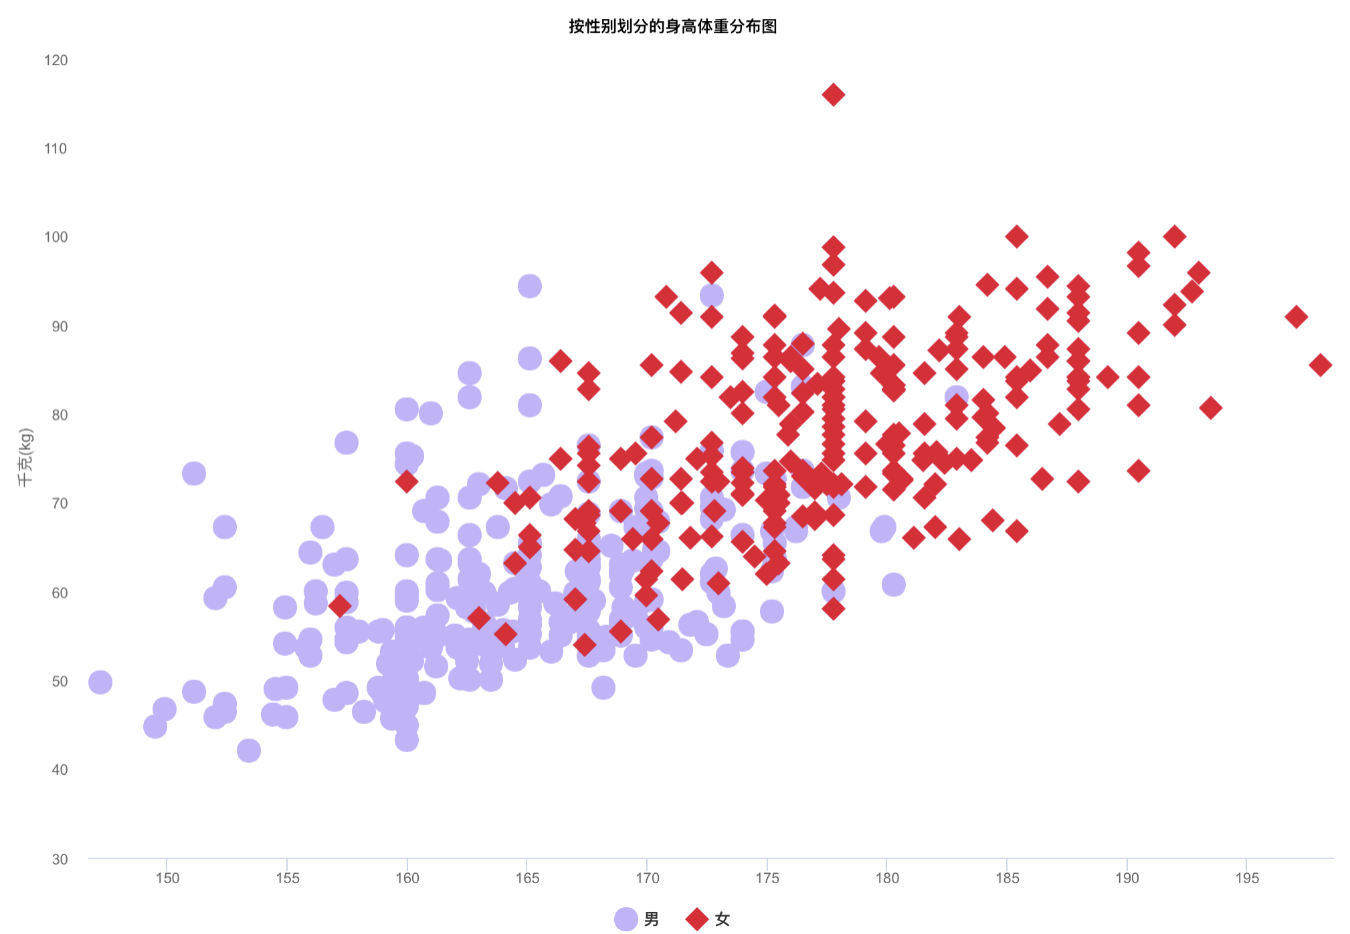
- ### scatter chart
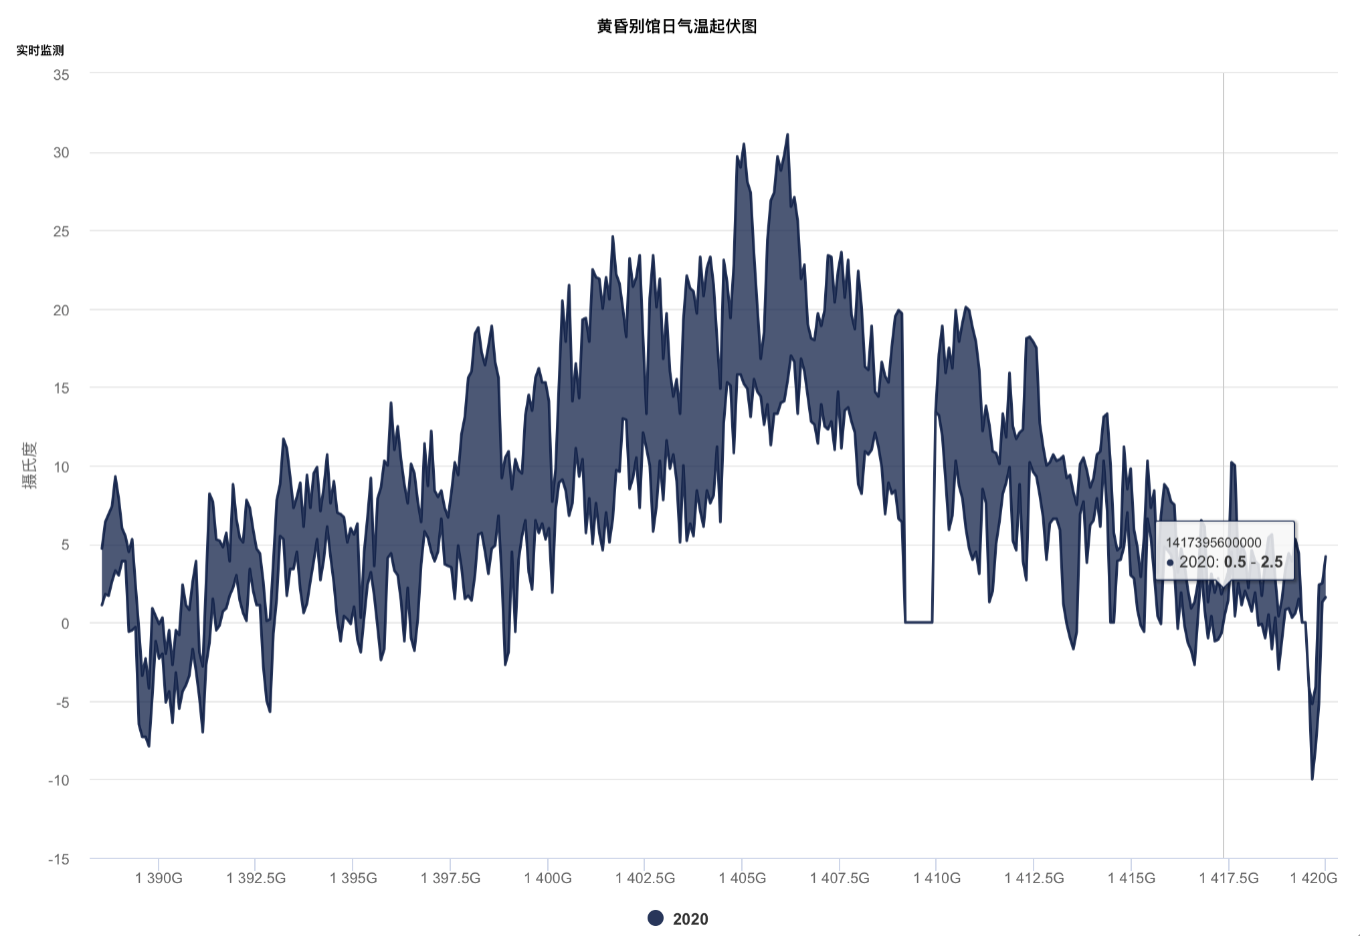
- ### arearange chart
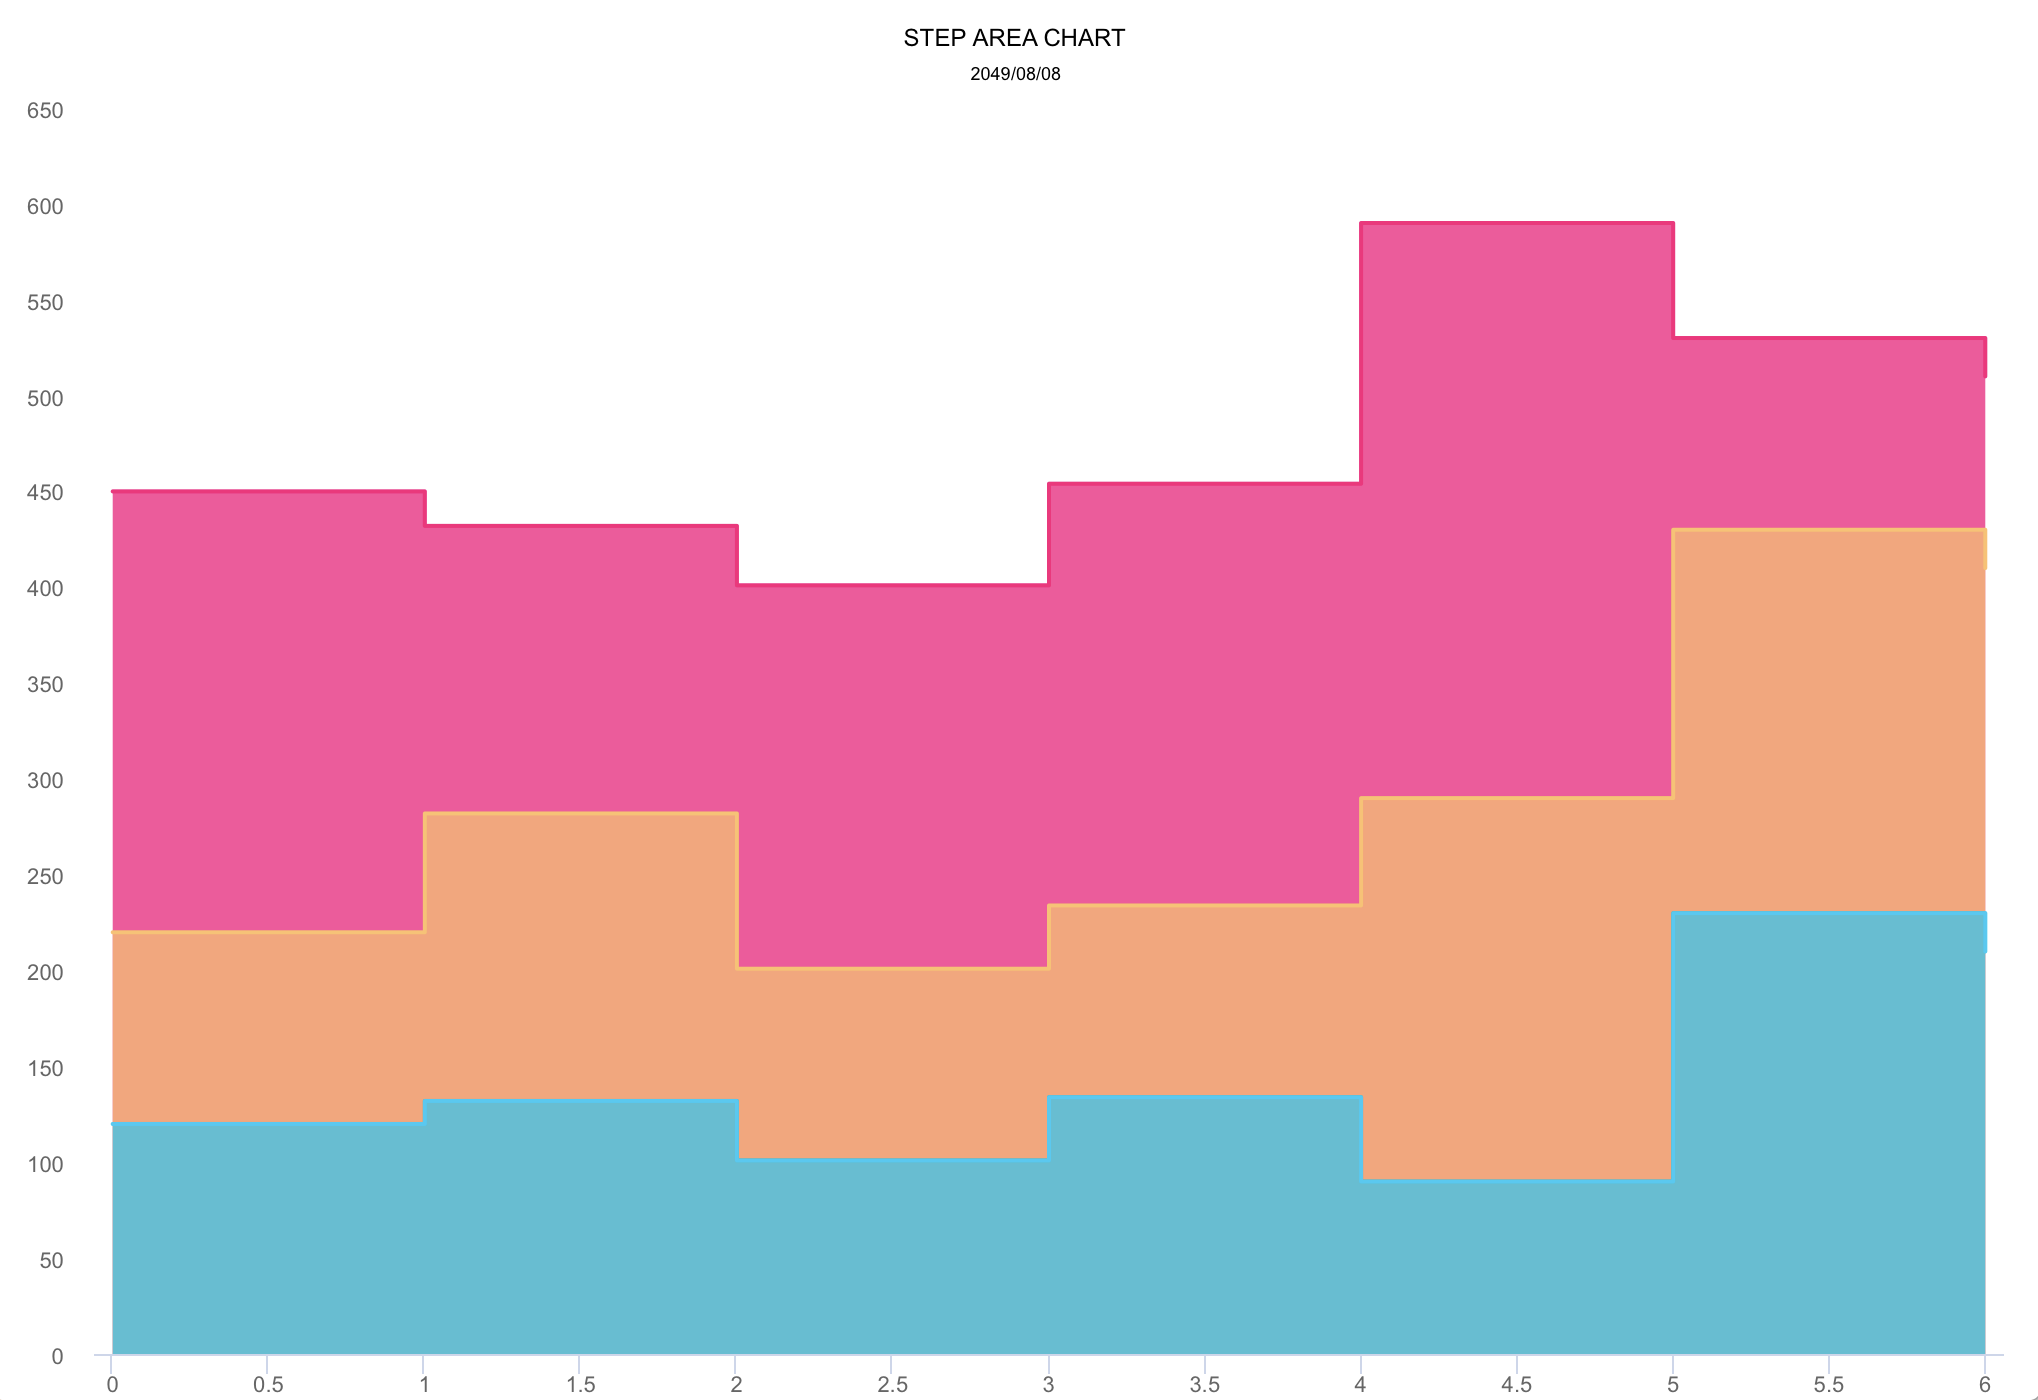
- ### step area chart
- ### mixed chart
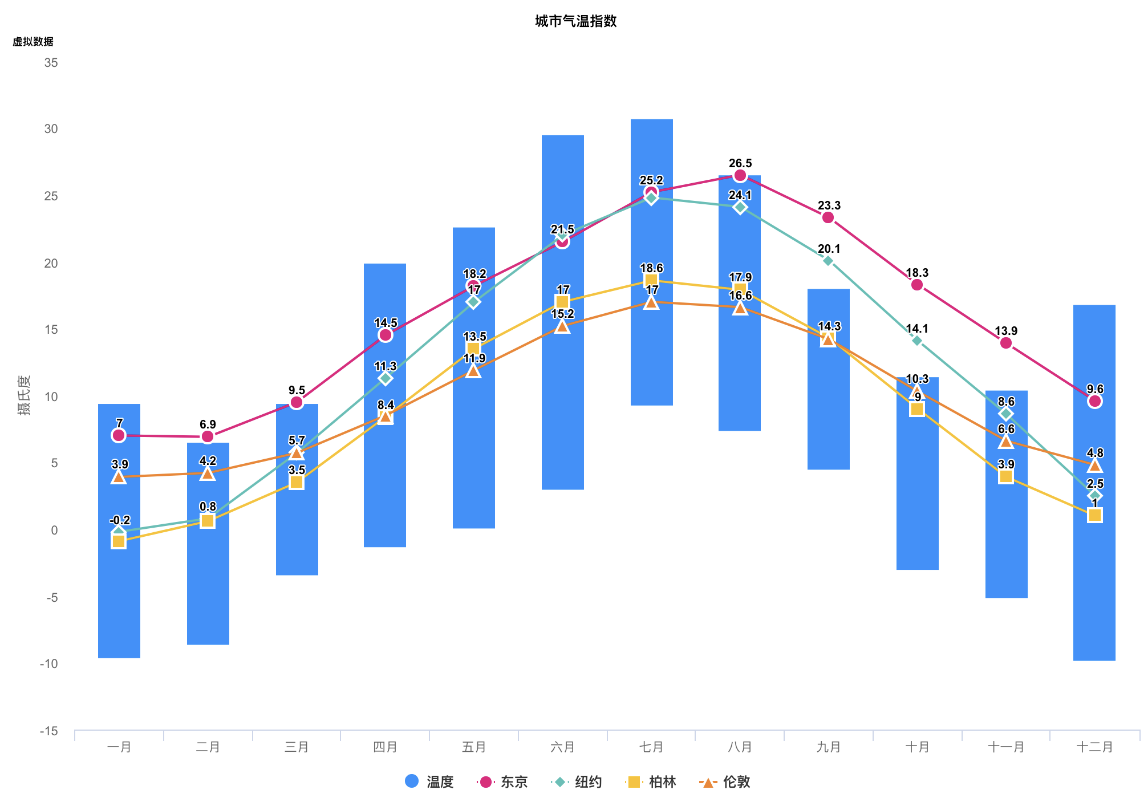
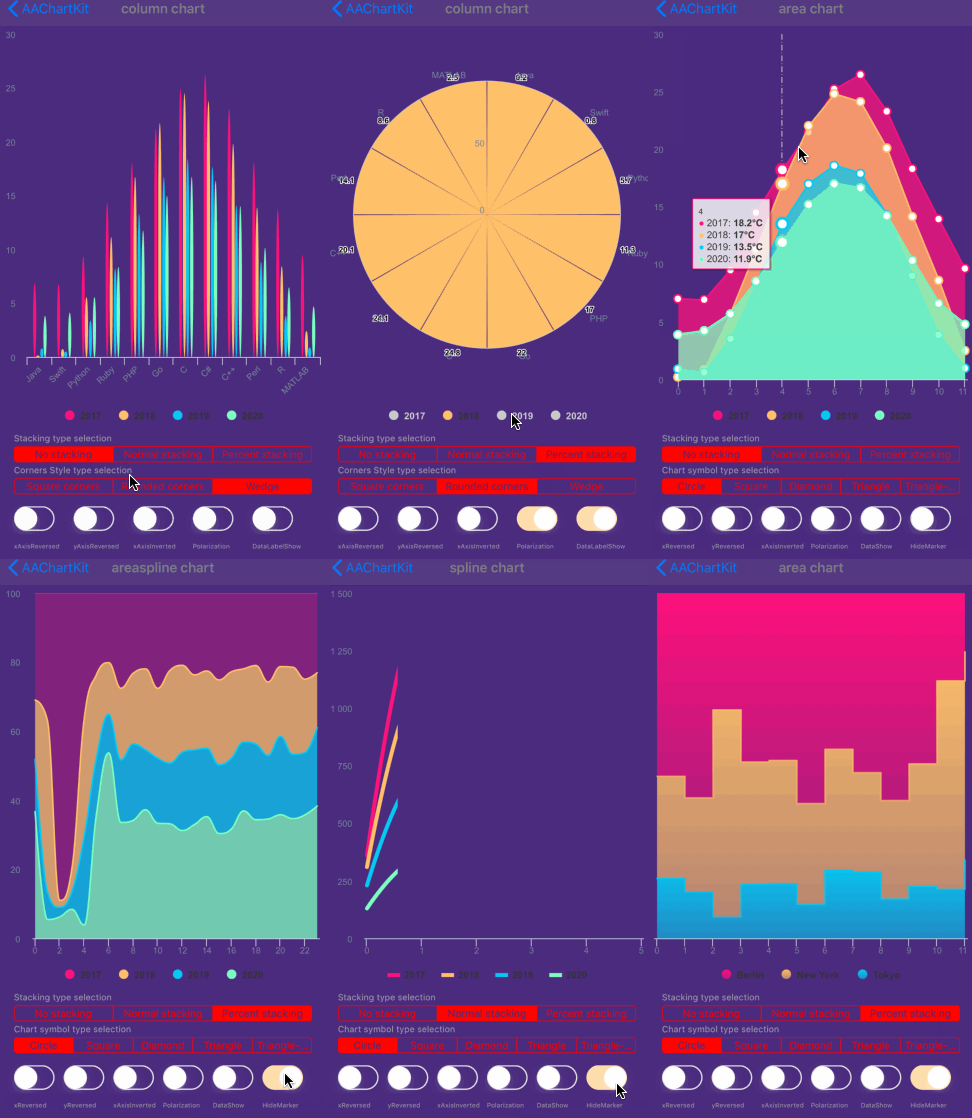
More graphics
>>> Note: The following DEMO picture is a GIF dynamic picture which has a size of around 6M*. If you don't see any dynamic preview, then this is because the picture resources were not fully loaded. In such a case please be patient and wait for the contents to finish loading. Maybe you need to reload this page.
Special instructions
Support user click events and move over events
you can monitor the user touch events message through implementing delegate function for AAChartView instance object
interface AAChartViewCallBack {
        fun chartViewMoveOverEventMessage(aaChartView: AAChartView, messageModel: AAMoveOverEventMessageModel)
    }
The received touch events message contain following content
class AAMoveOverEventMessageModel {
    var name: String? = null
    var x: Double? = null
    var y: Double? = null
    var category: String? = null
    var offset: LinkedTreeMap<, >? = null
    var index: Double? = null
}
Support for custom the style of chart AATooltip through JavaScript function
As we all know, AAInfographics support using HTML String. Most of time, the headerFormat 、pointFormat、footerFormat HTML string is enough for customizing chart tooltip string content, However, sometimes the needs of APP is so weird to satified, in this time, you can even customize the chart tooltip style through JavaScript function.
For example, configuring AATooltip instance object properties as follow:
val aaTooltip = AATooltip()
            .useHTML(true)
            .formatter(
             """
function () {
        return ' 🌕 🌖 🌗 🌘 🌑 🌒 🌓 🌔 <br/> '
        + ' Support JavaScript Function Just Right Now !!! <br/> '
        + ' The Gold Price For <b>2020 '
        +  this.x
        + ' </b> Is <b> '
        +  this.y
        + ' </b> Dollars ';
        }
             """.trimIndent()
            )
            .valueDecimals(2)//设置取值精确到小数点后几位//设置取值精确到小数点后几位
            .backgroundColor("#000000")
            .borderColor("#000000")
            .style(
                AAStyle()
                    .color("#FFD700")
                    .fontSize("12 px")
            )
you can get the customized tooltip style chart like this👇 
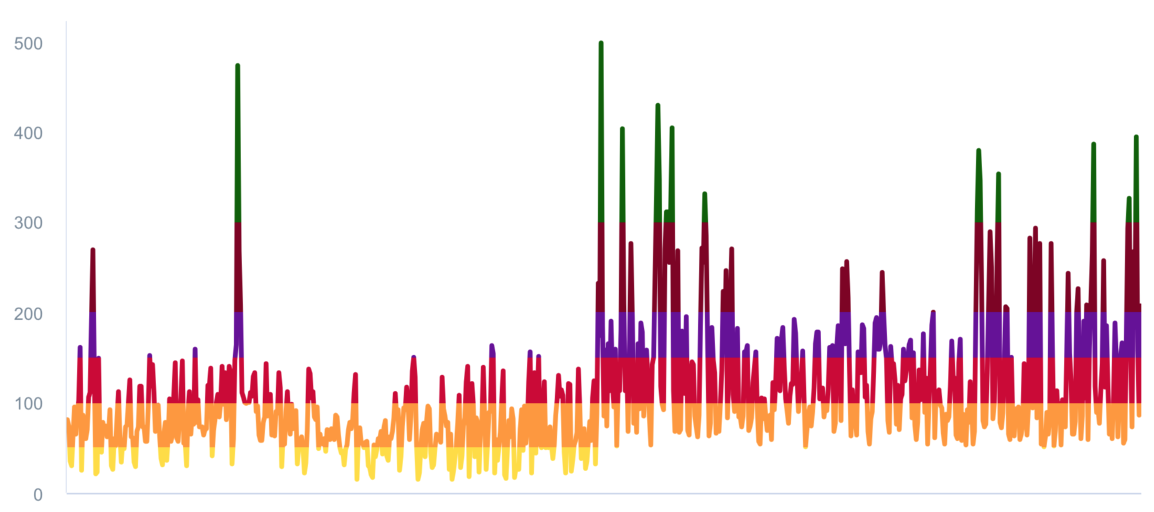
Support value range segmentation
- chart with value range segmentation
bands 🎀
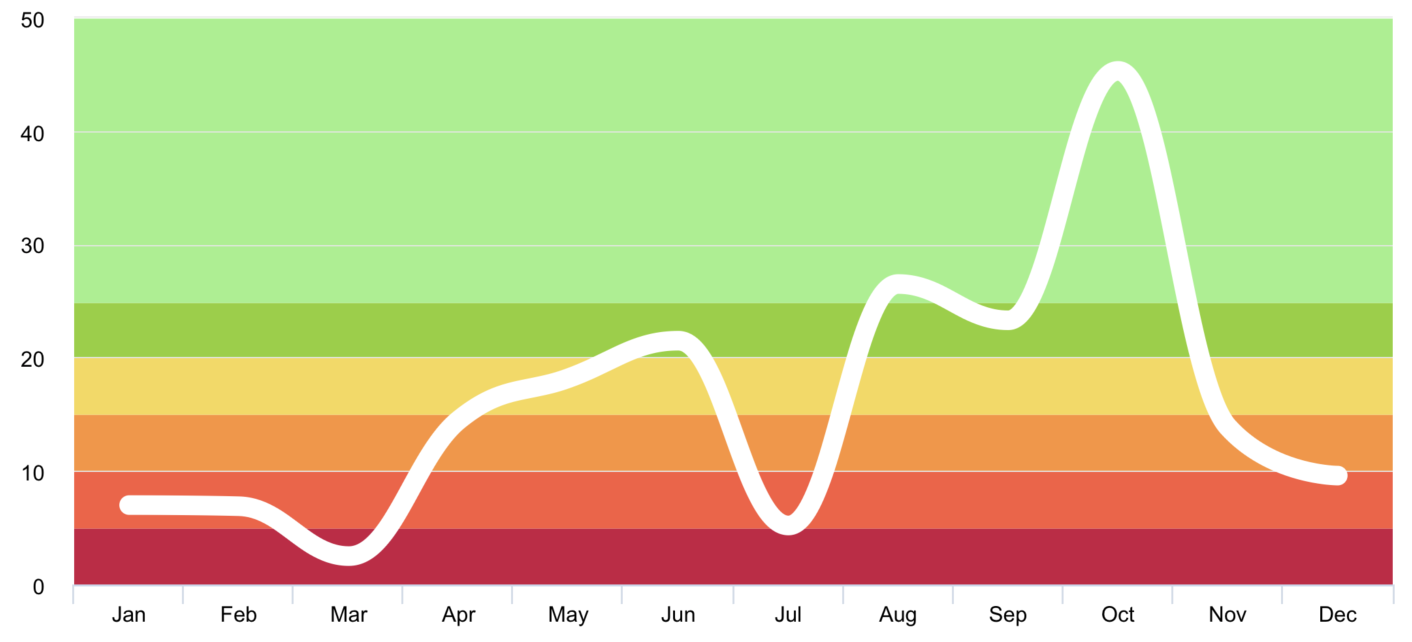
- chart with value range segmentation
lines 🧶
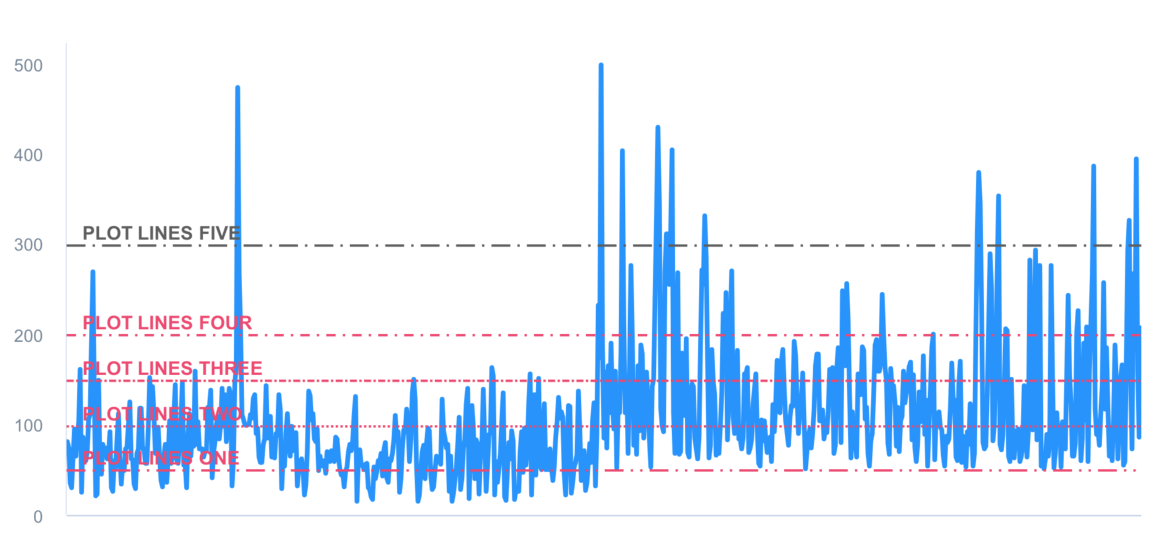
- chart with value range segmentation
zones 🧱
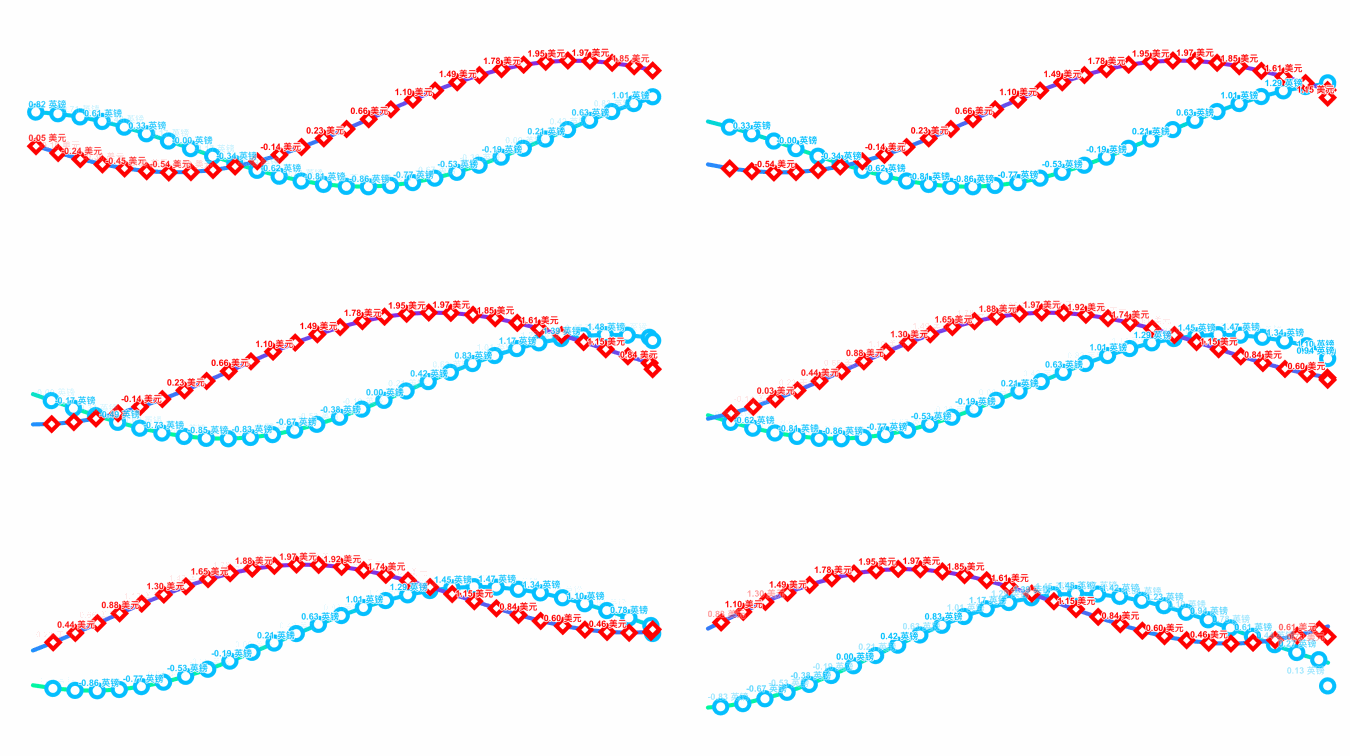
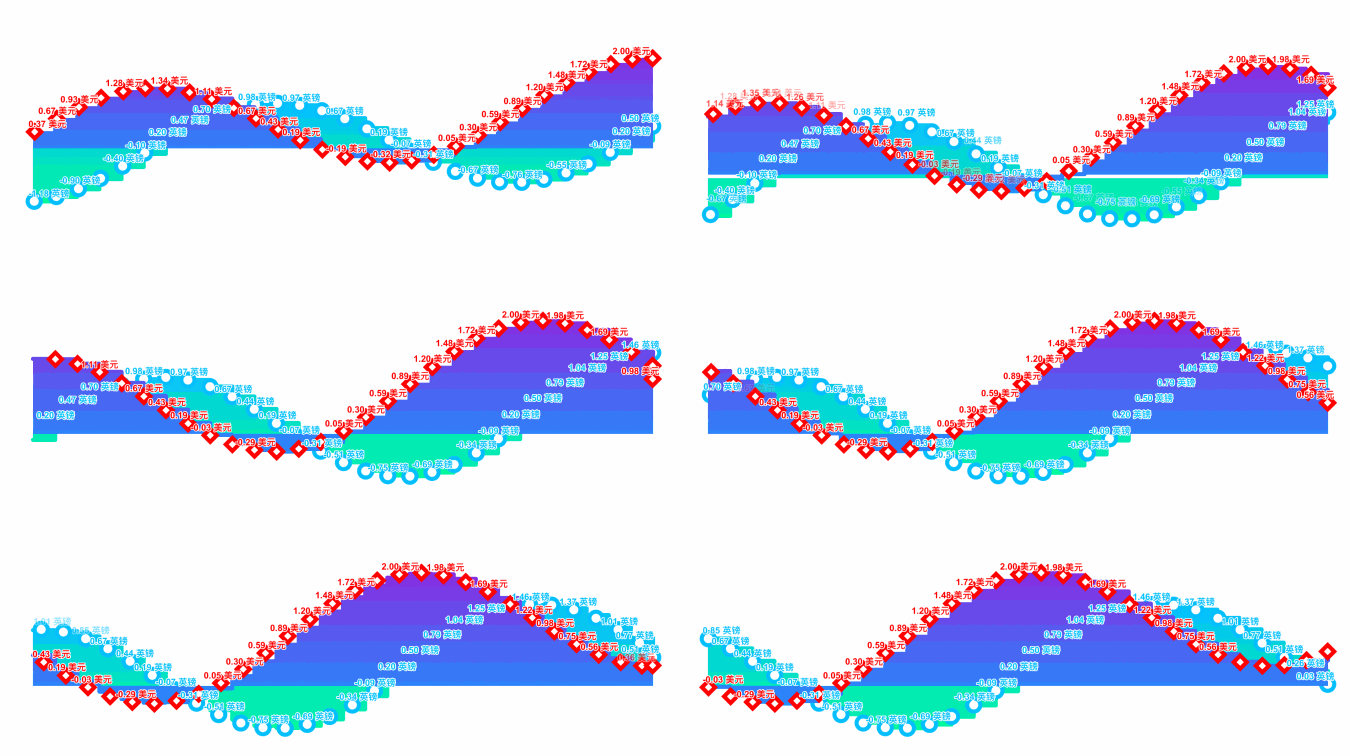
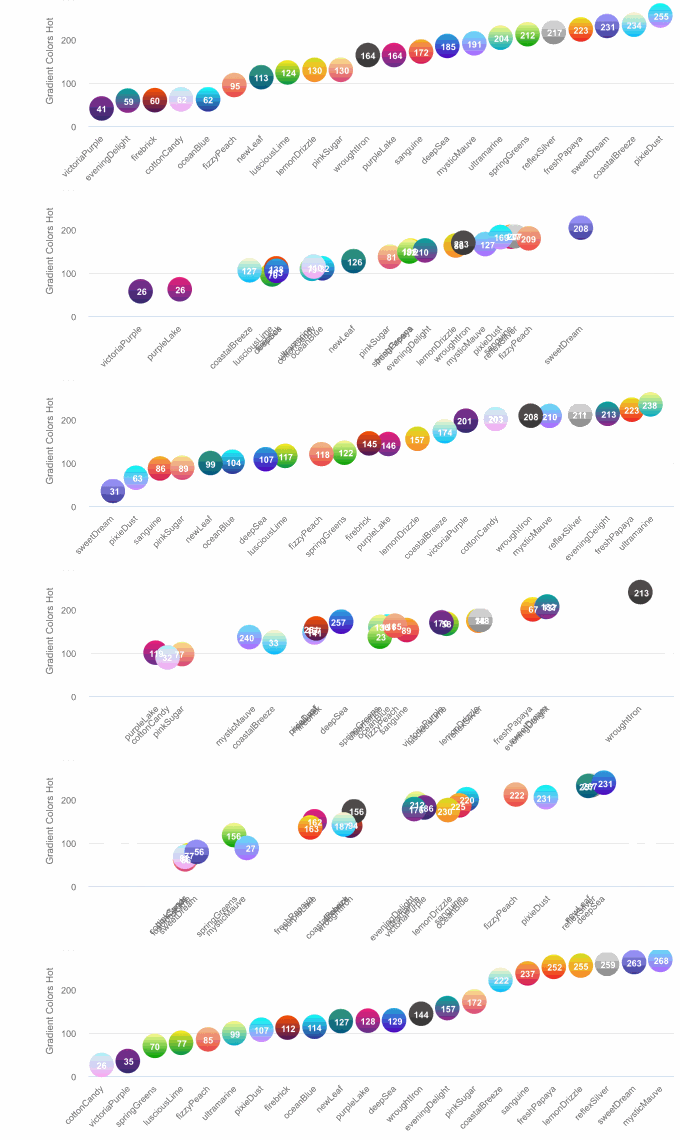
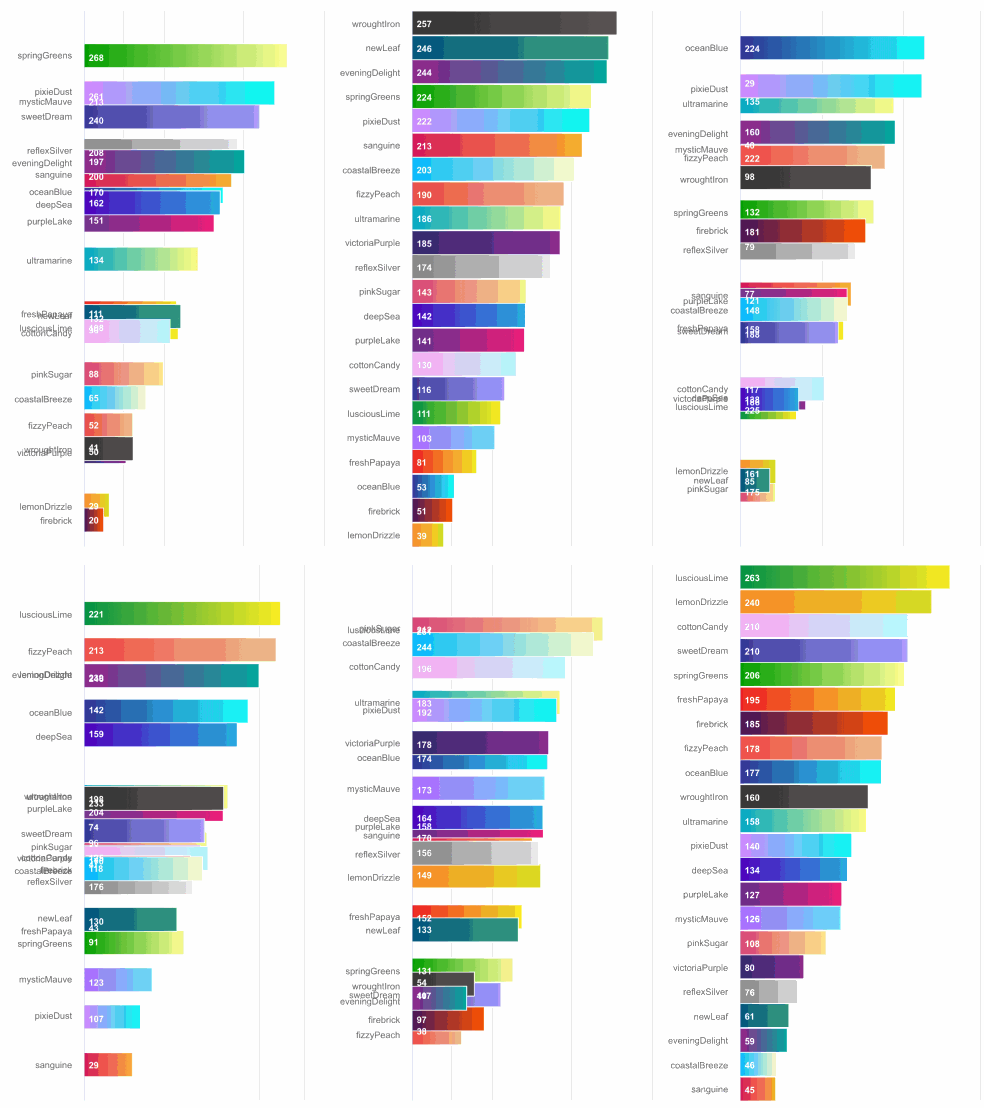
Support scrolling update chart data

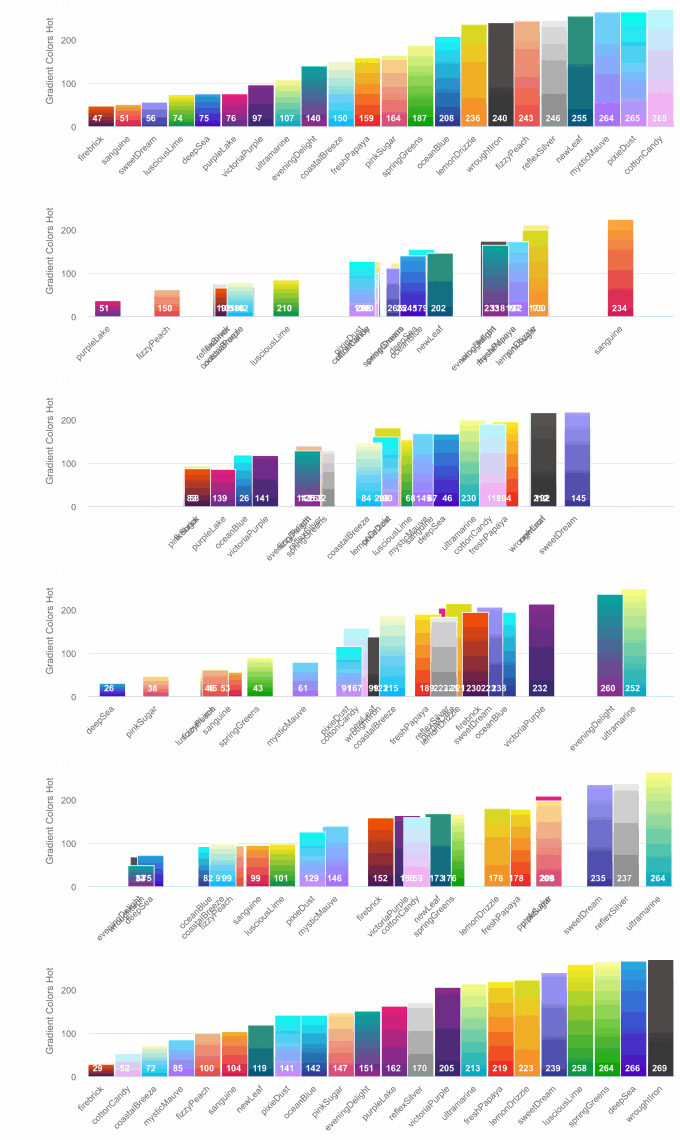
Support data sorting with animation effect
Supported chart type for now
enum class AAChartType(val value: String) {
    Column          ("column"),
    Bar             ("bar"),
    Area            ("area"),
    Areaspline      ("areaspline"),
    Line            ("line"),
    Spline          ("spline"),
    Scatter         ("scatter"),
    Pie             ("pie"),
    Bubble          ("bubble"),
    Pyramid         ("pyramid"),
    Funnel          ("funnel"),
    Columnrange     ("columnrange"),
    Arearange       ("arearange"),
    Areasplinerange ("areasplinerange"),
    Boxplot         ("boxplot"),
    Waterfall       ("waterfall"),
    Polygon         ("polygon")
}
Supported zoom guesture types for now
enum class AAChartZoomType(val value: String) {
    None ("none"),
    X    ("x"),
    Y    ("y"),
    XY   ("xy"),
}
Supported animation type for now
enum class AAChartAnimationType(val value :String){
    EaseInQuad     ("easeInQuad"),
    EaseOutQuad    ("easeOutQuad"),
    EaseInOutQuad  ("easeInOutQuad"),
    EaseInCubic    ("easeInCubic"),
    EaseOutCubic   ("easeOutCubic"),
    EaseInOutCubic ("easeInOutCubic"),
    EaseInQuart    ("easeInQuart"),
    EaseOutQuart   ("easeOutQuart"),
    EaseInOutQuart ("easeInOutQuart"),
    EaseInQuint    ("easeInQuint"),
    EaseOutQuint   ("easeOutQuint"),
    EaseInOutQuint ("easeInOutQuint"),
    EaseInSine     ("easeInSine"),
    EaseOutSine    ("easeOutSine"),
    EaseInOutSine  ("easeInOutSine"),
    EaseInExpo     ("easeInExpo"),
    EaseOutExpo    ("easeOutExpo"),
    EaseInOutExpo  ("easeInOutExpo"),
    EaseInCirc     ("easeInCirc"),
    EaseOutCirc    ("easeOutCirc"),
    EaseInOutCirc  ("easeInOutCirc"),
    EaseOutBounce  ("easeOutBounce"),
    EaseInBack     ("easeInBack"),
    EaseOutBack    ("easeOutBack"),
    EaseInOutBack  ("easeInOutBack"),
    Elastic        ("elastic"),
    SwingFromTo    ("swingFromTo"),
    SwingFrom      ("swingFrom"),
    SwingTo        ("swingTo"),
    Bounce         ("bounce"),
    BouncePast     ("bouncePast"),
    EaseFromTo     ("easeFromTo"),
    EaseFrom       ("easeFrom"),
    EaseTo         ("easeTo"),
}
Here are the ten concrete animation types of AAInfographics
| Back | Bounce | Circ | Cubic | Elastic | |:---------:|:---------:|:---------:|:---------:|:---------:| | ![][1] | ![][2] | ![][3] | ![][4] | ![][5] |
| Expo | Quad | Quart | Quint | Sine | |:---------:|:---------:|:---------:|:---------:|:---------:| | ![][6] | ![][7] | ![][8] | ![][9] | ![][10] |
About AAChartModel
- ### AAChartModel:chart basic properties instruction
AAChartType. | AAChartType.Column, AAChartType.Bar,
AAChartType.Area,
AAChartType.AreaSpline,
AAChartType.Line,
AAChartType.Spline,
AAChartType.Pie,
AAChartType.Bubble,
AAChartType.Scatter,
AAChartType.Pyramid,
AAChartType.Funnel,
AAChartType.Arearange,
AAChartType.Columnrange | stacking| Whether to stack the values of each series on top of each other. Possible values are null to disable, "normal" to stack by value or "percent". When stacking is enabled, data must be sorted in ascending X order | AAChartStackingType.None,
AAChartStackingType.Normal,
AAChartStackingType.Percent | symbol | A predefined shape or symbol for the marker. When null, the symbol is pulled from options.symbols. Other possible values are "circle", "square", "diamond", "triangle" and "triangle-down" | AAChartSymbolType.Circle,
AAChartSymbolType.Square,
AAChartSymbolType.Diamond,
AAChartSymbolType.Triangle,
AAChartSymbolType.TriangleDown | colorsTheme | the colors theme of chart style |default value is
arrayOf("#fe117c", "#ffc069", "#06caf4", "#7dffc0") |
series | the series data of chart | a list made of AASeriesElement instance objects ,every AASeriesElement has its own type 、name、data、color、opacity value ect |
More detailed chart property setting parameters can be found in the ʻAAChartModel and ʻAAOptions files. For details, please refer to the ʻAAChartCore-Kotlin(AAInfographics) source code.
Created By

Source Code⛓
Language Version | Project Name | Source Code Link | ------------ | ------------- | ------------- | Kotlin | AAInfographics | https://github.com/AAChartModel/AAChartCore-Kotlin | Java | AAChartCore | https://github.com/AAChartModel/AAChartCore | Swift | AAInfographics | https://github.com/AAChartModel/AAChartKit-Swift | Objective C | AAChartKit | https://github.com/AAChartModel/AAChartKit |
LICENSE

AAInfographics is available under the MIT license. See the LICENSE file for more information.
Contact
-------------------------------------------------------------------------------
- 🌕 🌖 🌗 🌘 WARM TIPS!!! 🌑 🌒 🌓 🌔
- Please contact me on GitHub,if there are any problems encountered in use.
- GitHub Issues : https://github.com/AAChartModel/AAChartCore-Kotlin/issues
- And if you want to contribute for this project, please contact me as well
- GitHub : https://github.com/AAChartModel
- StackOverflow : https://stackoverflow.com/users/7842508/codeforu
- JianShu : http://www.jianshu.com/u/f1e6753d4254
- SegmentFault : https://segmentfault.com/u/huanghunbieguan
Todo list
- [x] Support for the user to add delegate events after the graphics content loading was completed
- [x] Support graphics to refresh global content dynamically
- [x] Support graphics to refresh pure data (series
) content dynamically - [x] Support color layer gradient effects
- [x] Support horizontal screen (full screen) effect
- [x] Support setting graphics rendering animation freely
- [x] Support for users to configure AAOptions` model object properties freely
- [x] Support stacking the graphics
- [x] Support reversing the graphics axis
- [x] Support rendering the scatter chart
- [x] Support rendering the column range map
- [x] Support rendering the area range graph
- [x] Support rendering the polar chart
- [x] Support rendering the step line chart
- [x] Support rendering the step area chart
- [ ] Support rendering the rectangular tree hierarchy diagrams
- [ ] Support rendering the circular progress bar chart
- [ ] Support adding clicked event callbacks for graphics
- [ ] Support graphics to refresh pure data in real time and scroll dynamically
- [ ] Support rendered graphics to generate image files
- [ ] Support generating image files saved to the system album
[1]: https://raw.githubusercontent.com/adad184/MMTweenAnimation/master/Images/1.gif [2]: https://raw.githubusercontent.com/adad184/MMTweenAnimation/master/Images/2.gif [3]: https://raw.githubusercontent.com/adad184/MMTweenAnimation/master/Images/3.gif [4]: https://raw.githubusercontent.com/adad184/MMTweenAnimation/master/Images/4.gif [5]: https://raw.githubusercontent.com/adad184/MMTweenAnimation/master/Images/5.gif [6]: https://raw.githubusercontent.com/adad184/MMTweenAnimation/master/Images/6.gif [7]: https://raw.githubusercontent.com/adad184/MMTweenAnimation/master/Images/7.gif [8]: https://raw.githubusercontent.com/adad184/MMTweenAnimation/master/Images/8.gif [9]: https://raw.githubusercontent.com/adad184/MMTweenAnimation/master/Images/9.gif [10]: https://raw.githubusercontent.com/adad184/MMTweenAnimation/master/Images/10.gif


