
Python library that makes it easy for data scientists to create charts.
Last updated Jul 6, 2026
3.6k
Stars
330
Forks
54
Issues
+1
Stars/day
Attention Score
53
Language breakdown
Python 99.2%
Makefile 0.8%
▸ Files
click to expand
README
Chartify ========


Chartify is a Python library that makes it easy for data scientists to create charts.
Why use Chartify?
- Consistent input data format: Spend less time transforming data to get your charts to work. All plotting functions use a consistent tidy input data format.
- Smart default styles: Create pretty charts with very little customization required.
- Simple API: We've attempted to make the API as intuitive and easy to learn as possible.
- Flexibility: Chartify is built on top of Bokeh, so if you do need more control you can always fall back on Bokeh's API.
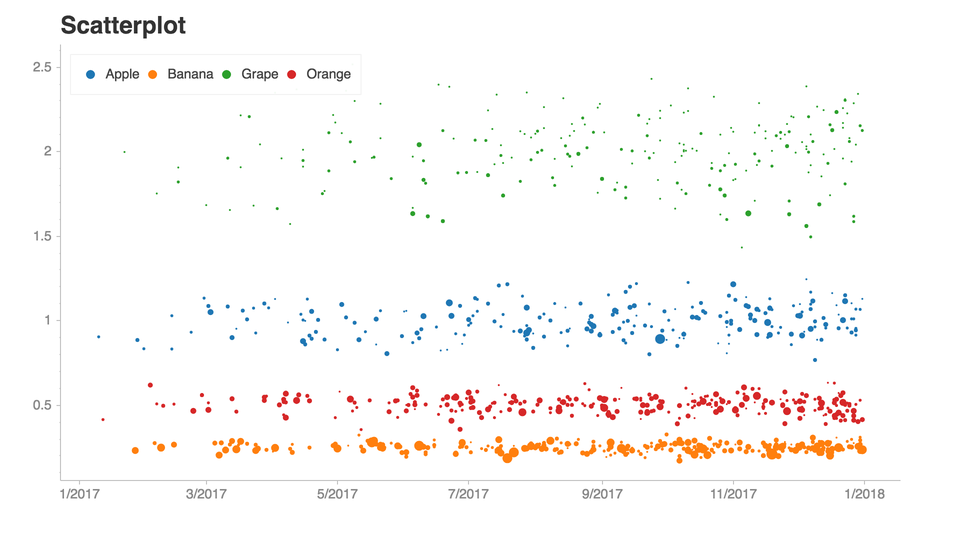
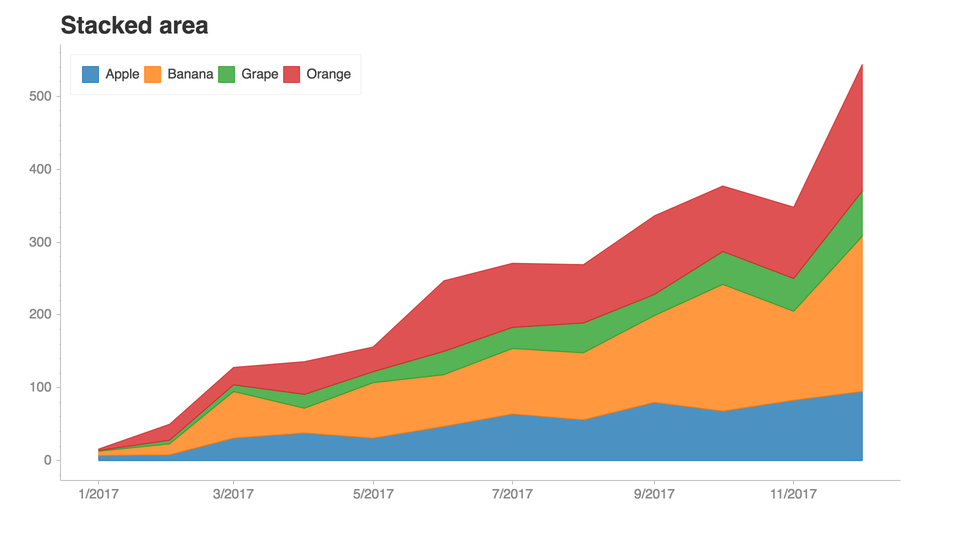
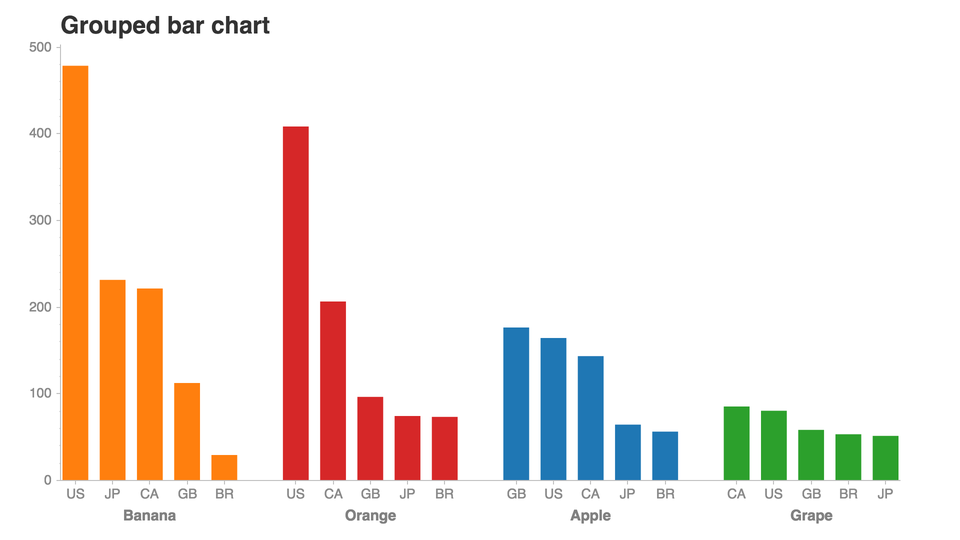
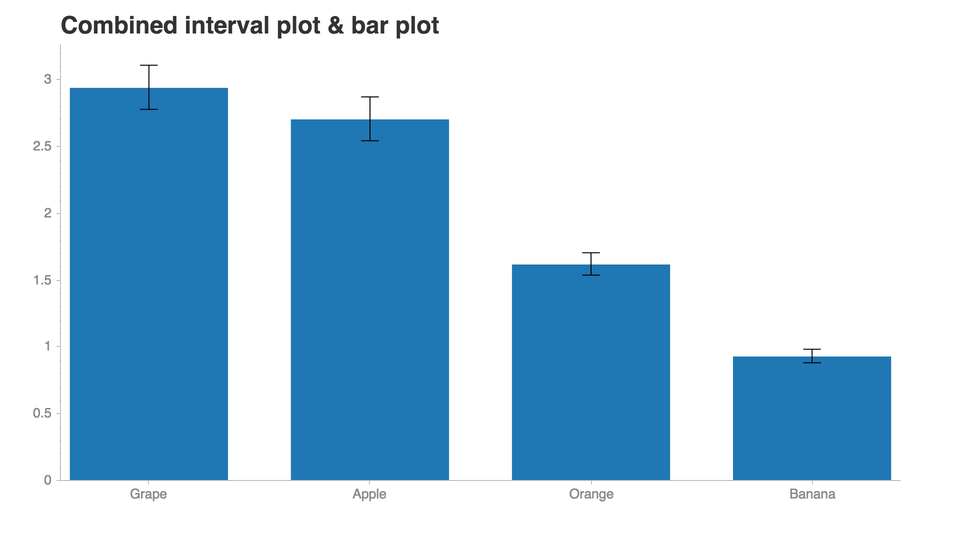
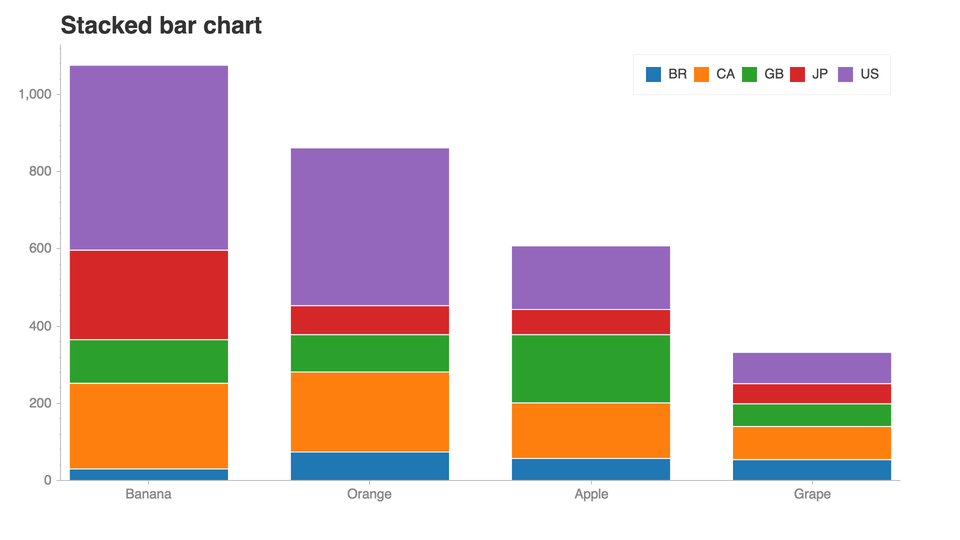
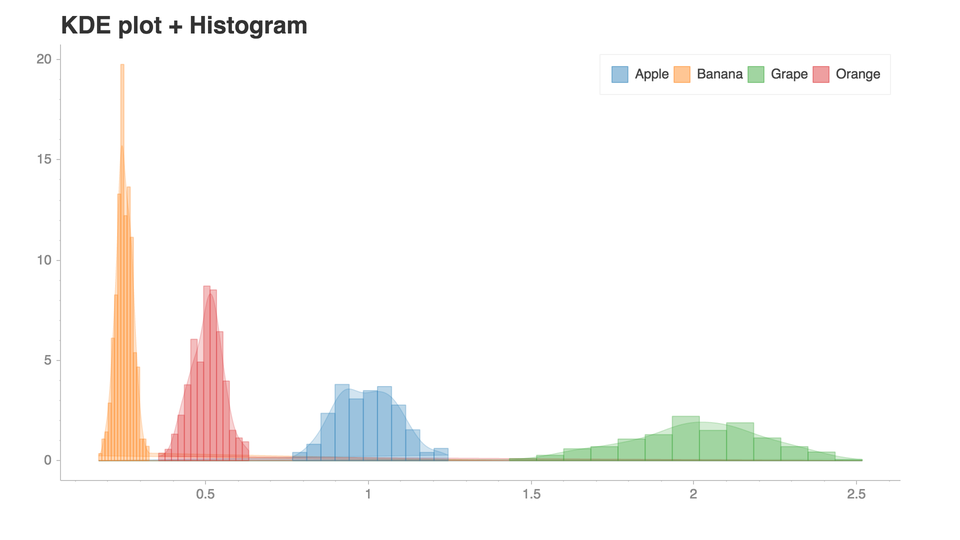
See this notebook for more examples!.
Installation
- Chartify can be installed via pip:
pip3 install chartify
- Install chromedriver requirement (Optional. Needed for PNG output):
echo $PATH
- Copy chromedriver to the appropriate directory, e.g.: cp chromedriver /usr/local/bin
Getting started
This tutorial notebook is the best place to get started with a guided tour of the core concepts of Chartify.
From there, check out the example notebook for a list of all the available plots.
Docs
Documentation available on chartify.readthedocs.io.
Getting support
Use the chartify tag on StackOverflow.
Code of Conduct
This project adheres to the Open Code of Conduct. By participating, you are expected to honor this code.
Contributing


