
Technical analysis in R: indicators, candlestick pattern detection, and interactive trading charts.
{talib}: Fast TA-Lib indicators and candlestick patterns for R 


{talib} provides fast R bindings to the TA-Lib C library for OHLCV data: technical indicators, candlestick pattern recognition, rolling-window utilities, and composable financial charts. It is designed for researchers, analysts, and quant developers who need technical-analysis features in R without building a heavy dependency stack. Core computations are executed in C through .Call(), while charting support is available through optional {plotly} and {ggplot2} integrations.[^1]
The API covers 150+ TA-Lib-backed functions across momentum, overlap, volatility, volume, cycle, price-transform, rolling-statistics, and candlestick-pattern families, including 61 candlestick pattern detectors.
Why {talib}?
| Need | {talib} | |:---------------------|:----------------------------------------------------------------------------------------| | Technical indicators | TA-Lib-backed moving averages, momentum, volatility, volume, cycle, and overlap studies | | Candlestick patterns | Built-in Japanese candlestick pattern recognition | | OHLCV workflows | Works directly with open, high, low, close, and volume columns | | Performance | Computation delegated to C routines through .Call() | | Dependencies | Minimal required R dependencies; plotting packages are optional | | Charts | Composable financial charts with optional {plotly} and {ggplot2} support |
Installation[^2]
Install the release version from CRAN:
r
install.packages("talib")
Install the development version from GitHub:
r
pak::pak("serkor1/ta-lib-R")
Quick start
All functions provide S3 methods for <data.frame>, <matrix>, and—where applicable—<vector> inputs. The general convention is simple: the output uses the same container type as the input.
r
calculate the
relative strength index
relativestrengthindex <- talib::RSI(
    talib::BTC
)
display results
tail(
    relativestrengthindex
)
#>                          RSI
#> 2024-12-26 01:00:00 46.48851
#> 2024-12-27 01:00:00 43.85488
#> 2024-12-28 01:00:00 45.93888
#> 2024-12-29 01:00:00 43.12301
#> 2024-12-30 01:00:00 41.47686
#> 2024-12-31 01:00:00 43.37358
Indicator outputs preserve input length, which keeps results aligned with the original OHLCV rows.
r
combine multiple
indicators
features <- cbind(
    talib::relativestrengthindex(talib::BTC),
    talib::bollinger_bands(talib::BTC),
    talib::engulfing(talib::BTC)
)
tail(features) #>                          RSI UpperBand MiddleBand LowerBand CDLENGULFING #> 2024-12-26 01:00:00 46.48851 100487.38   96698.61  92909.83           -1 #> 2024-12-27 01:00:00 43.85488 100670.65   96512.96  92355.27            0 #> 2024-12-28 01:00:00 45.93888 100632.13   96581.91  92531.69            0 #> 2024-12-29 01:00:00 43.12301  99628.77   95576.60  91524.43           -1 #> 2024-12-30 01:00:00 41.47686  96403.53   94231.31  92059.09            0 #> 2024-12-31 01:00:00 43.37358  95441.13   93774.23  92107.34            0
Charting
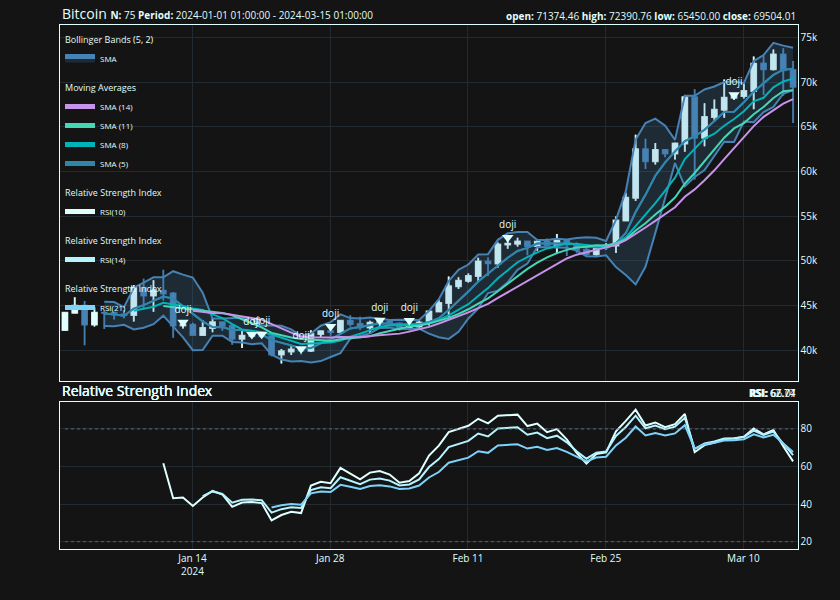
{talib} comes with a composable charting API built on two core functions: indicator() and chart()—both functions are built on model.frame for maximum flexibility:
r
subset data and
store as 'BTC'
BTC <- talib::BTC[1:75, ]
construct chart in a brace block
alternatively use |>
{
## initialize main chart
talib::chart(
x = BTC,
title = "Bitcoin"
)
## add Bollinger Bands to ## the existing chart talib::indicator( talib::BBANDS )
## add Simple Moving Averages (SMA) ## to the chart in a loop for (n in seq(5, 15, by = 3)) { talib::indicator( talib::SMA, n = n ) }
## similar subchart indicators ## like the Relative Strength Index ## can be grouped to avoid repeated ## subpanels talib::indicator( talib::RSI(n = 10), talib::RSI(n = 14), talib::RSI(n = 21) )
## identify Doji patterns ## and add them to the chart talib::indicator( talib::doji ) }
Implementation: {talib} vs upstream (TA-Lib Core)
Functions use descriptive snake_case names, but every function is aliased to its TA-Lib shorthand for compatibility with the broader ecosystem:
| Category | TA-Lib (C) | {talib} | {talib} alias | |:----------------------|:---------------------|:----------------------------|:------------------| | Overlap Studies | TABBANDS() | bollingerbands() | BBANDS() | | Momentum Indicators | TACCI() | commoditychannel_index() | CCI() | | Volume Indicators | TAOBV() | onbalance_volume() | OBV() | | Volatility Indicators | TAATR() | averagetrue_range() | ATR() | | Price Transform | TAAVGPRICE() | averageprice() | AVGPRICE() | | Cycle Indicators | TAHTSINE() | sinewave() | HTSINE() | | Pattern Recognition | TACDLHANGINGMAN() | hangingman() | CDLHANGINGMAN() |
Interface: R vs Python
The main difference between the R and Python interfaces is how OHLCV series are passed into each indicator function. Below is an example of identifying Doji patterns in R and Python.
In Python, each series is passed independently:
python
import numpy as np
import talib
o = np.array([1, 1, 1, 1, 1, 1, 1, 1, 1, 1, 1], dtype=float) h = np.array([2, 2, 2, 2, 2, 2, 2, 2, 2, 2, 2], dtype=float) l = np.array([1, 1, 1, 1, 1, 1, 1, 1, 1, 1, 1], dtype=float) c = np.array([2, 2, 2, 2, 2, 2, 2, 2, 2, 2, 1], dtype=float)
print(     talib.CDLDOJI(o, h, l, c) )
In R the series are passed as a tabular container:
r
ohlc <- data.frame(
    open  = c(1, 1, 1, 1, 1, 1, 1, 1, 1, 1, 1),
    high  = c(2, 2, 2, 2, 2, 2, 2, 2, 2, 2, 2),
    low   = c(1, 1, 1, 1, 1, 1, 1, 1, 1, 1, 1),
    close = c(2, 2, 2, 2, 2, 2, 2, 2, 2, 2, 1)
)
talib::CDLDOJI(     ohlc )
All default series arguments are handled internally, and the R interface is therefore higher-level: users pass one OHLC container rather than manually splitting the series.
Contributing and cloning
Contributions are welcome. For non-trivial changes, please open an issue first to discuss the proposed design, API impact, and testing approach.
This repository vendors TA-Lib as a Git submodule. Clone the repository with submodules enabled:
sh
git clone --recurse-submodules https://github.com/serkor1/ta-lib-R.git
cd ta-lib-R
If you already cloned the repository without submodules, initialize them with:
sh
git submodule update --init --recursive
Most indicator wrappers, helper functions, documentation fragments, and unit tests are generated from the scripts in codegen/. The charting interface is maintained separately.
Common development tasks are exposed through Make targets:
sh
make help
See CONTRIBUTING.md for the full development workflow.
Code of Conduct
Please note that {talib} is released with a Contributor Code of Conduct. By contributing to this project, you agree to abide by its terms.
[^1]: See benchmark/ for detailed benchmarks against [{TTR}]() and general performance across multiple indicators.
[^2]: {talib} is a compiled package. CRAN binaries are available for standard platforms when provided by CRAN. Source installation requires a working compiler toolchain and CMake.


