
Tree-shakeable financial charting toolkit over lightweight-charts: candlestick/OHLC/line/area/volume, drawing tools, pluggable indicators, measurement, and deterministic replay. Framework-agnostic core + React bindings.
The all in one unification layer built on Lightweight Charts™.
CandleKit unifies the charting tools and extensions developers repeatedly source, adapt, and maintain from across the Lightweight Charts ecosystem.
Drawing Tools • Technical Indicators • Replay Engine • Measurement Tools • Synced Multipane System • Broker Integration
Stop stitching together repositories.
Get a cohesive toolkit, consistent APIs, and an extensible architecture built for production-grade financial charting.
Everything you keep rebuilding around Lightweight Charts™ — packaged once.




[!NOTE]
Candlekit is a vibe-coded project — designed and built rapidly and iteratively with AI-assisted development. It is functional, tested (CI green, with a Vitest suite under /tests), and documented, but treat it as early-stage software: pin a version, read the changelog before upgrading, and open an issue if something looks off.
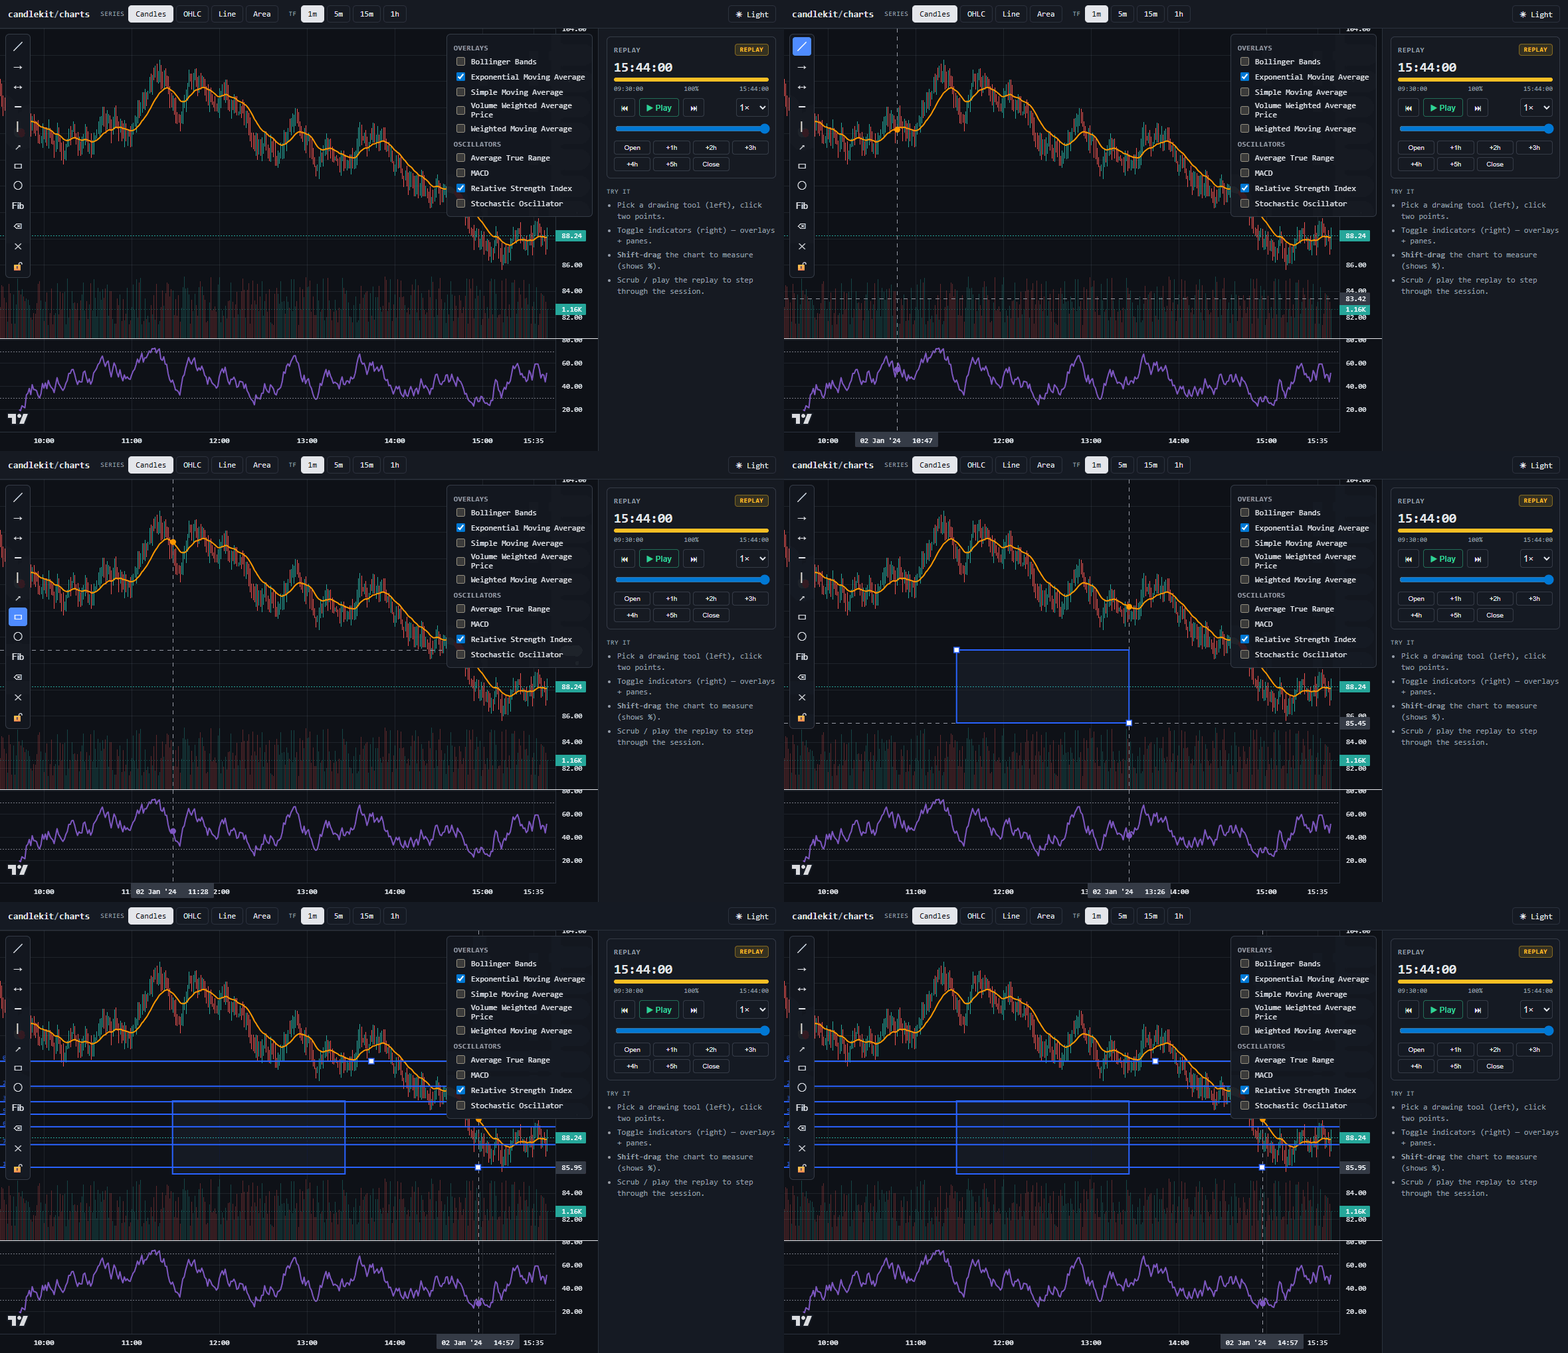
Drawing tools — trendline, rectangle, Fibonacci, measurement ruler
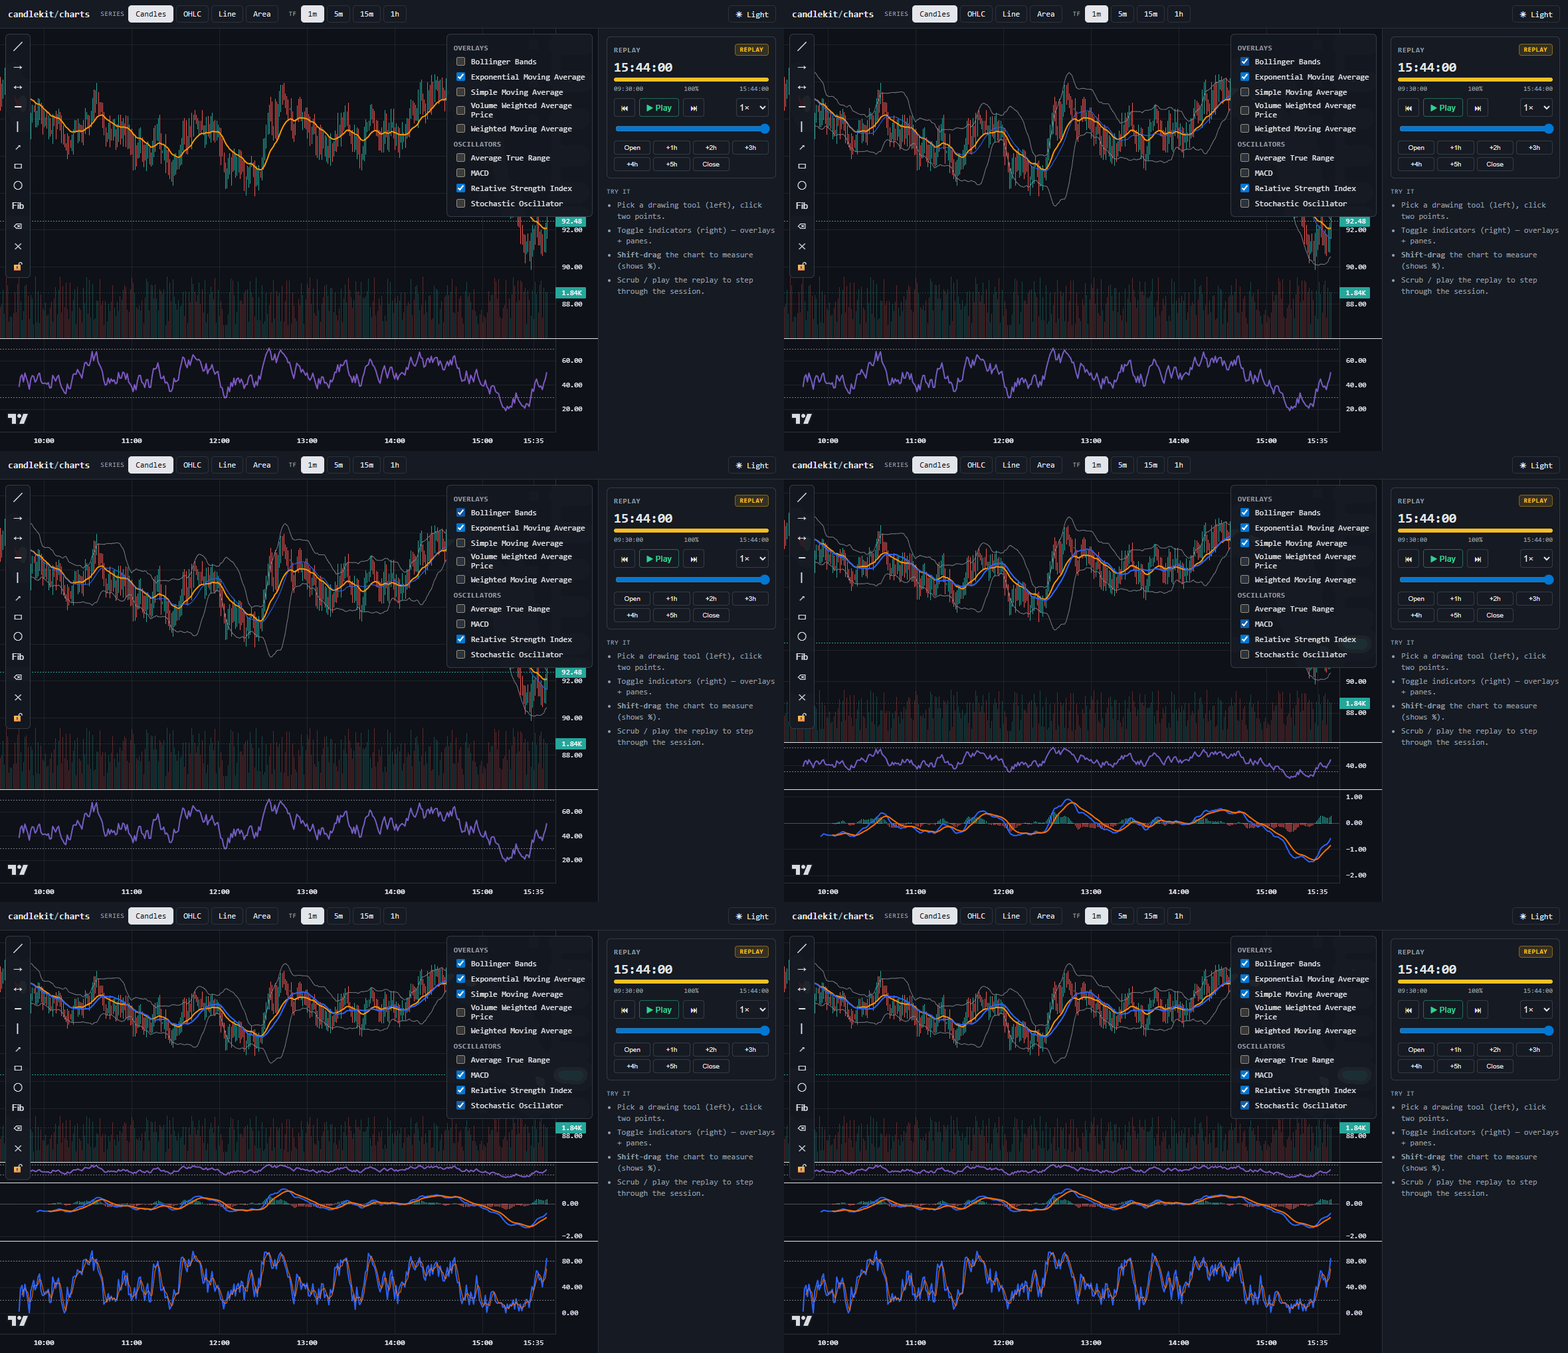
Built-in indicators — Bollinger, EMA/SMA, RSI, MACD, Stochastic — toggled live
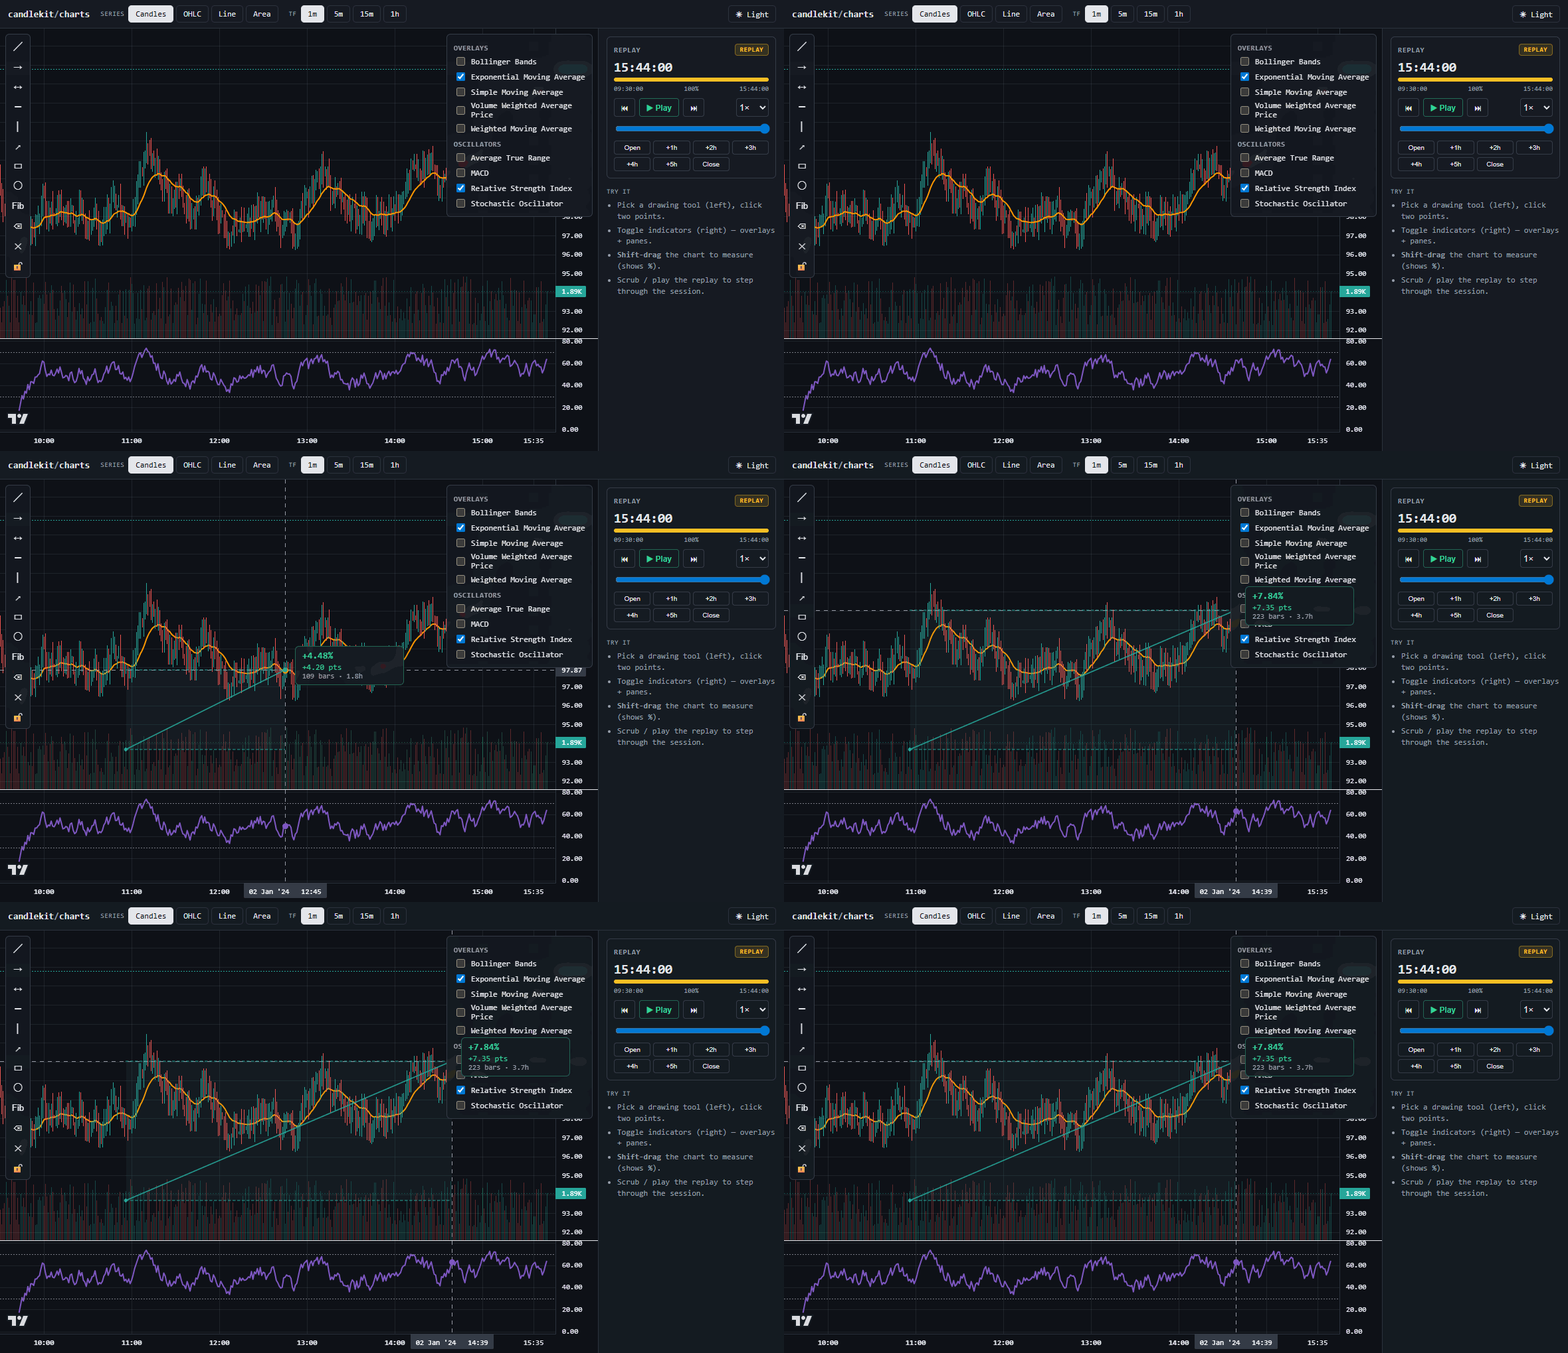
Measurement ruler — Shift-drag for % move, points, bars · time
▶ Open the live demo — drawing, indicators, measurement and replay in one chart
Overview
candlekit/charts wraps lightweight-charts with the pieces a real trading UI needs but the base library leaves to you: a stable chart controller, a runtime-agnostic drawing engine, an extensible indicator framework, a Shift-drag measurement ruler, multi-chart sync, broker integration and a deterministic historical replay engine. The core is framework-agnostic (no React, no DOM framework); the optional /react entry adds components and hooks.
It is plugin-first: drawing, indicators, and measurement are all ChartPlugins you can swap, extend, or omit. Drawing tools and indicators are original code built on lightweight-charts canvas primitives — no third-party drawing or indicator runtime — and the side-effect-free modules let tree-shaking drop whatever you don't import.
Features
- Core charting — candlestick, OHLC bars, line, area, volume; multiple
- Drawing tools — trend line, ray, extended line, horizontal/vertical line,
- Indicators — extensible registry + a built-in catalog (SMA, EMA, WMA,
- Measurement — price, percentage, bar-distance, time-delta, and
- Replay — deterministic playback over historical bars: play/pause, step
- Lab (experimental) — pattern-similarity analytics over your own bars.
- Architecture — TypeScript, fully typed public API, tree-shakeable ESM +
Replay

Deterministic replay — play/pause, step ±1, speed control, seek/jump
Lab — Sketch Search & Echoes
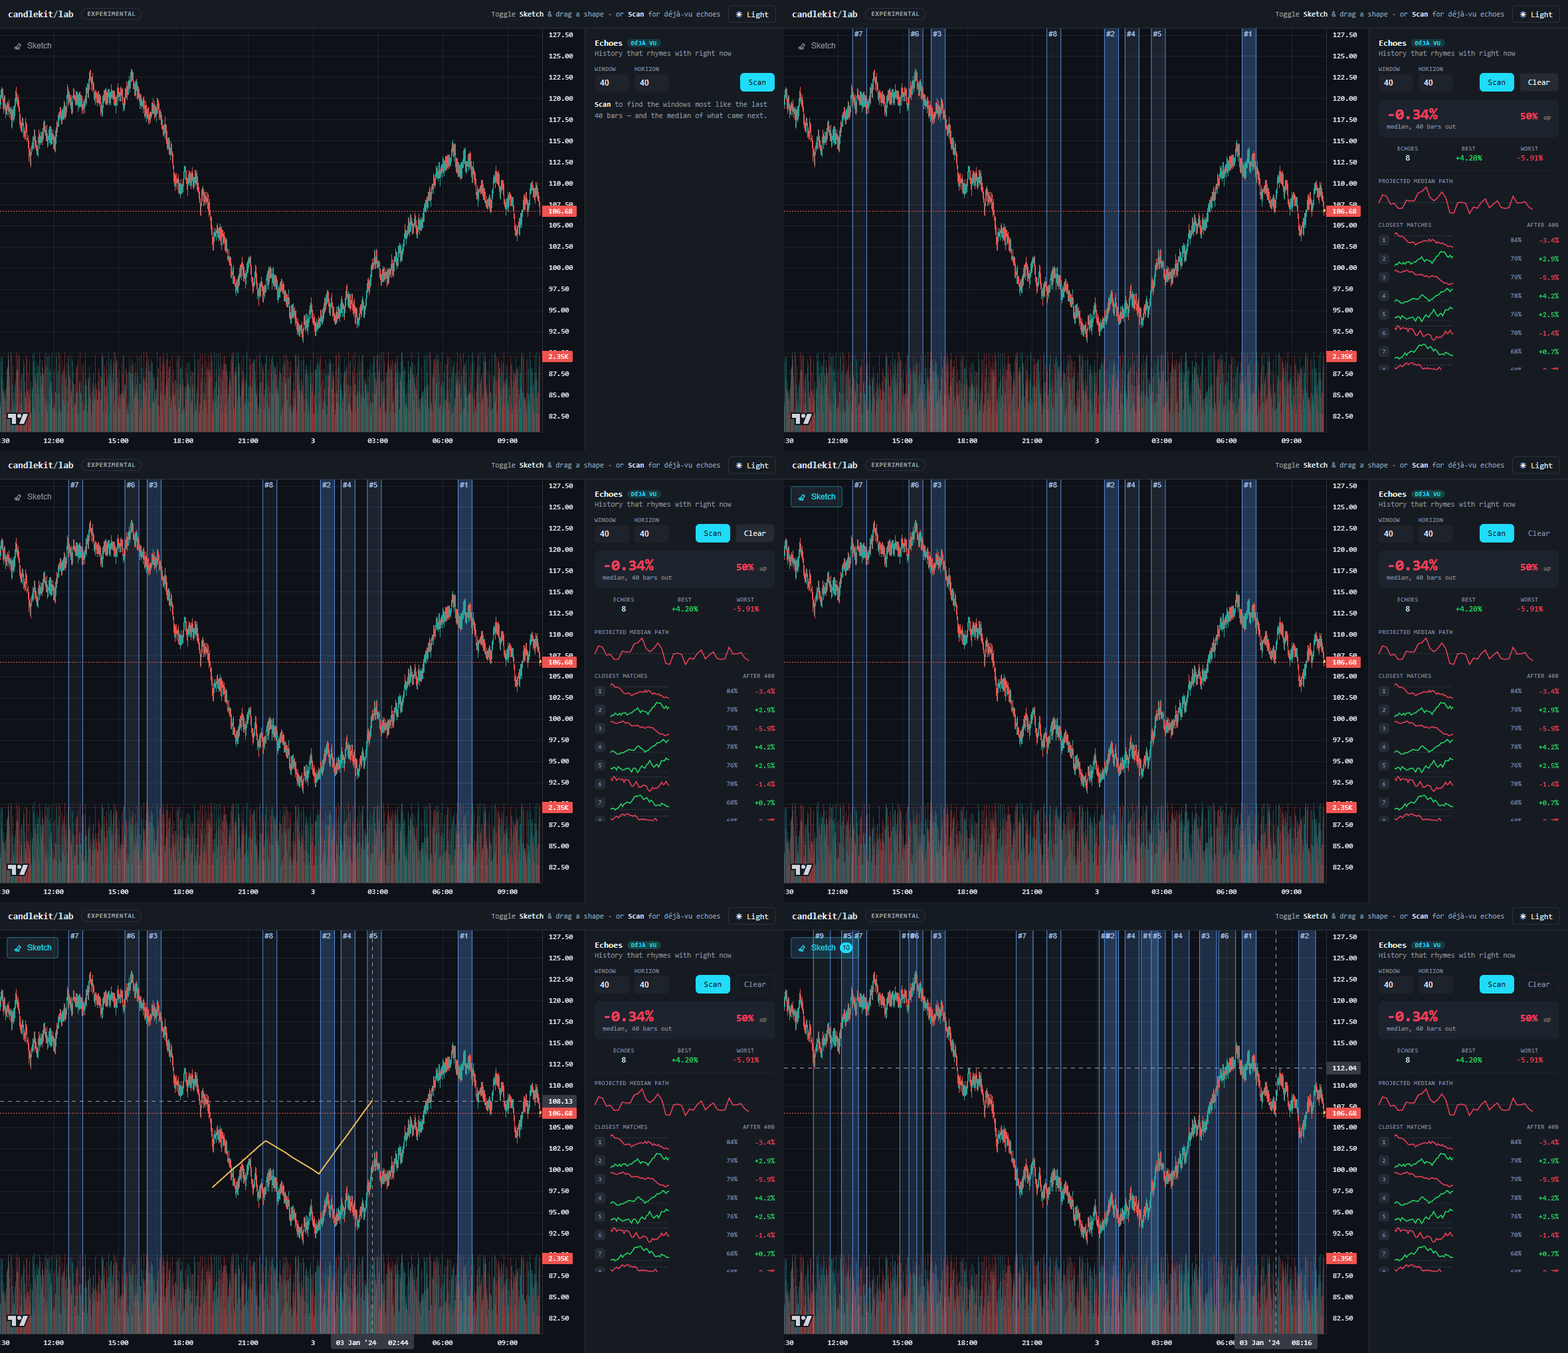
Echoes — similar past windows + median projection · Sketch Search — draw a shape, find look-alikes
Two experimental pattern-similarity tools, computed on z-normalized closes (shape, not price level), so look-alikes are found across regimes:
- Echoes — takes the last N closes as a query, finds the most similar
- Sketch Search — draw a freehand shape across the chart; it is resampled
The math (zNormalize, findSimilar, buildEchoScan, resampleStroke) is pure and dependency-free; the chart plugins (SketchSearchController, EchoesController) and the React <EchoesPanel> / <SketchSearchButton> are optional. See Lab Examples below, the full Lab guide, and examples/lab for a runnable demo.
Try it live in examples/lab (cd examples/lab && npm i && npm run dev).
The GIF above is regenerated by SCENE=lab node scripts/capture-demo.mjs.
Installation
npm install @getcandlekit/charts lightweight-charts
React bindings (optional):
npm install react react-dom
That's it. lightweight-charts is the only runtime dependency (a peer, so you control its version); react/react-dom are needed only for @getcandlekit/charts/react. Drawing tools and indicators are built in — no extra packages, no git installs.
Quick Start
Vanilla JS / TypeScript
import { ChartController, toBars } from "@getcandlekit/charts";
const el = document.getElementById("chart")!; const chart = new ChartController(el, { theme: "dark", seriesType: "candlestick" });
chart.setData(toBars(myRows)); // myRows: { ts, open, high, low, close, volume }[]
React
import { ChartView } from "@getcandlekit/charts/react";
import "@getcandlekit/charts/styles.css";
export function App({ bars }) {   return (     <div style={{ height: 480 }}>       <ChartView data={bars} seriesType="candlestick" theme="dark" />     </div>   ); }
Basic Examples
Switch series type and timeframe:
chart.setSeriesType("area");       // candlestick | ohlc | line | area
chart.setData(resample(rows, 5));  // 5-minute candles from 1-minute rows
chart.setTheme("light");
Live updates:
ws.onBar((bar) => chart.updateBar(bar)); // appends or replaces the last barAdvanced Examples
Session-aware resampling (align buckets to a 09:30 market open instead of UTC midnight):
import { resample } from "@getcandlekit/charts";
const candles = resample(rows, 15, { sessionOpenMinutes: 9 * 60 + 30 });
Fixed-offset exchange time (render an always-UTC+5:30 market in wall-clock):
import { applyFixedOffset } from "@getcandlekit/charts";
const shifted = rows.map((r) => ({ ...r, ts: applyFixedOffset(r.ts, 330) }));
Replay Examples
import { createReplayController } from "@getcandlekit/charts";
const replay = createReplayController(); replay.onBar((e) => chart.updateBar(e.bar)); await replay.load({   id: "demo",   series: [{ symbol: "AAPL", interval: "1m" }],   start: Date.parse("2024-01-02T14:30:00Z"),   end: Date.parse("2024-01-03T21:00:00Z"),   source: myReplayDataSource, // implements ReplayDataSource }); replay.setSpeed(8); replay.play();
React transport bar:
import { ReplayControls } from "@getcandlekit/charts/react";
<ReplayControls controller={replay} />
Drawing Tool Examples
import { ChartView, DrawingToolbar } from "@getcandlekit/charts/react";
// drawing accepts true, an options object, or a DrawingController instance. <ChartView data={bars} drawing={{ storageKey: "drawings:AAPL" }}>   <DrawingToolbar /> </ChartView>;
Imperative (vanilla):
import { ChartController, DrawingController } from "@getcandlekit/charts";
const chart = new ChartController(el); const drawing = new DrawingController({ storageKey: "drawings:AAPL" }); chart.use(drawing); drawing.engine.startTool("TrendLine");
Indicator Examples
import { ChartView, IndicatorPicker, IndicatorController, createBuiltinRegistry } from "@getcandlekit/charts/react";
const indicators = new IndicatorController(createBuiltinRegistry()); indicators.add("RSI", { length: 14 }); indicators.add("EMA", { length: 21 });
<ChartView data={bars} indicators={indicators}>   <IndicatorPicker /> </ChartView>;
Register a custom indicator (the extension point):
import { IndicatorRegistry } from "@getcandlekit/charts";
const registry = new IndicatorRegistry().register({   name: "PriceMid",   title: "HL/2",   shortTitle: "MID",   category: "overlay",   defaultInputs: {},   inputConfig: [],   plotConfig: [{ id: "mid", color: "#f59e0b" }],   hlineConfig: [],   calculate: (bars) => ({     plots: { mid: bars.map((b) => ({ time: b.time, value: (b.high + b.low) / 2 })) },   }), });
Lab Examples
React (<ChartView> hosts the plugins; the components drive them):
import { ChartView, SketchSearchButton, EchoesPanel } from "@getcandlekit/charts/react";
import "@getcandlekit/charts/styles.css";
<ChartView data={bars} sketch echoes={{ windowLen: 30, horizon: 30, k: 8 }}>   <SketchSearchButton />  {/ toggle, then drag a shape on the chart /}   <EchoesPanel />         {/ Scan → bands + median projection + stats /} </ChartView>;
Imperative (vanilla — same plugins, your own UI):
import { ChartController, EchoesController, SketchSearchController } from "@getcandlekit/charts";
const chart = new ChartController(el); chart.setData(bars);
const echoes = new EchoesController({ windowLen: 30, horizon: 30, k: 8 }); chart.use(echoes); echoes.subscribe((scan) => scan && console.log(scan.stats)); // { count, upCount, medianEndPct, ... } echoes.run();
const sketch = new SketchSearchController({ onResult: (r) => console.log(r?.matches) }); chart.use(sketch); sketch.setActive(true); // arm; drag a freehand shape, release to search
Pure math, no chart (search any series of closes):
import { findSimilar, buildEchoScan } from "@getcandlekit/charts";
const matches = findSimilar(closes, closes.slice(-30), { k: 5 }); // [{ startIndex, endIndex, distance }] const scan = buildEchoScan(bars, 30, 30, 8);                      // window/horizon/k → null if too little history
Plugin Examples
import type { ChartPlugin } from "@getcandlekit/charts";
const lastPriceLabel: ChartPlugin = {   id: "last-price-label",   init(ctx) {     ctx.bus.on("data", ({ bars }) => {       const last = bars[bars.length - 1];       if (last) console.log("last close", last.close);     });   },   destroy() {}, };
chart.use(lastPriceLabel);
API Overview
| Export | Kind | Purpose | | --- | --- | --- | | ChartController | class | Imperative chart wrapper (data, series type, theme, plugins, events). | | toBars, resample, floorToBucket | fn | Pure data normalization + session-aware resampling. | | resolveTheme, lightTheme, darkTheme | fn/const | Theme presets + resolution. | | EventBus | class | Typed sync event bus. | | DrawingController, DrawingEngine | class | Built-in drawing plugin + its model/state. | | IndicatorRegistry, IndicatorController, createBuiltinRegistry | class/fn | Extensible indicator framework + built-in catalog. | | MeasurementController, RulerPrimitive | class | Shift-drag measurement. | | createReplayController | fn | Deterministic replay. | | createSyncEngine | fn | Multi-chart sync. | | EchoesController, SketchSearchController | class | Lab plugins — Echoes (déjà vu) + Sketch Search. | | findSimilar, buildEchoScan, zNormalize, resampleStroke | fn | Pure pattern-similarity math (no chart). | | ChartView (/react) | component | Declarative chart + plugin host. | | EchoesPanel, SketchSearchButton (/react) | component | Lab results panel + sketch toggle. |
Full reference: docs/api-reference.md.
Performance Notes
- Single offset conversion at the data boundary; drawings/replay stay in one
setDataautoscale fits once on the first non-empty paint; later updates
- Replay uses a per-day LRU cache with backward/forward pre-fetch; the cursor
- Tree-shakeable ESM — a vanilla bundle never pulls React. Drawing and
Browser Support
Evergreen browsers (Chrome, Edge, Firefox, Safari) with Canvas + ResizeObserver. ESM and CJS builds are shipped; target: es2020.
Roadmap
- [ ] Text + freehand/brush drawing tools
- [ ] Indicator settings UI (param editing) in the React picker
- [ ] Crosshair tooltip component
- [ ] More indicators (Ichimoku, SuperTrend, Keltner)
- [ ] Vue / Svelte bindings
- [ ] Screenshot/export helper
Star History
If candlekit saves you from stitching repos together, a ⭐ helps others find it.
Contributing
See CONTRIBUTING.md and AGENTS.md. In short: npm install, npm run typecheck && npm run lint && npm run test && npm run build.
License
MIT — see LICENSE. Third-party attributions in NOTICE. "Lightweight Charts™" is a trademark of TradingView, Inc.; this project is not affiliated with TradingView.


