
vimspector - A multi-language debugging system for Vim
vimspector - A multi language graphical debugger for Vim
For a tutorial and usage overview, take a look at the [Vimspector website][website].
For detailed explanation of the .vimspector.json format, see the [reference guide][vimspector-ref].



* Supported debugging features * Supported languages * Other languages * Quick Start * Method 1: Using a repo clone, Vim packages and select gadgets to be installed * Method 2: Using a plugin manager * Dependencies * Neovim limitations * Windows differences * Trying it out * Installing the plugin * Install some gadgets * VimspectorInstall and VimspectorUpdate commands * installgadget.py * Manual gadget installation * The gadget directory * Upgrade * Background * Status * Experimental * Motivation * License * Sponsorship * Visual Studio / VSCode * Human Mode * Launch and attach by PID: * Picking a PID * Launch with options * Debug configuration selection * Get configurations * Breakpoints * Breakpoints Window * Line breakpoints * Conditional breakpoints and logpoints * Exception breakpoints * Data breakpoints * API Summary * Instruction breakpoints * Clear breakpoints * Run to Cursor * Go to current line * Save and restore * Stepping * Variables and scopes * Variable or selection hover evaluation * Watches * Watch autocompletion * Disassembly * Dump memory * Stack Traces * Child sessions * Program Output * Console * Console autocompletion * Log View * Closing debugger * Terminate debuggee * C, C++, Rust, etc. * Data visualization / pretty printing * C++ Remote debugging * C++ Remote launch and attach * Rust * Jai * Python * Python Remote Debugging * Python Remote launch and attach * Python 2 * TCL * C♯ * Go * PHP * Debug web application * Debug cli application * JavaScript and TypeScript * Java * Hot code replace * Usage with YouCompleteMe * Other LSP clients * Lua * Other servers * Changing the default signs * Sign priority * Presentation Hints * Changing the default window sizes * Changing the terminal size * Custom mappings while debugging * Pre-launch building strategies * Disabling the WinBar * Advanced UI customisation * Customising the WinBar * Example
Features and Usage
The plugin is a capable Vim graphical debugger for multiple languages. It's mostly tested for C++, Python and TCL, but in theory supports any language that Visual Studio Code supports (but see caveats).
The [Vimspector website][website] has an overview of the UI, along with basic instructions for configuration and setup.
But for now, here's a (rather old) screenshot of Vimspector debugging Vim:
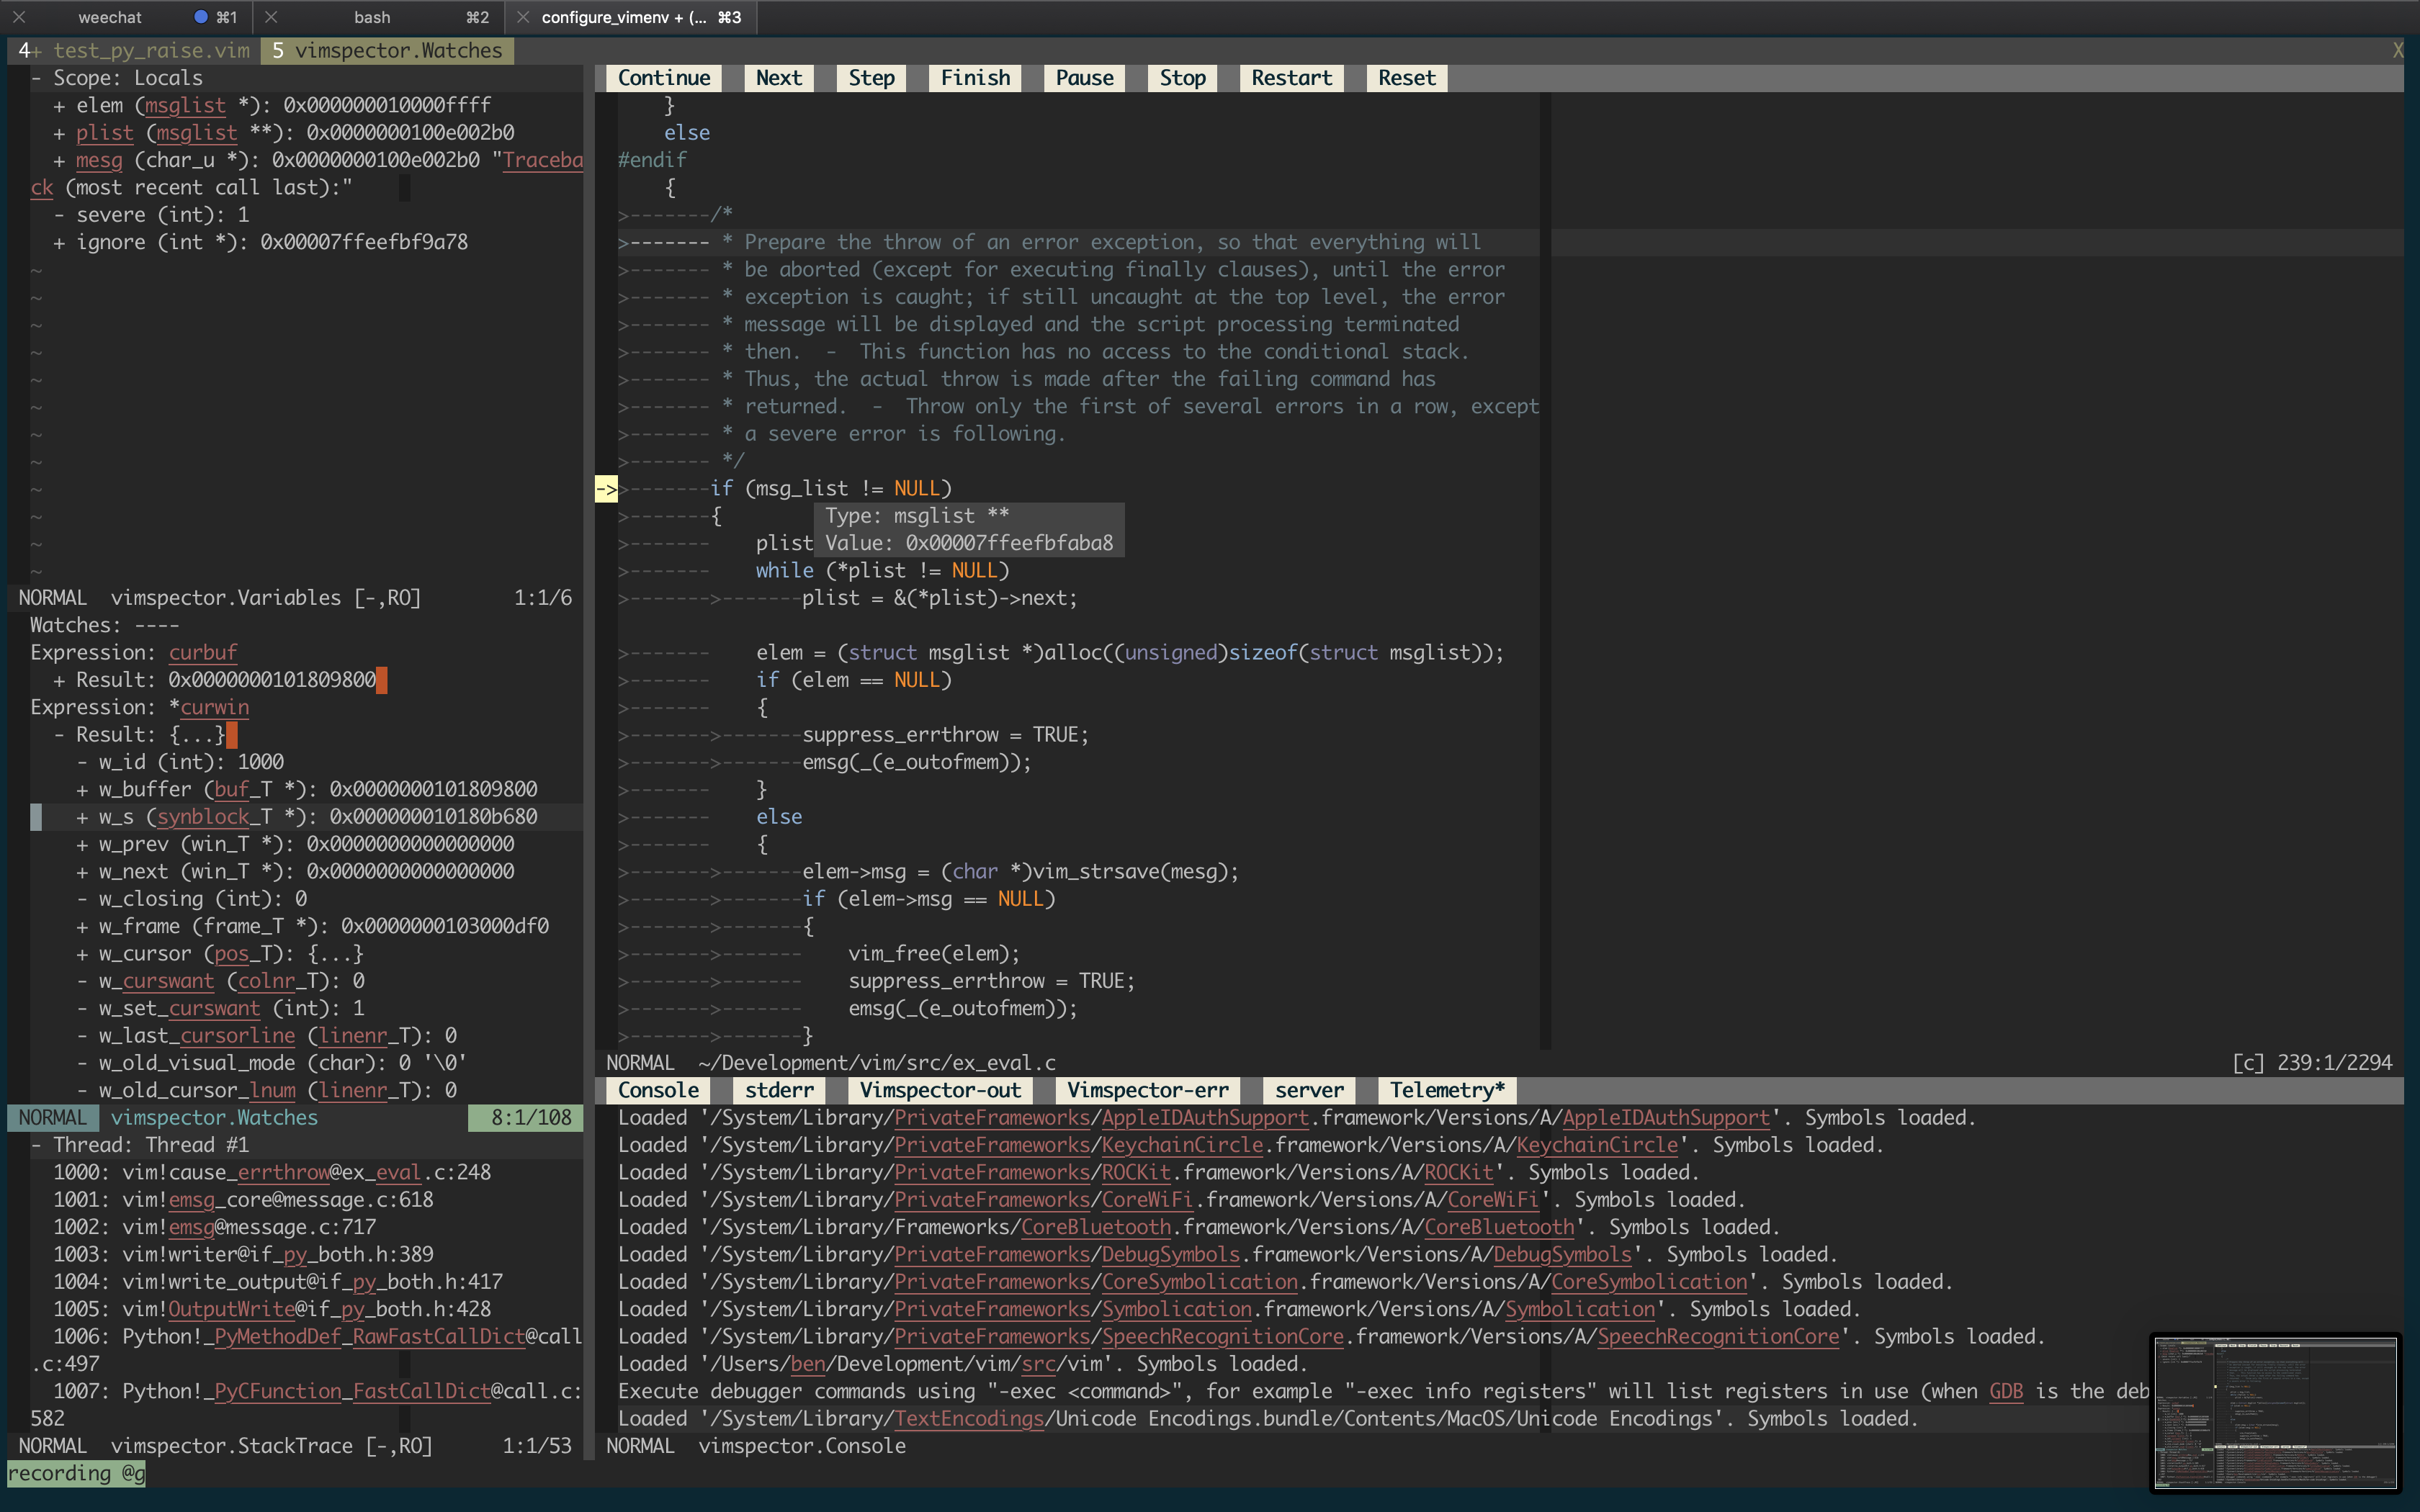
And a couple of brief demos:


Supported debugging features
- flexible configuration syntax that can be checked in to source control
- breakpoints (function, line and exception breakpoints)
- instruction breakpoints
- data breakpoints
- conditional breakpoints (function, line)
- step in/out/over/up, stop, restart
- run to cursor
- go to line (reset program counter to line)
- launch and attach, including PID picker
- remote launch, remote attach
- locals and globals display
- watch expressions with autocompletion
- variable inspection tooltip on hover
- disassembly view and step-by-instruction
- set variable value in locals, watch and hover windows
- call stack display and navigation
- hierarchical variable value display popup (see
<Plug>VimspectorBalloonEval) - interactive debug console with autocompletion
- launch debuggee within Vim's embedded terminal
- logging/stdout display
- simple stable API for custom tooling (e.g. integrate with language server)
- view hex dump of process memory
- multiple independent debugging sessions (debug different apps in tabs)
- multi-process (multi-session) debugging
Supported languages
The following table lists the languages that are "built-in" (along with their runtime dependencies). They are categorised by their level of support:
Tested: Fully supported, Vimspector regression tests cover themSupported: Fully supported, frequently used and manually testedExperimental: Working, but not frequently used and rarely testedLegacy: No longer supported, please migrate your configRetired: No longer included or supported.
install_gadget.py) | Adapter (for :VimspectorInstall) | Dependencies |
| -------------------- | ----------- | ---------------------------------- | ------------------------------------ | -------------------------------------------- |
| C, C++, Rust, Jai, etc. | Tested | --all or --enable-c (or cpp) | vscode-cpptools | mono-core |
| C, C++, Rust, Jai, etc. | Tested | --enable-rust, --enable-c, etc. | CodeLLDB | none |
| Python | Tested | --all or --enable-python | debugpy | Python 3 |
| Go | Tested | --enable-go | delve | Go 1.16+ |
| TCL | Supported | --all or --enable-tcl | tclpro | TCL >= 8.5 < 9.0 |
| Bourne Shell | Supported | --all or --enable-bash | vscode-bash-debug | Bash v?? |
| Lua | Tested | --all or --enable-lua | local-lua-debugger-vscode | Node >=12.13.0, Npm, Lua interpreter |
| Node.js | Supported | --force-enable-node | vscode-js-debug | Node >= 18 |
| Javascript | Legacy [Deprecated] | --force-enable-chrome | debugger-for-chrome | Chrome |
| Javascript | Legacy [Unsupported] | --force-enable-firefox | vscode-firefox-debug | Firefox |
| Java | Supported | --force-enable-java | vscode-java-debug | Compatible LSP plugin (see later) |
| PHP | Experimental | --force-enable-php | vscode-php-debug | Node, PHP, XDEBUG |
| C# (dotnet core) | Tested | --force-enable-csharp | netcoredbg | DotNet core |
| F#, VB, etc. | Supported | --force-enable-[fsharp,vbnet] | netcoredbg | DotNet core |
Other languages
Vimspector should work for any debug adapter that works in Visual Studio Code.
To use Vimspector with a language that's not "built-in", see this wiki page.
Installation
Quick Start
There are 2 installation methods:
- Using a repo clone and Vim packages
- Using a plugin manager
Method 1: Using a repo clone, Vim packages and select gadgets to be installed
- Check the dependencies
- Install the plugin as a Vim package. See
:help packages. - Add
packadd! vimspectorto your.vimrc - Install some 'gadgets' (debug adapters) - see here for installation commands and select gadgets to install
- Configure your project's debug profiles (create
.vimspector.json, or set
g:vimspector_configurations) - see the [reference guide][vimspector-ref]
Method 2: Using a plugin manager
- Check the dependencies
- See the plugin manager's docs and install the plugin
Plugin 'puremourning/vimspector'- Install some 'gadgets' (debug adapters) - see here for installation commands and select gadgets to install
- Configure your project's debug profiles (create
.vimspector.json, or set
g:vimspector_configurations) - see the [reference guide][vimspector-ref]
The following sections expand on the above brief overview.
Dependencies
Vimspector requires:
- One of:
- One of the following operating systems:
Which Linux versions? I only test on Ubuntu 20.04 and later and RHEL 7.
Neovim limitations
Neovim doesn't implement mouse hover balloons. Instead there is the <Plug>VimspectorBalloonEval mapping. There is no default mapping for this, so I recommend something like this to get variable display in a popup:
" mnemonic 'di' = 'debug inspect' (pick your own, if you prefer!)
" for normal mode - the word under the cursor nmap <Leader>di <Plug>VimspectorBalloonEval " for visual mode, the visually selected text xmap <Leader>di <Plug>VimspectorBalloonEval
Windows differences
The following features are not implemented for Windows:
- Tailing the vimspector log in the Output Window.
Trying it out
If you just want to try out vimspector without changing your vim config, there are example projects for a number of languages in support/test, including:
- Python (support/test/python/simple_python)
- Go (support/test/go/helloworld and support/test/go/name-starts-with-vowel)
- Nodejs (support/test/node/simple)
- Chrome/Firefox (support/test/web)
- etc.
vim -Nu /path/to/vimspector/tests/vimrc --cmd "let g:vimspectorenablemappings='HUMAN'"Then press <F5>.
There's also a C++ project in tests/testdata/cpp/simple/ with a Makefile which can be used to check everything is working. This is used by the regression tests in CI so should always work, and is a good way to check if the problem is your configuration rather than a bug.
Installing the plugin
- Clone the plugin
Plugin 'puremourning/vimspector'If you don't use a plugin manager already, install vimspector as a Vim package by cloning this repository into your package path, like this:
$ git clone https://github.com/puremourning/vimspector ~/.vim/pack/vimspector/opt/vimspector- Configure vimspector in your
.vimrc, for example to enable the standard
let g:vimspectorenablemappings = 'HUMAN'- Load vimspector at runtime. This can also be added to your
.vimrcafter
packadd! vimspectorSee support/doc/example_vimrc.vim for a minimal example.
Install some gadgets
Vimspector is a generic client for Debug Adapters. Debug Adapters (referred to as 'gadgets' or 'adapters') are what actually do the work of talking to the real debuggers.
In order for Vimspector to be useful, you need to have some adapters installed.
There are a few ways to do this:
- Using
:VimspectorInstall <adapter> <args...>(use TABwildmenuto see the
install_gadget.py option)
- Using
python3 install_gadget.py <args>(use--helpto see all options) - Attempting to launch a debug configuration; if the configured adapter
- Using
:VimspectorUpdateto install the latest supported versions of the
Here's a demo of doing some installs and an upgrade:

Both install_gadget.py and :VimspectorInstall do the same set of things, though the default behaviours are slightly different. For supported languages, they will:
- Download the relevant debug adapter at a version that's been tested from the
- Perform any necessary post-installation actions, such as:
gadgetDir symlinks for the platform.
For example, to install the tested debug adapter for a language, run:
| To install | Script | Command | | --- | --- | --- | | <adapter> | | :VimspectorInstall <adapter> | | <adapter1>, <adapter2>, ... | | :VimspectorInstall <adapter1> <adapter2> ... | | <language> | ./install_gadget.py --enable-<language> ... | :VimspectorInstall --enable-<language> ... | | Supported adapters | ./install_gadget.py --all | :VimspectorInstall --all | | Supported adapters, but not TCL | ./install_gadget.py --all --disable-tcl | :VimspectorInstall --all --disable-tcl | | Supported and experimental adapters | ./install_gadget.py --all --force-all | :VimspectorInstall --all | | Adapter for specific debug config | | Suggested by Vimspector when starting debugging |
VimspectorInstall and VimspectorUpdate commands
:VimspectorInstall runs install_gadget.py in the background with some of the options defaulted.
:VimspectorUpdate runs install_gadget.py to re-install (i.e. update) any gadgets already installed in your .gadgets.json.
The output is minimal, to see the full output add --verbose to the command, as in :VimspectorInstall --verbose ... or :VimspectorUpdate --verbose ....
If the installation is successful, the output window is closed (and the output lost forever). Use a ! to keep it open (e.g. :VimspectorInstall! --verbose --all or :VimspectorUpdate! (etc.).
If you know in advance which gadgets you want to install, for example so that you can reproduce your config from source control, you can set g:vimspectorinstallgadgets to a list of gadgets. This will be used when:
- Running
:VimspectorInstallwith no arguments, or - Running
:VimspectorUpdate
let g:vimspectorinstallgadgets = [ 'debugpy', 'vscode-cpptools', 'CodeLLDB' ]install\_gadget.py
By default install_gadget.py will overwrite your .gadgets.json with the set of adapters just installed, whereas :VimspectorInstall will update it, overwriting only newly changed or installed adapters.
If you want to just add a new adapter using the script without destroying the existing ones, add --update-gadget-config, as in:
$ ./install_gadget.py --enable-tcl
$ ./install_gadget.py --enable-rust --update-gadget-config
$ ./install_gadget.py --enable-java --update-gadget-config
If you want to maintain configurations outside of the vimspector repository (this can be useful if you have custom gadgets or global configurations), you can tell the installer to use a different basedir, then set g:vimspectorbasedir to point to that directory, for example:
$ ./install_gadget.py --basedir $HOME/.vim/vimspector-config --all --force-allThen add this to your .vimrc:
let g:vimspectorbasedir=expand( '$HOME/.vim/vimspector-config' )When using :VimspectorInstall, the g:vimspectorbasedir setting is respected unless --basedir is manually added (not recommended).
See --help for more info on the various options.
Manual gadget installation
If the language you want to debug is not in the supported list above, you can probably still make it work, but it's more effort.
You essentially need to get a working installation of the debug adapter, find out how to start it, and configure that in an adapters entry in either your .vimspector.json or in .gadgets.json or in g:vimspector_adapters.
The simplest way in practice is to install or start Visual Studio Code and use its extension manager to install the relevant extension. You can then configure the adapter manually in the adapters section of your .vimspector.json or in a gadgets.json or in g:vimspector_adapters.
PRs are always welcome to add supported languages (which roughly translates to updating python/vimspector/gadgets.py and testing it).
The gadget directory
Vimspector uses the following directory by default to look for a file named .gadgets.json: </path/to/vimspector>/gadgets/<os>.
This path is exposed as the vimspector variable ${gadgetDir}. This is useful for configuring gadget command lines.
Where os is one of:
macoslinuxwindows(though note: Windows is not supported)
.vimspector.json, but only the adapters key is
used:
Example:
{
  "adapters": {
    "lldb-dap": {
      "variables": {
        "LLVM": {
          "shell": "brew --prefix llvm"
        }
      },
      "attach": {
        "pidProperty": "pid",
        "pidSelect": "ask"
      },
      "command": [
        "lldb-dap"
      ],
      "env": {
        "LLDBLAUNCHFLAGLAUNCHIN_TTY": "YES"
      },
      "name": "lldb"
    },
    "vscode-cpptools": {
      "attach": {
        "pidProperty": "processId",
        "pidSelect": "ask"
      },
      "command": [
        "${gadgetDir}/vscode-cpptools/debugAdapters/bin/OpenDebugAD7"
      ],
      "name": "cppdbg"
    }
  }
}
The gadget file is automatically written by install_gadget.py (or :VimspectorInstall).
Vimspector will also load any files matching: </path/to/vimspector>/gadgets/<os>/.gadgets.d/*.json. These have the same format as .gadgets.json but are not overwritten when running install_gadget.py.
Upgrade
After updating the Vimspector code (either via git pull or whatever package manager), run :VimspectorUpdate to update any already-installed gadgets.
About
Background
The motivation is that debugging in Vim is a pretty horrible experience, particularly if you use multiple languages. With pyclewn no more and the built-in termdebug plugin limited to gdb, I wanted to explore options.
While Language Server Protocol is well known, the Debug Adapter Protocol is less well known, but achieves a similar goal: language agnostic API abstracting debuggers from clients.
The aim of this project is to provide a simple but effective debugging experience in Vim for multiple languages, by leveraging the debug adapters that are being built for Visual Studio Code.
The ability to do remote debugging is a must. This is key to my workflow, so baking it in to the debugging experience is a top bill goal for the project. So vimspector has first-class support for executing programs remotely and attaching to them. This support is unique to vimspector and on top of (complementary to) any such support in actual debug adapters.
What Vimspector is not
Vimspector is a vim UI on top of the Debug Adapter Protocol. It's intended to be high level and convenient for day-to-day debugging tasks.
Vimspector is not:
- a debugger! It's just the UI and some glue.
- fast. It's abstractions all the way down. If you want a fast, native debugger,
- comprehensive. It's limited by DAP, and limited by my time. I implement the
- for everyone. Vimspector intentionally provides a "one size fits all" UI and
Status
Vimspector is a work in progress, and any feedback/contributions are more than welcome.
The backlog can be viewed on Trello.
Experimental
The plugin is currently experimental. That means that any part of it can (and probably will) change, including things like:
- breaking changes to the configuration
- keys, layout, functionality of the UI
Motivation
A message from the author about the motivation for this plugin:
Many development environments have a built-in debugger. I spend an inordinate
amount of my time in Vim. I do all my development in Vim and I have even
customised my workflows for building code, running tests etc.>
For many years I have observed myself, friends and colleagues have been
writingprintf,puts,
files simply because there is no easy way to run a debugger for whatever
language we happen to be developing in.>
I truly believe that interactive, graphical debugging environments are the
best way to understand and reason about both unfamiliar and familiar code, and
that the lack of ready, simple access to a debugger is a huge hidden
productivity hole for many.>
Don't get me wrong, I know there are literally millions of developers out
there that are more than competent at developing without a graphical debugger,
but I maintain that if they had the ability to just press a key and jump
into the debugger, it would be faster and more enjoyable that just cerebral
code comprehension.>
I created Vimspector because I find changing tools frustrating. gdb for c++,
pdb for python, etc. Each has its own syntax. Each its own lexicon. Each itsown foibles.>
I designed the configuration system in such a way that the configuration can
be committed to source control so that it just works for any of your
colleagues, friends, collaborators or complete strangers.>
I made remote debugging a first-class feature because that's a primary use
case for me in my job.>
With Vimspector I can just hit <F5> in all of the languages I develop in
and debug locally or remotely using the exact same workflow, mappings and UI.
I have integrated this with my Vim in such a way that I can hit a button and
run the test under the cursor in Vimspector. This kind of integration has
massively improved my workflow and productivity. It's even made the process
of learning a new codebase... fun.>
\- Ben Jackson, Creator.
License
Copyright © 2018 Ben Jackson
Sponsorship
If you like Vimspector so much that you're wiling to part with your hard-earned cash, please consider donating to one of the following charities, which are meaningful to the author of Vimspector (in order of preference):
- Hector's Greyhound Rescue
- Cancer Research UK
- ICCF Holland
- Any charity of your choosing.
Mappings
By default, vimspector does not change any of your mappings. Mappings are very personal and so you should work out what you like and use vim's powerful mapping features to set your own mappings. To that end, Vimspector defines the following <Plug> mappings:
| Mapping | Function | API | | --- | --- | --- | | <Plug>VimspectorContinue | When debugging, continue. Otherwise start debugging. | vimspector#Continue() | | <Plug>VimspectorStop | Stop debugging. | vimspector#Stop() | | <Plug>VimspectorRestart | Restart debugging with the same configuration. | vimspector#Restart() | | <Plug>VimspectorPause | Pause debuggee. | vimspector#Pause() | | <Plug>VimspectorBreakpoints | Show/hide the breakpoints window | vimspector#ListBreakpoints() | | <Plug>VimspectorToggleBreakpoint | Toggle line breakpoint on the current line. | vimspector#ToggleBreakpoint() | | <Plug>VimspectorToggleConditionalBreakpoint | Toggle conditional line breakpoint or logpoint on the current line. | vimspector#ToggleBreakpoint( { trigger expr, hit count expr } ) | | <Plug>VimspectorAddFunctionBreakpoint | Add a function breakpoint for the expression under cursor | vimspector#AddFunctionBreakpoint( '<cexpr>' ) | | <Plug>VimspectorGoToCurrentLine | Reset the current program counter to the current line | vimspector#GoToCurrentLine() | | <Plug>VimspectorRunToCursor | Run to Cursor | vimspector#RunToCursor() | | <Plug>VimspectorStepOver | Step Over | vimspector#StepOver() | | <Plug>VimspectorStepInto | Step Into | vimspector#StepInto() | | <Plug>VimspectorStepOut | Step out of current function scope | vimspector#StepOut() | | <Plug>VimspectorDisassemble | Show disassembly. Enable instruction stepping | vimspector#ShowDisassembly() | | <Plug>VimspectorUpFrame | Move up a frame in the current call stack | vimspector#UpFrame() | | <Plug>VimspectorDownFrame | Move down a frame in the current call stack | vimspector#DownFrame() | | <Plug>VimspectorJumpToNextBreakpoint | Move Cursor to the next breakpoint in current file | vimspector#JumpToNextBreakpoint() | | <Plug>VimspectorJumpToPreviousBreakpoint | Move Cursor to the previous breakpoint in current file | vimspector#JumpToPreviousBreakpoint() | | <Plug>VimspectorJumpToProgramCounter | Move Cursor to the program counter in the current frame | vimspector#JumpToProgramCounter() | | <Plug>VimspectorBalloonEval | Evaluate expression under cursor (or visual) in popup | internal |
These map roughly 1-1 with the API functions below.
For example, if you want <F5> to start/continue debugging, add this to some appropriate place, such as your vimrc (hint: run :e $MYVIMRC).
nmap <F5> <Plug>VimspectorContinueIn addition, many users probably want to only enable certain Vimspector mappings while debugging is active. This is also possible, though it requires writing some vimscript.
That said, many people are familiar with particular debuggers, so the following mappings can be enabled by setting g:vimspectorenablemappings to the specified value.
Visual Studio / VSCode
To use Visual Studio-like mappings, add the following to your vimrc **before loading vimspector**:
let g:vimspectorenablemappings = 'VISUAL_STUDIO'| Key | Mapping | Function | --- | --- | --- | F5 | <Plug>VimspectorContinue | When debugging, continue. Otherwise start debugging. | Shift F5 | <Plug>VimspectorStop | Stop debugging. | Ctrl Shift F5 | <Plug>VimspectorRestart | Restart debugging with the same configuration. | F6 | <Plug>VimspectorPause | Pause debuggee. | F8 | <Plug>VimspectorJumpToNextBreakpoint | Jump to next breakpoint in the current file. | Shift F8 | <Plug>VimspectorJumpToPreviousBreakpoint | Jump to previous breakpoint in the current file. | F9 | <Plug>VimspectorToggleBreakpoint | Toggle line breakpoint on the current line. | Shift F9 | <Plug>VimspectorAddFunctionBreakpoint | Add a function breakpoint for the expression under cursor | F10 | <Plug>VimspectorStepOver | Step Over | Ctrl F10 | <Plug>VimspectorRunToCursor | Run to cursor* | F11 | <Plug>VimspectorStepInto | Step Into | Shift F11 | <Plug>VimspectorStepOut | Step out of current function scope | Alt 8 | <Plug>VimspectorDisassemble | Show disassembly
*NOTE: Some mappings, such as ctrl and F-keys may not work depending on your terminal, keyboard, windowing system and all sorts of other things. See :help modifyOtherKeys and other sources. If you are unable to make this work, just use the "human mode" mappings.*
Human Mode
If, like me, you only have 2 hands and 10 fingers, you probably don't like Ctrl-Shift-F keys. Also, if you're running in a terminal, there's a real possibility of terminfo being wrong for shifted-F-keys, particularly if your TERM is screen-256color. If these issues (number of hands, TERM variables) are unfixable, try the following mappings, by adding the following **before loading vimspector**:
let g:vimspectorenablemappings = 'HUMAN'| Key | Mapping | Function | --- | --- | --- | F5 | <Plug>VimspectorContinue | When debugging, continue. Otherwise start debugging. | F3 | <Plug>VimspectorStop | Stop debugging. | F4 | <Plug>VimspectorRestart | Restart debugging with the same configuration. | F6 | <Plug>VimspectorPause | Pause debuggee. | F9 | <Plug>VimspectorToggleBreakpoint | Toggle line breakpoint on the current line. | <leader>F9 | <Plug>VimspectorToggleConditionalBreakpoint | Toggle conditional line breakpoint or logpoint on the current line. | F8 | <Plug>VimspectorAddFunctionBreakpoint | Add a function breakpoint for the expression under cursor | <leader>F8 | <Plug>VimspectorRunToCursor | Run to Cursor | F10 | <Plug>VimspectorStepOver | Step Over | F11 | <Plug>VimspectorStepInto | Step Into | F12 | <Plug>VimspectorStepOut | Step out of current function scope
In addition, I recommend adding a mapping to <Plug>VimspectorBalloonEval, in normal and visual modes, for example:
" mnemonic 'di' = 'debug inspect' (pick your own, if you prefer!)
" for normal mode - the word under the cursor nmap <Leader>di <Plug>VimspectorBalloonEval " for visual mode, the visually selected text xmap <Leader>di <Plug>VimspectorBalloonEval
You may also wish to add mappings for navigating up/down the stack, toggling the breakpoints window, and showing disassembly, for example:
nmap <LocalLeader><F11> <Plug>VimspectorUpFrame
nmap <LocalLeader><F12> <Plug>VimspectorDownFrame
nmap <LocalLeader>B     <Plug>VimspectorBreakpoints
nmap <LocalLeader>D     <Plug>VimspectorDisassemble
Usage and API
This section defines detailed usage instructions, organised by feature. For most users, the mappings section contains the most common commands and default usage. This section can be used as a reference to create your own mappings or custom behaviours.
All the below instructions assume a single debugging session. For details on how to debug multiple independent apps at the same time, see [multiple debugging sessions][#multiple-debugging-sessions].
Launch and attach by PID:
- Create
.vimspector.json. See below. :call vimspector#Launch()and select a configuration.
Launching a new session makes it the active [debugging session][#multiple-debugging-sessions].
Picking a PID
If the debug adapter configuration uses pidProperty, and you make an attach request, then you will be asked to enter a PID (process ID) to attach to.
To make this easier, Vimspector supplies a little utility for listing PIDs. It's like a very very simple clone of ps but works on all the supported platforms. See its README for instructions on setting it up.
Run go build in the support/vimspectorprocesslist directory to set it up.
If Vimspector is able to find this app, it will try to list all processes owned by the current user by default.
Alternatively (preferably), you can use a special form of variable expansion called ${PickProcess(\"binaryName\")}. The version of this call will list all processes for the current user that match this binary name.
For example:
"Attach": {
  "adapter": "CodeLLDB",
  "configuration": {
    "request": "attach",
    "program": "${workspaceRoot}/Jails",
    "pid": "${PickProcess(\"jails\")}"
  }
}
This will list each matching processes, its parent process, start time and working directory. It's looks something like this:
PID   PPID           CWD                                           START
52218 52217 (Python) /Users/ben/.vim/bundle/lsp-examples/jai/Jails 2023-05-22 16:02:24
Enter Process ID:
You then enter the PID and hit <CR>.
You can even replace the process picker with your own function. If you define some function and set g:vimspectorcustomprocesspickerfunc to the name of that function. It will be passed any arguments passed to the PickProcess expansion function. It will also be used whenever a pidProperty is specified, so it must also handle no arguments (use ... as the formal arguments for the function, see :help ...).
For example, to use fzf along with the supplied vimspectorprocesslist:
function! CustomPickProcess( ... ) abort
  let ps = $HOME .. '/.vim/bundle/vimspector/support/vimspectorprocesslist/vimspectorprocesslist'
  " a:0 is number of args
  " a:1 is the optional binary name
  if a:0 > 0
    let ps .= ' ^' . a:1 . '$'
  endif
let line_selected = fzf#run( {       \ 'source': ps,       \ 'options': '--header-lines=1  '       \          . '--prompt="Select Process: " '       \ ,       \       \ } )[ 0 ]   if empty( line_selected)     return 0   endif   let pid = split( line_selected )[ 0 ]   return str2nr( pid ) endfunction
let g:vimspectorcustomprocesspickerfunc = 'CustomPickProcess'
Or to use fzf with the output of ps:
function! CustomPickProcess( ... ) abort
  let ps = 'ps aux'
let line_selected = fzf#run( {       \ 'source': ps,       \ 'options': '--header-lines=1  '       \          . '--prompt="Select Process: " '       \ ,       \       \ } )[ 0 ]   if empty( line_selected)     return 0   endif   let pid = split( line_selected )[ 0 ]   return str2nr( pid ) endfunction
let g:vimspectorcustomprocesspickerfunc = 'CustomPickProcess'
Launch with options
To launch a specific debug configuration, or specify [replacement variables][vimspector-ref-var] for the launch, you can use:
:call vimspector#LaunchWithSettings( dict )
dict with the following keys:
configuration: (optional) Name of the debug configuration to launch<anything else>: (optional) Name of a variable to set
Run Test that contains a [replacement
variable][vimspector-ref-var] named ${Test} you could write a mapping which
ultimately executes:
vimspector#LaunchWithSettings( #{ configuration: 'Run Test'
                                \ Test: 'Name of the test' } )
This would start the Run Test configuration with ${Test} set to 'Name of the test' and Vimspector would not prompt the user to enter or confirm these things.
See our YouCompleteMe integration guide for another example where it can be used to specify the port to connect the java debugger
To launch with an ad-hoc config you can use:
call vimspector#LaunchWithConfigurations( dict )
dict which is the configurations section of a .vimspector
file. Pass one configuration in and that will be selected as the one to run.
For example:
let pid = <some_expression>
   call vimspector#LaunchWithConfigurations({
               \  "attach": {
               \    "adapter": "netcoredbg",
               \    "configuration": {
               \      "request": "attach",
               \      "processId": pid
               \    }
               \  }
               \})
This would launch the debugger and attach to the specified process without the need to have a local .vimspector file on disk. The ${workspaceRoot} variable will point to the parent folder of the file that is currently open in vim.
Debug configuration selection
Vimspector uses the following logic to choose a configuration to launch:
- If a configuration was specified in the launch options (as above), use that.
- Otherwise if there's only one configuration and it doesn't have
autoselect
false, use that.
- Otherwise if there's exactly one configuration with
defaultset totrue
autoselect set to false, use that.
- Otherwise, prompt the user to select a configuration.
Get configurations
- Use
vimspector#GetConfigurations()to get a list of configurations for the
For example, to get an array of configurations and fuzzy matching on the result
:call matchfuzzy(vimspector#GetConfigurations(), "test::case_1")Breakpoints
See the mappings section for the default mappings for working with breakpoints. This section describes the full API in vimscript functions.
Breakpoints are associated with the current [debugging session][#multiple-debugging-sessions]. When switching between sessions, the breakpoint signs for the previous session are removed and the breakpoints for the newly activated session are displayed. While it might be useful to see breakpoints for all sessions, this can be very confusing.
Breakpoints Window
Use :VimspectorBreakpoints or map something to <Plug>VimspectorBreakpoints to open the breakpoints view. From here you can list, jump to delete, add and toggle breakpoints.
I recommend a mapping like this to toggle the breakpoints window:
nmap <Leader>db <Plug>VimspectorBreakpointsThe following mappings apply by default in the breakpoints window:
t,<F9>- toggle, i.e. enable/disable breakpointT- toggle, i.e. enable/disable ALL breakpointsdd,<Del>- delete the current breakpointcc,C- edit the current breakpoint optionsi,a,o- add a new line breakpointI,A,O- add a new function breakpoint<Enter>or double-click - jump to the line breakpoint
Line breakpoints
The simplest and most common form of breakpoint is a line breakpoint. Execution is paused when the specified line is executed.
For most debugging scenarios, users will just hit <F9> to create a line breakpoint on the current line and <F5> to launch the application.
Conditional breakpoints and logpoints
Some debug adapters support conditional breakpoints. Note that vimspector does not tell you if the debugger doesn't support conditional breakpoints (yet). A conditional breakpoint is a breakpoint which only triggers if some expression evaluates to true, or has some other constraints met.
Some of these functions above take a single optional argument which is a dictionary of options. The dictionary can have the following keys:
condition: An optional expression evaluated to determine if the breakpoint
abc is 10, enter something like abc == 10, depending on the language.
hitCondition: An optional expression evaluated to determine a number of
condition. Not supported by all debug adapters. For
example, to break on the 3rd time hitting this line, enter 3.
logMessage: An optional string to make this breakpoint a "logpoint" instead.
{like this}, for
example #{ logMessage: "Iteration {i} or {num_entries / 2}" }
In each case expressions are evaluated by the debugger, so should be in whatever dialect the debugger understands when evaluating expressions.
When using the <leader><F9> mapping, the user is prompted to enter these expressions in a command line (with history).
Exception breakpoints
Exception breakpoints typically fire when an exception is throw or other error condition occurs. Depending on the debugger, when starting debugging, you may be asked a few questions about how to handle exceptions. These are "exception breakpoints" and vimspector remembers your choices while Vim is still running.
Typically you can accept the defaults (just keep pressing <CR>!) as most debug adapter defaults are sane, but if you want to break on, say uncaught exception then answer Y to that (for example).
You can configure your choices in the .vimspector.json. See [the configuration guide][vimspector-ref-exception] for details on that.
Data breakpoints
Data breakpoints are not supported by all debug adapters. They are breakpoints which trigger when some memory is read or written. They can be created:
- For a given variable in the variables window (
<F9>on variable) - For a given child variable in the watches or variables windows
<F9> on child variable)
- For an arbitrary expression which evaluates to an address (
<F9>in watch
When specifying an expression, you can also specify a size.
In general, if you hit <F9> (or whatever mapping you have) in the Variables or Watch window, you'll be adding a Data Breakpoint. If the context looks like a variable, then Vimspector will ask the debug adapter to create a data breakpoint on that variable expression. Otherwise, you'll be asked to enter an expression, or an address and a size, depending on the capabilities of the debugger.
NOTE: Not all debug adapters support data breakpoints, and the ability to actually create them often depends on the hardware of the target.
API Summary
NOTE: Previously, ToggleBreakpoint would cycle between 3 states: enabled, disabled, deleted. Many users found the 'disabled' state was rarely useful, so the behaviour has been changed. ToggleBreakpoint always creates or deletes a breakpoint. If you wish to 'disable' breakpoints, use the breakpoints window and 'toggle' (t) from there.
- Use
vimspector#ToggleBreakpoint( { options dict } )to set/delete
- Use
vimspector#AddFunctionBreakpoint( '<name>', { options dict} )
- Use
vimspector#SetLineBreakpoint( filename, linenum, { options dict } )to
- Use
vimspector#ClearLineBreakpoint( filename, linenum )to
- Use
vimspector#ClearBreakpoints()to clear all breakpoints - Use
vimspector#ResetExceptionBreakpoints()to clear the exception breakpoints
- Use
:VimspectorMkSessionand:VimspectorLoadSessionto save and restore
call vimspector#ListBreakpoints()- toggle breakpoints windowcall vimspector#BreakpointsAsQuickFix()- return the current set of
call vimspector#AddDataBreakpoint()- add a data breakpoint
call vimspector#ToggleBreakpoint()- toggle breakpoint on current linecall vimspector#SetLineBreakpoint( 'some_file.py', 10 )- set a breakpoint
some_filepy:10
call vimspector#AddFunctionBreakpoint( 'main' )- add a function breakpoint
main function
call vimspector#ToggleBreakpoint( { 'condition': 'i > 5' } )- add a
i > 5 is true
call vimspector#SetLineBreakpoint( 'some_file.py', 10, { 'condition': 'i > 5' } )- add a
some_file.py:10 that triggers only when i > 5 is true
call vimspector#ClearLineBreakpoint( 'some_file.py', 10 )- delete the
some_file.py:10
call vimspector#ClearBreakpoints()- clear all breakpointsVimspectorMkSession- create.vimspector.sessionVimspectorLoadSession- read.vimspector.sessionVimspectorMkSession mysessionfile- createmysessionfileVimspectorLoadSession mysessionfile- readmysessionfile
Instruction breakpoints
NOTE: Experimental feature, which may change significantly in future based on user feedback.
Instruction breakpoints can be added from the disassembly window in the same way that you add line breakpoints in the code window. The same mappings and functions work for adding and toggling them. Where supported by the debug adapter, you can even create logpoints and conditional breakpoints this way.
Currently, instruction breakpoints are internally modelled as line breakpoints against the buffer containing the disassembly, but that may change in future, so please don't rely on this.
Instruction breakpoints are also visible from and can be deleted/disabled from the breakpoints window.
Currently, instruction breakpoints are automatically cleared when the debug session ends. The reason for this is that the addresses can't be guaranteed to be valid for any other debug session. However, this may also change in future.
Clear breakpoints
Use vimspector#ClearBreakpoints() to clear all breakpoints including the memory of exception breakpoint choices.
Run to Cursor
Use vimspector#RunToCursor or <leader><F8>: this creates a temporary breakpoint on the current line, then continues execution, clearing the breakpoint when it is hit.
Go to current line
Use vimspector#GoToCurrentLine() or some mapping to <Plug>VimspectorGoToCurrentLine to jump the current execution to the line your cursor is currently on.
Where supported this can be useful to re-run sections of code or skip over them entirely.
If there are multiple possible "targets" on the current line, you're prompted to pick one.
Save and restore
Vimspector can save and restore breakpoints (and some other stuff) to a session file. The following commands exist for that:
VimspectorMkSession [file/dir name]- save the current set of line breakpoints,
VimspectorLoadSession [file/dir name]- read breakpoints from the session
vimspector#ClearLineBreakpoints() was called).
In both cases, the file/dir name argument is optional. By default, the file is named .vimspector.session, but this can be changed globally by setting g:vimspectorsessionfile_name to something else, or by manually specifying a path when calling the command. If you supply a directory, the default or configured session file name is read from or written to that directory. Otherwise, the file is read based on the currently open buffer or written to the current working directory.
Advanced users may wish to automate the process of loading and saving, for example by adding VimEnter and VimLeave autocommands. It's recommended in that case to use silent! to avoid annoying errors if the file can't be read or written.
The simplest form of automation is to load the vimspector session whenever you start vim with a session file. This is as simple as doing this:
$ echo silent VimspectorLoadSession > Sessionx.vimSee :help mksession for details of the *x.vim file. You can also do something like this using SessionLoadPost:
autocmd SessionLoadPost * silent! VimspectorLoadSessionStepping
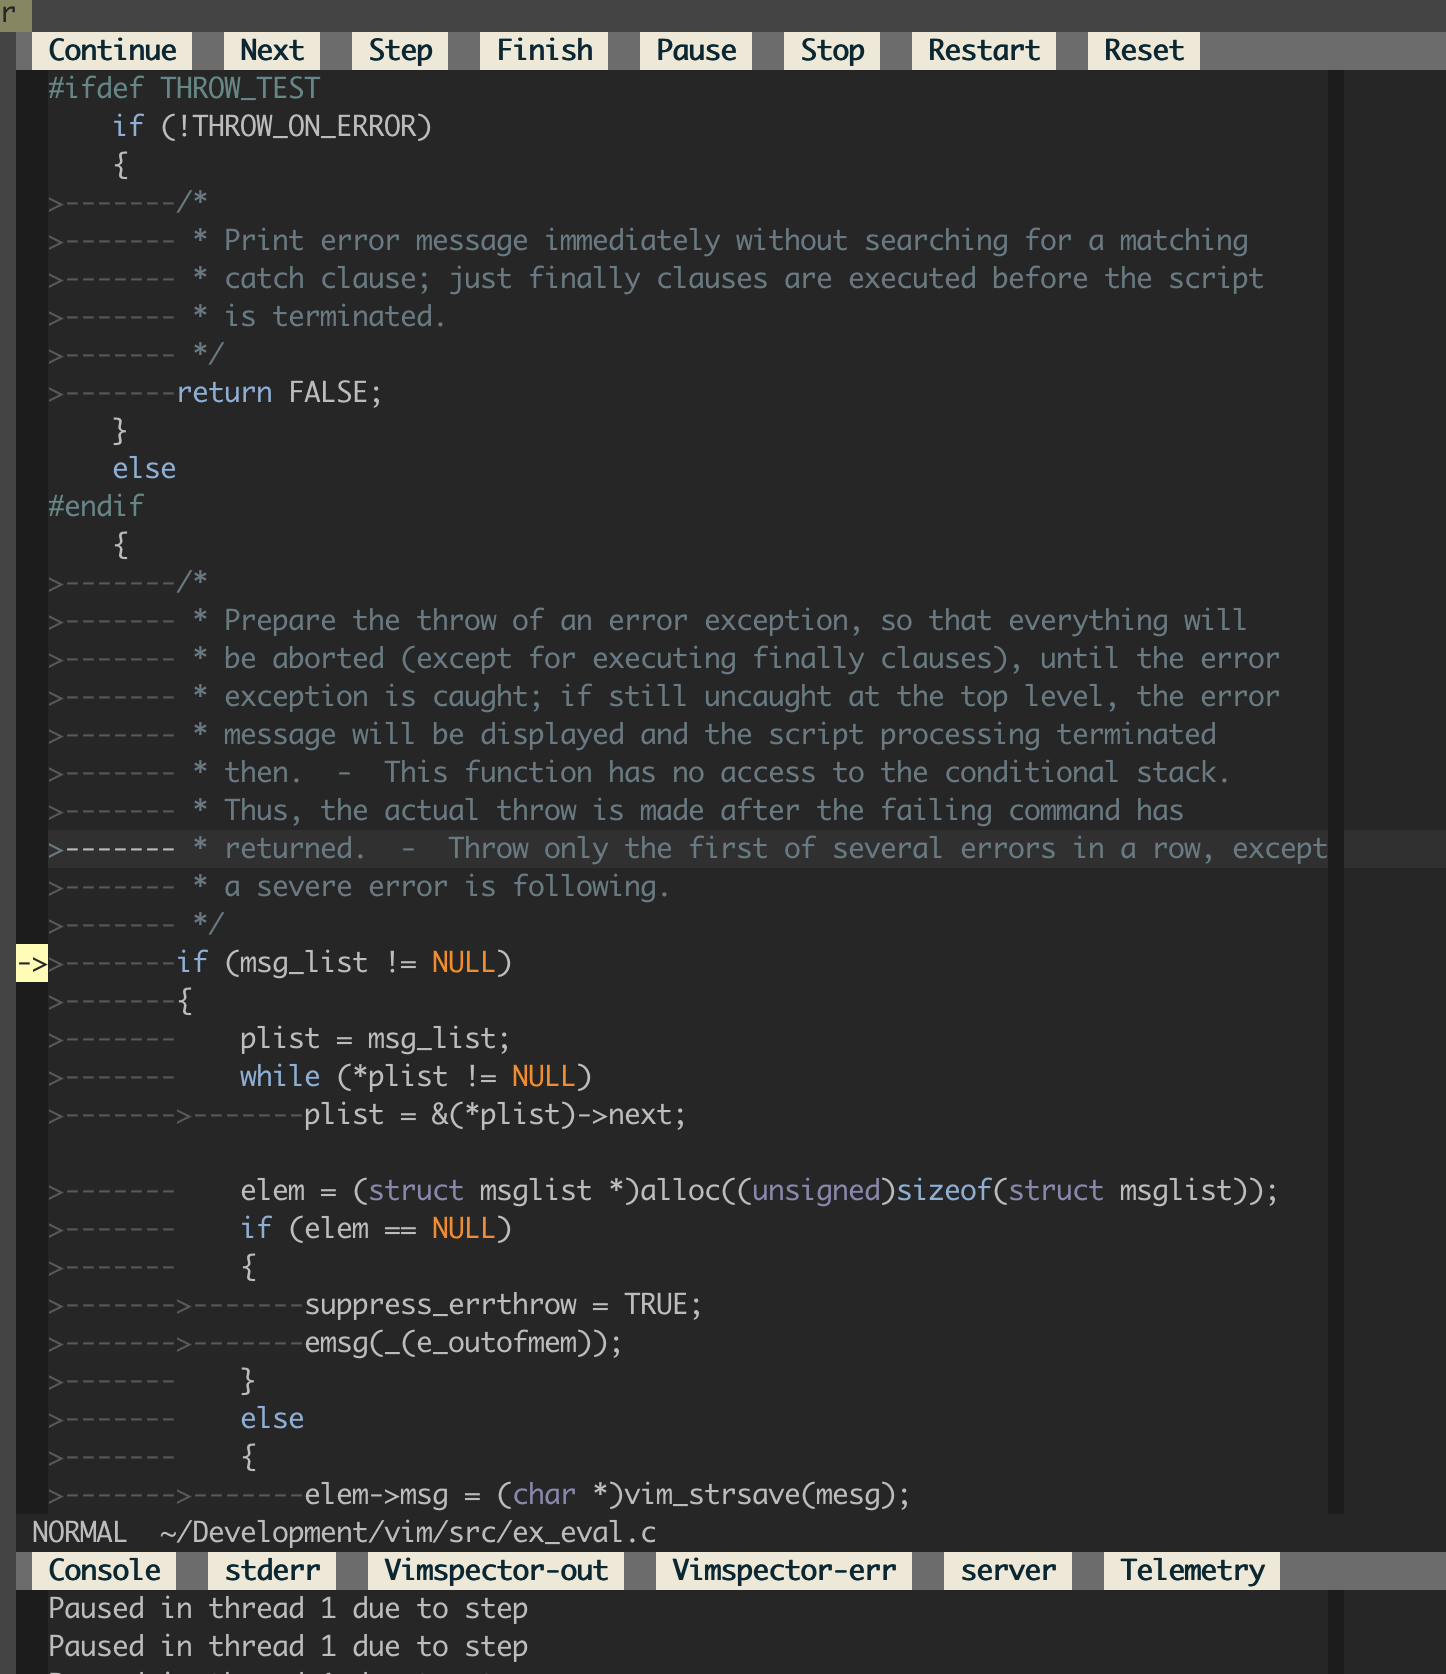
- Step in/out, finish, continue, pause etc. using the WinBar, or mappings.
- Stepping is contextual. By default, stepping is statement granularity. But
- If you really want to, the API is
vimspector#StepInto()etc.. There are also
vimspector#StepSOver() and vimspector#StepIOver() etc. variants for
statement and instruction granularity respectively.
Variables and scopes
- Current scope shows values of locals.
- Use
<CR>, or double-click with left mouse to expand/collapse (+, -). - Set the value of the variable with
<C-CR>(control +<CR>) or
<leader><CR> (if modifyOtherKeys doesn't work for you)
- View the type of the variable via mouse hover.
- When changing the stack frame the locals window updates.
- While paused, hover to see values.
- Create a data breakpoint with
<F9>.
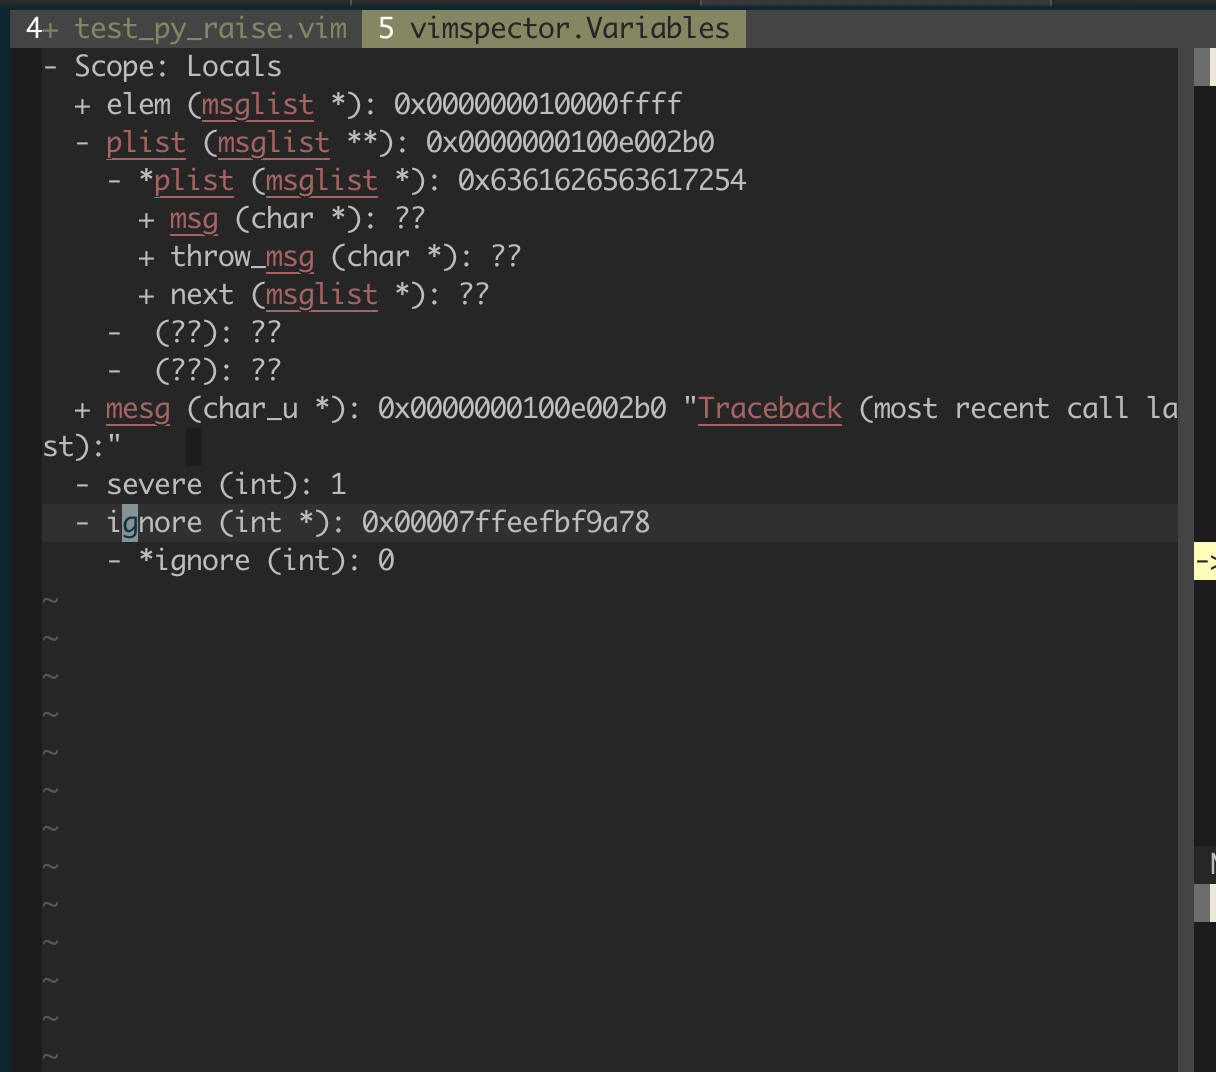
Scopes and variables are represented by the buffer vimspector.Variables.
If you prefer a more verbose display for variables and watches, then you can let g:vimspectorvariablesdisplay_mode = 'full'. By default only the name and value are displayed, with other data available from hovering the mouse or triggering <Plug>VimspectorBalloonEval on the line containing the value in the variables (or watches) window.
Variable or selection hover evaluation
All rules for Variables and scopes apply plus the following:
- With mouse enabled, hover over a variable and get the value it evaluates to.
- Use your mouse to perform a visual selection of an expression (e.g.
a + b)
- Make a normal mode (
nmap) and visual mode (xmap) mapping to
<Plug>VimspectorBalloonEval to manually trigger the popup.
* Set the value of the variable with <C-CR> (control + <CR>) or
<leader><CR> (if modifyOtherKeys doesn't work for you)
* Use regular navigation keys (j, k) to choose the current selection; <Esc>
(or leave the tooltip window) to close the tooltip.
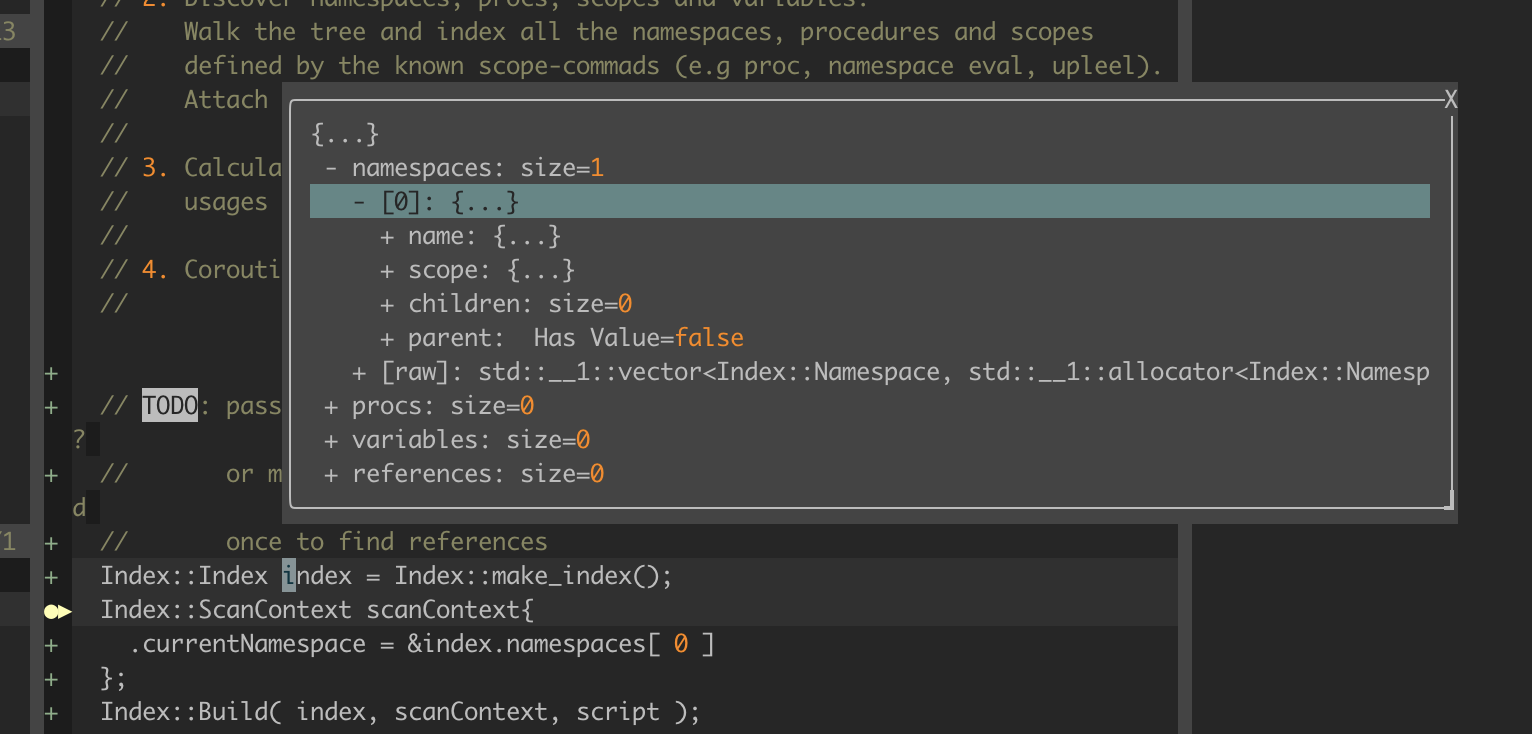
You can disable automatic hovering popup by settings g:vimspectorenableauto_hover=0 before starting the debug session. You can then map something to <Plug>VimspectorBalloonEval and trigger it manually.
Watches
The watch window is used to inspect variables and expressions. Expressions are evaluated in the selected stack frame which is "focussed"
The watches window is a prompt buffer, where that's available. Enter insert mode to add a new watch expression.
- Add watches to the variables window by entering insert mode and
<CR>.
- Alternatively, use
:VimspectorWatch <expression>. Tab-completion for
- View the type of the variable via mouse hover.
- Expand result with
<CR>, or double-click with left mouse. - Set the value of the variable with
<C-CR>(control +<CR>) or
<leader><CR> (if modifyOtherKeys doesn't work for you)
- Delete with
<DEL>. - Create a data breakpoint with
<F9>.
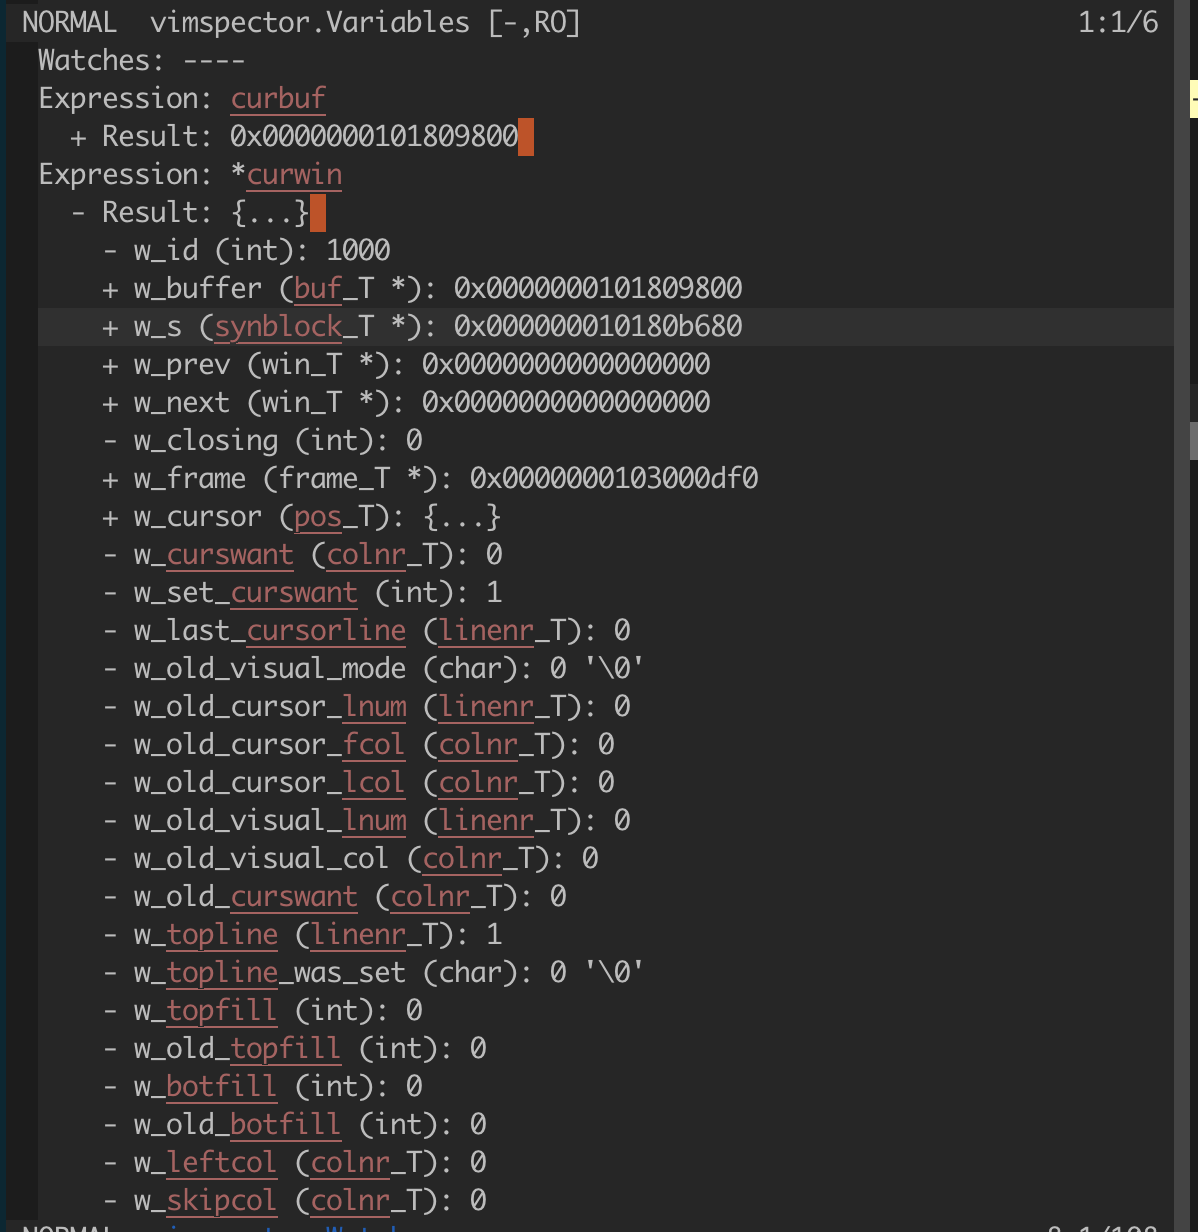
The watches are represented by the buffer vimspector.Watches.
If you prefer a more verbose display for variables and watches, then you can let g:vimspectorvariablesdisplay_mode = 'full'. By default only the name and value are displayed, with other data available from hovering the mouse or triggering <Plug>VimspectorBalloonEval on the line containing the value in the variables (or watches) window.
You can disable automatic hovering popup by settings g:vimspectorenableauto_hover=0 before starting the debug session. You can then map something to <Plug>VimspectorBalloonEval and trigger it manually.
Watch autocompletion
The watch prompt buffer has its omnifunc set to a function that will calculate completion for the current expression. This is trivially used with <Ctrl-x><Ctrl-o> (see :help ins-completion), or integrated with your favourite completion system. The filetype in the buffer is set to VimspectorPrompt.
For YouCompleteMe, the following config works well:
let g:ycmsemantictriggers =  {
  \   'VimspectorPrompt': [ '.', '->', ':', '<' ]
}
Disassembly
- Display disassembly around current PC
- Step over/into/out by instruction (contextually, or using the WinBar)
:VimspectorDisassemble,vimspector#ShowDisassembly()or
<Plug>VimspectorDisassemble

Some debug adapters (few!) support disassembly. The way this works in DAP is a little weird, but in practice vimspector will ask to disassemble a number of in
README truncated. View on GitHub


