
A cyberpunk-style, real-time financial monitor that runs directly in the terminal. It visualizes cryptocurrency and stock market data using ASCII charts and dynamic coloring.
Last updated Jul 4, 2026
215
Stars
20
Forks
1
Issues
0
Stars/day
Attention Score
90
Language breakdown
No language data available.
▸ Files
click to expand
README
Stonks Dashboard


Minimal real-time market dashboard for your terminal
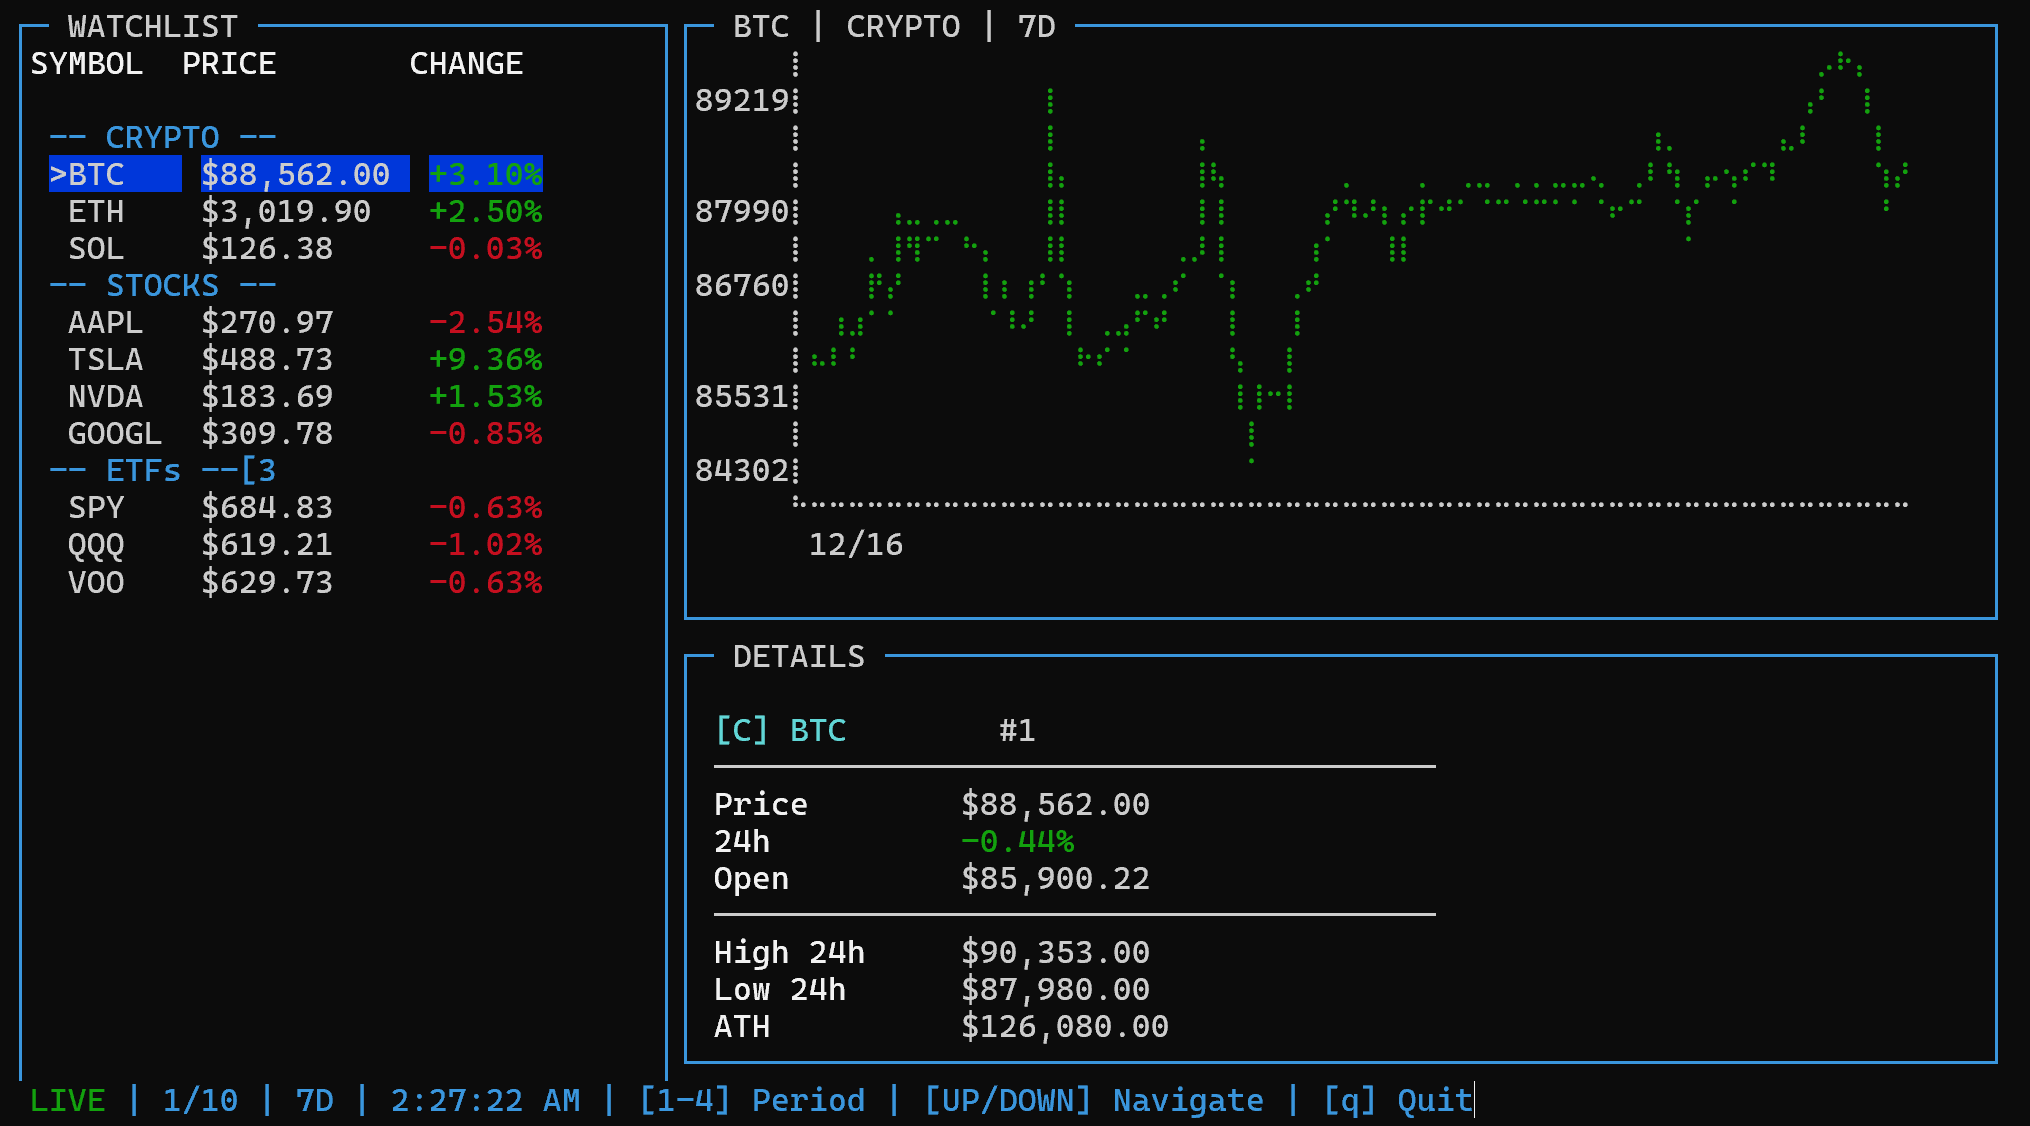
Features
- Watchlist: Crypto, stocks, ETFs in one view
- Trend chart: Periods 1D, 7D, 30D, 90D
- Details panel: Key metrics (price, change, highs/lows)
- Caching & rate limits: Smooth updates with fewer API errors
Quick Start
npx stonks-dashboardOr install globally:
npm install -g stonks-dashboard
stonks-dashboard
Local Development
git clone https://github.com/pierridotite/stonks-dashboard.git
cd stonks-dashboard
npm install
npm start
Controls
↑/↓: Navigate watchlist1–4: Switch period (1D/7D/30D/90D)qorCtrl+C: Quit
Configuration
Edit config.json to customize:
{
  "tickers": ["BTC", "ETH", "AAPL", "TSLA"],
  "cryptoIds": { "BTC": "bitcoin", "ETH": "ethereum" },
  "updateInterval": 120000
}
NOTE: Stocks on the London Stock Exchange can be added by appending .L (e.g. BARC.L), they will be displayed in pounds or pence depending on whether they are above £1
Data Sources
- Crypto: CoinGecko API
- Stocks/ETFs: Yahoo Finance API
cache.json). Crypto details cache ~30 min; price series cache ~1 min.
Requirements
- Node.js (LTS recommended)
License
MIT - See LICENSE
Star History


