
Export metrics from Citrix ADC (NetScaler) to Prometheus
Exporter for Citrix ADC (NetScaler) Stats ===
Description:
This is a simple server that scrapes Citrix ADC stats and exports them via HTTP to Prometheus. Prometheus can then be added as a data source to Grafana to view the Citrix ADC stats graphically.
>Note: > >Now you can directly export the metrics from NetScaler to Prometheus without deploying Citrix ADC metrics exporter. It is recommended to use the direct export instead of using Citrix ADC metrics exporter or observability exporter to export metrics. For more information, see Monitor NetScaler, applications, and application security using Prometheus.
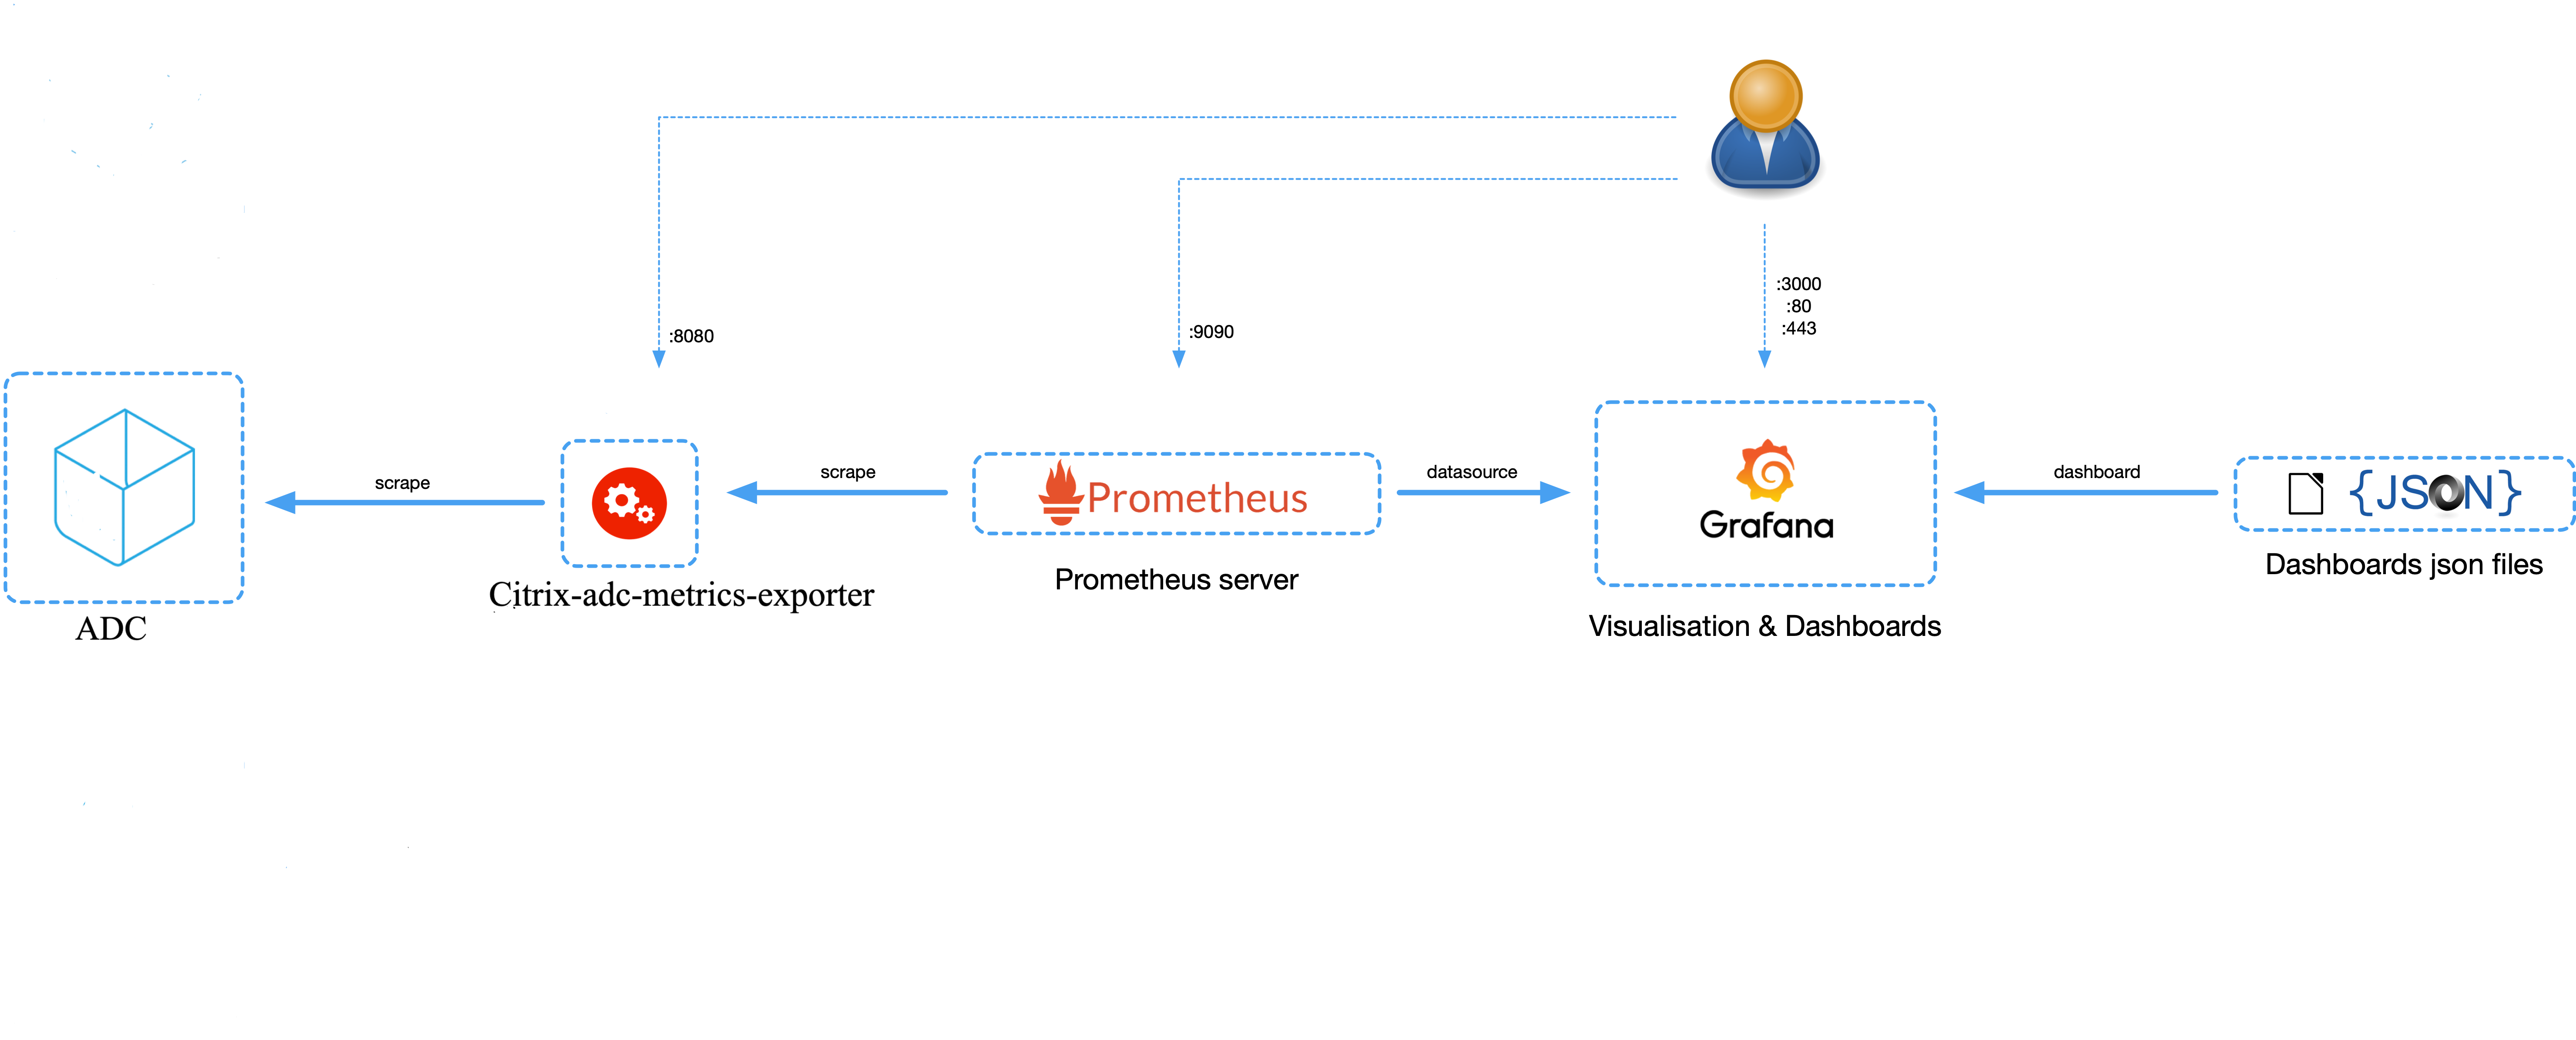 To monitor stats and counters of Citrix ADC instances, citrix-adc-metric-exporter can be run as a container or script. It collects Citrix ADC stats such as total hits to a vserver, http request rate, ssl encryption-decryption rate, etc from the Citrix ADC instances and holds them until the Prometheus server pulls the stats and stores them with a timestamp. Grafana can then be pointed to the Prometheus server to fetch the stats, plot them, set alarms, create heat maps, generate tables, etc as needed to analyse the Citrix ADC stats.
Details about setting up the exporter to work in an environment as given in the figure is provided in the following sections. A note on which Citrix ADC entities/metrics the exporter scrapes by default and how to modify it is also explained. Note:
For more information on directly exporting the metrics from NetScaler (Citrix ADC) to Prometheus without deploying Citrix ADC metrics exporter see Monitoring NetScaler, applications, and application security using Prometheus.
Participate:
You can discuss bugs/feature requests on our Slack channel. To request an invitation to participate in the Citrix ADC Cloud Native Slack channel(citrixadccloudnative.slack.com), please supply your email address using this form: https://podio.com/webforms/22979270/1633242
Release notes
Click here for the release notes of the latest Citrix adc metrix exporter release
Usage:
The exporter can be run as a standalone python script, built into a container or run as a pod in Kubernetes. The corresponding drop-downs explain how to deploy it in each of the manners.
Usage as a Python Script
To use the exporter as a python3 script, few packages needs to be installed. This can be done using
pip3 install -r pip_requirements.txtprometheus-client==0.8.0
requests==2.23.0
PyYAML==5.3.1
tenacity==6.2.0
urllib3==1.25.9Now, create a folder
/exporter.jsonnohup python exporter.py [flags] &flag | Description -----------------|-------------------- --target-nsip | Provide the <IP> of the Citrix ADC to be monitored --port | Specify on which port metrics collected by the exporter should be exposed. Agents like Prometheus will need to scrape this port of the container to collected metrics --metric | Provide a specific metric to load from metrics.json file (eg: 'lbvserver', 'protocolhttp', etc). If not provided, all metric entities from metrics.json will be loaded --secure | Ensures HTTPS connection to ADC. Option 'no'(HTTP) can be provided to collect metrics from Citrix ADC. Default: 'yes'. --start-delay | Specify time for which exporter should sleep before starting metric collection. Default: 10s --timeout | Specify timeout period for exporter to obtain response from target Citrix ADCs. Default: 10s --metrics-file | The location of metrics.json file. Default: /exporter/metrics.json --log-file | The location of exporter.log file. Default: /exporter/exporter.log --log-level | The level of logging. DEBUG, INFO, WARNING, ERROR or CRITICAL Default: INFO --config-file | File with configs such as
-cert-pathThe exporter can be setup as given in the diagram using;
nohup python exporter.py --target-nsip=10.0.0.1 --port 8888 --config-file=config.yaml &NOTE: If default port to connect with ADC is not 80/443 for HTTP/HTTPS respectively, then append --target-nsip with port. For instance, if port for ADC is 9080 then use: --target-nsip=10.0.0.1:9080
File 'config.yaml' should contain username and password of the ADC to which exporter connects to. For reference, refer config.yaml.example which specifies the format for providing the login credentials.
Login credentials can also be provided using environment variables using NSUSER, NSPASSWORD.Though config file input is the preferred method for security concerns.
The user can then access the exported metrics directly thorugh port 8888 on the machine where the exporter is running, or Prometheus and Grafana can be setup to view the exported metrics though their GUI.
Additionals:
As an optional configuration, Citrix ADC exporter allows you to validate the SSL server certificate provided by Citrix ADC.For this:
-- In config.yaml, '--validate-cert' option should be set to 'yes', and certificate path should be provided using'--cacert-path' argument.
-- Please confirm that certificate and '--cert-path' provided is valid.
-- Additionaly, '--validate-cert(default='no')' and '--secure(default='yes')' options should be set to 'yes'.
Usage as a Container
In order to use the exporter as a container, the image
.io/citrix/citrix-adc-metrics-exporter:1.4.9docker pull quay.io/citrix/citrix-adc-metrics-exporter:1.4.9build -f Dockerfile -t <image_name>:<tag> ./Now, exporter can be run using:
docker run -dt -p <hostport>:<containerport> --mount type=bind,source=<host-path-for-config-file>,target=/exporter/config.yaml quay.io/citrix/citrix-adc-metrics-exporter:1.4.9 [flags] --config-file=/exporter/config.yamlflag | Description -----------------|-------------------- --target-nsip | Provide the <IP> of the Citrix ADC to be monitored --port | Specify on which port metrics collected by the exporter should be exposed. Agents like Prometheus will need to scrape this port of the container to collected metrics --metric | Provide a specific metric to load from metrics.json file (eg: 'lbvserver', 'protocolhttp', etc). If not provided, all metric entities from metrics.json will be loaded --secure | Ensures HTTPS connection to ADC. Option 'no'(HTTP) can be provided to collect metrics from Citrix ADC. Default: 'yes'. --start-delay | Specify time for which exporter should sleep before starting metric collection. Default: 10s --timeout | Specify timeout period for exporter to obtain response from target Citrix ADC. Default: 10s --metrics-file | The location of metrics.json file. Default: /exporter/metrics.json --log-file | The location of exporter.log file. Default: /exporter/exporter.log --log-level | The level of logging. DEBUG, INFO, WARNING, ERROR or CRITICAL Default: INFO --config-file | File with configs such as
-cert`,</code></pre>cacert-path<pre><code class="lang-">, etc. Helps supply username and password through file rather than CLI for secure deployment. --validate-cert | Specify if ca certifcate is to be validated to access Citrix ADC. Default: 'no'. Valid value: 'yes' --cacert-path | Provide valid cert path if "--validate-cert" set to 'yes'. cert path will only be considered if '--validate-cert' is set to 'yes'. --k8sCICprefix | Provide the prefix if exporter is used in kubernetes enviroment with Citrix ingress controller, "k8singressservice_stats" dashboard can be used only if correct CICprefix is provided and CIC version is 1.2.0 and above. Default prefix is "K8s"
To setup the exporter as given in the diagram, the following command can be used:</code></pre> docker run -dt -p 8888:8888 --mount type=bind,source=/path/to/config.yaml,target=/exporter/config.yaml --name citrix-adc-exporter quay.io/citrix/citrix-adc-metrics-exporter:1.4.9 --target-nsip=10.0.0.1 --port=8888 --config-file=/exporter/config.yaml <pre><code class="lang-">This directs the exporter container to scrape the 10.0.0.1 IP, and the expose the stats it collects on port 8888.
NOTE: If default port to connect with ADC is not 80/443 for HTTP/HTTPS respectively, then append --target-nsip with port. For instance, if port for ADC is 9080 then use: --target-nsip=10.0.0.1:9080
File 'config.yaml' should contain username and password of the ADC to which exporter connects to. For reference, refer config.yaml.example which specifies the format for providing the login credentials. Config.yaml file then needs to be mounted to the container at fixed target specified('/exporter/config.yaml') only.
Login credentials can also be provided using environment variables using NSUSER, NSPASSWORD.Though config file input is the preferred method for security concerns.
The user can then access the exported metrics directly thorugh port 8888 on the machine where the exporter is running, or Prometheus and Grafana can be setup to view the exported metrics though their GUI.
NOTE: In the command above, the value of the</code></pre>--port<pre><code class="lang-">flag should be the same as the</code></pre>container_port<pre><code class="lang-">.
Additionals:
As an optional configuration, Citrix ADC exporter allows you to validate the SSL server certificate provided by Citrix ADC.
For this:
-- In config.yaml, '--validate-cert' option should be set to 'yes', and certificate path should be provided using'--cacert-path' argument.
-- Please confirm that certificate and '--cert-path' provided is valid.
-- Additionaly, '--validate-cert(default='no')' and '--secure(default='yes')' options should be set to 'yes' for certificate to be considered.
Certificate should then be mounted at the '--cacert-path' provided. For instance, if cert is 'cacert.pem' and '--cacert-path' provided in 'config.yaml' is '/exporter/cacert.pem'</code></pre> docker run -dt -p 8888:8888 --mount type=bind,source=/path/to/config.yaml,target=/exporter/config.yaml --mount type=bind,source=/path/to/cacert.pem,target=/exporter/cacert.pem --name citrix-adc-exporter quay.io/citrix/citrix-adc-metrics-exporter:1.4.9 --target-nsip=10.0.0.1 --port=8888 --config-file=/exporter/config.yaml <pre><code class="lang-">NOTE: If default port to connect with ADC is not 80/443 for HTTP/HTTPS respectively, then append --target-nsip with port. For instance, if port for ADC is 9080 then use: --target-nsip=10.0.0.1:9080
Cert validation options can also be provided using environment variables using NSVALIDATECERT, NSCACERTPATH. Thoughconfig file input is the preferred method.
</details>
<details> <summary>Run the exporter as a Pod in Kubernetes</summary> <br>
To provide the login credentials to access ADC, create a secret and mount the volume at mountpath "/mnt/nslogin".</code></pre> kubectl create secret generic nslogin --from-literal=username=<citrix-adc-user> --from-literal=password=<citrix-adc-password> -n <namespace> <pre><code class="lang-">The following yaml file can be used to deploy the exporter as a pod in Kuberenetes and expose it as a service. Here, the necessary flags are provided as a list in the</code></pre>args:<pre><code class="lang-">section of the yaml file.</code></pre> apiVersion: v1 kind: Pod metadata: name: exporter labels: app: exporter spec: containers: - name: exporter image: quay.io/citrix/citrix-adc-metrics-exporter:1.4.9 args: - "--target-nsip=10.0.0.1" - "--port=8888" imagePullPolicy: Always volumeMounts: - name: nslogin mountPath: "/mnt/nslogin" readOnly: true securityContext: readOnlyRootFilesystem: true volumes: - name: nslogin secret: secretName: nslogin
apiVersion: v1 kind: Service metadata: name: exporter labels: app: exporter spec: type: ClusterIP ports: - port: 8888 targetPort: 8888 name: exporter-port selector: app: exporter <pre><code class="lang-">NOTE: If default port to connect with ADC is not 80/443 for HTTP/HTTPS respectively, then append --target-nsip with port. For instance, if port for ADC is 9080 then use: --target-nsip=10.0.0.1:9080
Login Credentials can also be provided using environment variables NSUSER, NSPASSWORD. Though, secret volume is the preffered method for security.
Flags which can be provided to the exporter in the</code></pre>args:<pre><code class="lang-">section are:
flag&nbsp;&nbsp;&nbsp;&nbsp;&nbsp;&nbsp;&nbsp;&nbsp;&nbsp;&nbsp;&nbsp;&nbsp;&nbsp;&nbsp;&nbsp;&nbsp;&nbsp;&nbsp; | Description -----------------|-------------------- --target-nsip | Provide the &lt;IP&gt; of the Citrix ADC to be monitored --port | Specify on which port metrics collected by the exporter should be exposed. Agents like Prometheus will need to scrape this port of the container to collected metrics --metric | Provide a specific metric to load from metrics.json file (eg: 'lbvserver', 'protocolhttp', etc). If not provided, all metric entities from metrics.json will be loaded --secure | Ensures HTTPS connection to ADC. Option 'no'(HTTP) can be provided to collect metrics from Citrix ADC. Default: 'yes'. --start-delay | Specify time for which exporter should sleep before starting metric collection. Default: 10s --timeout | Specify timeout period for exporter to obtain response from target Citrix ADC. Default: 10s --metrics-file | The location of metrics.json file. Default: /exporter/metrics.json --log-file | The location of exporter.log file. Default: /exporter/exporter.log --log-level | The level of logging. DEBUG, INFO, WARNING, ERROR or CRITICAL Default: INFO --config-file | File with configs such as</code></pre>username<pre><code class="lang-">,</code></pre>password<pre><code class="lang-">,</code></pre>validate-cert<pre><code class="lang-">,</code></pre>cacert-path<pre><code class="lang-">, etc. Helps supply username and password through file rather than CLI. --validate-cert | Specify if ca certifcate is to be validated to access Citrix ADC. Default: 'no'. Valid value: 'yes' --cacert-path | Provide valid cert path if "--validate-cert" set to 'yes'. cert path will only be considered if '--validate-cert' is set to 'yes'. --k8sCICprefix | Provide the prefix if exporter is used in kubernetes enviroment with Citrix ingress controller, "k8singressservice_stats" dashboard can be used only if correct CICprefix is provided and CIC version is 1.2.0 and above. Default prefix is "K8s"
Additionals:
As an optional configuration, Citrix ADC exporter allows you to validate the SSL server certificate provided by Citrix ADC. For this:
User need to first mount the secret at any valid path inside pod. For instance, for CA certificate 'cacert.pem' and name give as 'exp-ca-cert'</code></pre>
kubectl create secret generic exp-ca-cert --from-file=./cacert.pem"
<pre><code class="lang-">-- In args section of yaml, '--validate-cert' option should be set to 'yes', and certificate path should be provided using'--cacert-path' argument.
-- Please confirm that mounted certificate and '--cert-path' provided are valid.
-- Additionaly, '--validate-cert(default='no')' and '--secure(default='yes')' options should be set to 'yes' for certificate to be considered.</code></pre> apiVersion: v1 kind: Pod metadata: name: exporter labels: app: exporter spec: containers: - name: exporter image: quay.io/citrix/citrix-adc-metrics-exporter:1.4.9 args: - "--target-nsip=10.0.0.1" - "--port=8888" - "--validate-cert=yes" - "--cacert-path=/mnt/certs/cacert.pem" imagePullPolicy: Always volumeMounts: - name: nslogin mountPath: "/mnt/nslogin" readOnly: true - name: exp-ca-cert mountPath: "/mnt/certs/" readOnly: true securityContext: readOnlyRootFilesystem: true volumes: - name: nslogin secret: secretName: nslogin - name: exp-ca-cert secret: secretName: exp-ca-cert
apiVersion: v1 kind: Service metadata: name: exporter labels: app: exporter spec: type: ClusterIP ports: - port: 8888 targetPort: 8888 name: exporter-port selector: app: exporter <pre><code class="lang-">NOTE: If default port to connect with ADC is not 80/443 for HTTP/HTTPS respectively, then append --target-nsip with port. For instance, if port for ADC is 9080 then use: --target-nsip=10.0.0.1:9080
Cert Credentials can also be provided using environment variables NSVALIDATECERT, NSCACERTPATH instead of args '--validate-cert', '--cacert-path' respectively.
</details>
<details> <summary>Automatically monitor workloads in Kubernetes using Citrix ADC and Prometheus Operator</summary> <br> When the Citrix ADC is used as an Ingress to workloads in a Kubernetes, cluster, you can use the exporter along with the Prometheus Operator (https://github.com/coreos/prometheus-operator) to automatically monitor new workloads as they are deployed. https://developer-docs.citrix.com/projects/citrix-k8s-ingress-controller/en/latest/metrics/promotheus-grafana/ </details>
Citrix ADC configuration:
It is preferable to create specific user for data scraping from Citrix ADC with permissions to stats data only.
<details> <summary>Citrix ADC config example</summary></code></pre>
Create a new Command Policy which is only allowed to run the stat command
add system cmdPolicy stats-policy ALLOW (^stat.*|show ns license|show serviceGroup|show ssl certKey)
Create a new user
Change the 'password' in accordance with your password policy
add system user stats-user "password" -externalAuth DISABLED
Bind the local user account to the created Command Policy
bind system user stats-user stats-policy 100
<pre><code class="lang-"></details>
Stats Exported by Default:
The exporter is configured to export some of the most commonly used stats for a Citrix ADC device. They are mentioned in the</code></pre>metrics.json<pre><code class="lang-">file and summarized in the table below:
Sl. No. | STATS | NS nitro name --------|---------------------------|-------------- 1 | LB vserver stats | "lbvserver" 2 | CS vserver stats | "csvserver" 3 | HTTP stats | "protocolhttp" 4 | TCP stats | "protocoltcp" 5 | IP stats | "protocolip" 6 | SSL stats | "ssl" 7 | Interface stats | "Interface" (capital 'i') 8 | Service stats | "service" 9 | Service group stats | "services" 10 | Bandwidth Capacity stats | "nscapacity" 11 | SSL vserver stats | "sslvserver" 12 | System info stats | "system" 13 | System cpu stats | "systemcpu" 14 | AAA stats | "aaa" 15 | ADC Probe success | "1" if successful, else "0"
Exporting Additional Stats which are not Included by Default:
In this document, the term 'entity' has been used to refer to Citrix ADC entities such as HTTP, Interfaces, LB, etc. The term 'metrics' has been used to refer to the stats collected for these entities. For example, the entity</code></pre>lbvserver<pre><code class="lang-">has metrics such as</code></pre>totalpktsent<pre><code class="lang-">,</code></pre>tothits<pre><code class="lang-">,</code></pre>requestsrate<pre><code class="lang-">, etc. These metrics are classified by Prometheus into two categories --</code></pre>counters<pre><code class="lang-">and</code></pre>gauges<pre><code class="lang-">as per this link.
Metrics whose value can only increase with time are called counters and those which can increase or decrease are called gauges. For the example of</code></pre>lbvserver<pre><code class="lang-">,</code></pre>totalpktsent<pre><code class="lang-">and</code></pre>tothits<pre><code class="lang-">are counters, while</code></pre>requestsrate<pre><code class="lang-">is a gauge. Accordingly, entities and their metrics have been provided in the</code></pre>metrics.json<pre><code class="lang-">file. By modifying</code></pre>metrics.json<pre><code class="lang-">, new entities and their metrics which are not exported by default can be included. For example, to export</code></pre>aaa<pre><code class="lang-">stats, the lines given between</code></pre>-.-.-.-<pre><code class="lang-">can be added as follows:
<details> <summary>metrics.json</summary> <br></code></pre> { "system": { "counters": [ ["numcpus", "citrixadccpunumber"] ],
"gauges": [ ["cpuusagepcnt", "citrixadccpuusage_percent"], ["mgmtcpuusagepcnt", "citrixadccpumanagementcpuusage_percent"], ["pktcpuusagepcnt", "citrixadccpupacketcpuusage_percent"], ["rescpuusagepcnt", "citrixadccpurescpuusage_percent"] ] },
-.-.-.-.-.-.-.-.-.-.-.-.-.-.-.-.-.-.-.-.-.-.-.-.-.-.-.-.-.-.-.-.-.-.-.-.-.-.-.-.-.-.-.-. "aaa": { "counters": [ ["aaatotsessions", "citrixadcaaatot_sessions"], ["aaatotsessiontimeout", "citrixadcaaatotsessiontimeout"] ], "gauges": [ ["aaasessionsrate', 'citrixadcaaasessions_rate"], ["aaasessiontimeoutrate ', 'citrixadcaaasessiontimeoutrate"] ] }, -.-.-.-.-.-.-.-.-.-.-.-.-.-.-.-.-.-.-.-.-.-.-.-.-.-.-.-.-.-.-.-.-.-.-.-.-.-.-.-.-.-.-.-.
"protocolhttp": { "counters": [ ["httptotrequests", "citrixadchttptot_requests"], ["httptotresponses", "citrixadchttptot_responses"], ["httptotposts", "citrixadchttptot_posts"], ["httptotgets", "citrixadchttptot_gets"], ... ... ["httptotchunkedrequests", "citrixadchttptotchunkedrequests"] ],
"gauges": [ ["httprequestsrate", "citrixadchttprequests_rate"], ["spdystreamsrate", "citrixadchttpspdystreamsrate"], ... ... ["http11responsesrate", "citrixadchttp11responsesrate"] ] },
"lbvserver": { "counters": [ ["totalpktssent", "citrixadclbpacketssenttotal"], ["tothits", "citrixadclbhits_total"], ["totalrequestbytes", "citrixadclbrequestbytestotal"], ... ... ["totalresponsebytes", "citrixadclbresponsebytesreceived_total"] ],
"gauges": [ ["requestbytesrate", "citrixadclbrequestratebytes"], ["requestsrate", "citrixadclbrequest_rate"], ... ... ["inactsvcs", "citrixadclbinactiveservicescount"] ],
["name", "citrixadclbname"], ["type", "citrixadclbtype"], ] },
... ... ... }
<pre><code class="lang-"></details> <br>
On a given Citrix ADC, some entities such as lbvserver, csvserver, interfaces, etc can have multiple instances of that entity configured, each having its own name. Such entities have an additional structure in</code></pre>metrics.json<pre><code class="lang-">called</code></pre>label<pre><code class="lang-">. A label is used for such entities to differenciate stats among different instances of that entity based on name, ip, type, or any other suitable characteristic of that entitiy. Other entities such as http, tcp, ssl are present as a single global parameter for the Citrix ADC, and thus do not have a</code></pre>label<pre><code class="lang-">section in</code></pre>metrics.json<pre><code class="lang-">.
Verification of Exporter Functionality
To verify if the exporter is scraping and exporting stats from Citrix ADC instances, the following url can be opened on a web browser or curl command can be fired from CLI:</code></pre> http://<hostIP>:<port> curl http://<hostIP>:<port> <pre><code class="lang-">where</code></pre>hostIP<pre><code class="lang-">is the IP of the host on which the python script or container is running, and</code></pre>port<pre><code class="lang-">is the value of the</code></pre>--port<pre><code class="lang-">flag which had been provided (</code></pre>8888<pre><code class="lang-">as per the example). All the stats for all the entities configured on the Citrix ADC and provided in</code></pre>metrics.json<pre><code class="lang-">should appear along with their live values. An example response would be as follows;
<details> <summary>Sample Output</summary> <br></code></pre>
HELP httptotrx_packets tcptotrxpkts
TYPE httptotrx_packets counter
httptotrx_packets{nsip="10.0.0.1"} 2094931640.0 HELP tcptotrx_bytes tcptotrxbytes
TYPE tcptotrx_bytes counter
tcptotrx_bytes{nsip="10.0.0.1"} 735872803514.0 HELP tcptxbytes tcptottxbytes
TYPE tcptxbytes counter
tcptxbytes{nsip="10.0.0.1"} 249210838820.0 HELP tcptottx_packets tcptottxpkts
TYPE tcptottx_packets counter
tcptottx_packets{nsip="10.0.0.1"} 2082562915.0 HELP tcptotclientconnectionsopened tcptotclientconnopened
TYPE tcptotclientconnectionsopened counter
tcptotclientconnectionsopened{nsip="10.0.0.1"} 35606929.0 iptotbadmacaddresses{nsip="10.0.0.1"} 0.0 HELP iprxpackers_rate iprxpktsrate
TYPE iprxpackers_rate gauge
iprxpackers_rate{nsip="10.0.0.1"} 17703.0 HELP iprxbytes_rate iprxbytesrate
TYPE iprxbytes_rate gauge
iprxbytes_rate{nsip="10.0.0.1"} 5797562.0 HELP iptxpackets_rate iptxpktsrate
TYPE iptxpackets_rate gauge
iptxpackets_rate{nsip="10.0.0.1"} 18119.0 HELP ipbytesrate iptxbytesrate
TYPE ipbytesrate gauge
ipbytesrate{nsip="10.0.0.1"} 1038524.0 HELP servicestotrequests totalrequests
TYPE servicestotrequests counter
servicestotrequests{nsip="10.0.0.2",serviceip="20.0.0.56",servicegroupname="svcgrp"} 10.0 servicestotrequests{nsip="10.0.0.2",serviceip="20.0.0.57",servicegroupname="svcgrp"} 11.0 servicestotrequests{nsip="10.0.0.2",serviceip="20.0.0.60",servicegroupname="svcgrp2"} 4.0 HELP servicestotresponse_bytes totalresponsebytes
TYPE servicestotresponse_bytes counter
servicestotresponsebytes{nsip="10.0.0.2",serviceip="20.0.0.56",servicegroup_name="svcgrp"} 2320.0 servicestotresponsebytes{nsip="10.0.0.2",serviceip="20.0.0.57",servicegroup_name="svcgrp"} 2552.0 servicestotresponsebytes{nsip="10.0.0.2",serviceip="20.0.0.60",servicegroup_name="svcgrp2"} 936.0 HELP servicestotrequest_bytes totalrequestbytes
TYPE servicestotrequest_bytes counter
servicestotrequestbytes{nsip="10.0.0.2",serviceip="20.0.0.56",servicegroup_name="svcgrp"} 860.0 servicestotrequestbytes{nsip="10.0.0.2",serviceip="20.0.0.57",servicegroup_name="svcgrp"} 946.0 servicestotrequestbytes{nsip="10.0.0.2",serviceip="20.0.0.60",servicegroup_name="svcgrp2"} 344.0 <pre><code class="lang-"></details> <br>
Stats (of counter and gauge type) for enities such as http, tcp, ip, and service_groups is seen in the example response given above. Labels attached to each stat appear in the curly braces</code></pre>{}<pre><code class="lang-">next to the stat name.
Prometheus and Grafana Integration
This section describes how to bring up basic Prometheus and Grafana containers to provide an end to end data collection and visualization setup.
<details> <summary>Setup of Prometheus</summary> <br>
These steps can be followed to setup a Prometheus container:
- Pull the docker image:</code></pre>docker pull prom/prometheus<pre><code class="lang-">.
- Create the</code></pre>prometheus.cfg<pre><code class="lang-">file as given below, and providie the Exporter's IP and Port in the place of</code></pre><EXPORTERIP><pre><code class="lang-">and</code></pre><EXPORTERPORT><pre><code class="lang-">. For example, the targets line might read</code></pre>- targets: ['10.100.200.3:8888']<pre><code class="lang-">.</code></pre>
global: scrape_interval: 15s scrape_timeout: 10s
external_labels: monitor: 'prometheus-monitor'
scrape_configs:
- job_name: prometheus
static_configs: - targets: ['<EXPORTERIP>:<EXPORTERPORT>'] <pre><code class="lang-">3. Run the Prometheus container while providing the location of the</code></pre>prometheus.cfg<pre><code class="lang-">file created in the above step: <br></code></pre>docker run -dt -p 9090:9090 -v /path/to/prometheus.cfg:/etc/prometheus/prometheus.cfg prom/prometheus:latest --config.file=/etc/prometheus/prometheus.cfg<pre><code class="lang-">4. VERIFICATION: Go to the Prometheus web page and under the "Status" dropdown select "Targets". The exporter should appear as a target and in a few minutes time, must come up in</code></pre>UP<pre><code class="lang-">state. This means that Prometheus is able to collect stats from the Exporter.
</details> <br>
<details> <summary>Setup of Grafana</summary> <br>
The steps bellow can be followed to setup up a Grafana container with a sample dashboard.
- Pull grafana image:</code></pre>docker pull grafana/grafana:latest<pre><code class="lang-">2. Run grafana container:</code></pre>docker run -dt -p 3000:3000 grafana/grafana:latest<pre><code class="lang-">3. Import any of the sample grafana dashboard files: Login to Grafana using admin:admin, from the column on the left select the</code></pre>+<pre><code class="lang-">symbol, select "Import", and select "upload .json file". Now, navigate to and upload "sampleservicestats.json" or "samplesystemstats.json".
<img src="images/grafana-import-json.png" width="200">
- To start seeing graphs and values in the dashboard, add the Prometheus datasource(s) to Grafana. While adding the datasource, ensure the name of the Prometheus datasource starts with the word "prometheus" (eg. prometheus_datasource1). Once added, datasources starting with the word "prometheus" will automatically get detected in the dropdown filters of the dashboard.
<img src="images/grafana-datasource-1.png" width="200">
<img src="images/grafana-datasource-2.png" width="300">
- Usage of Dashboard: For K8s CIC set up(providing K8sCICPrefix), with "k8scicingressservicesstats.json",dashboard shows service requests, surque queue, RPS and Invalid Request/Response. User can select any of the configured ingress and then apply filter for a given ingress from the drop down menu for ingress.Fro non-k8s setup, one can use "samplelbstats.json" for all lbvservers configured on ADC for some counters. And with "samplesystemstats.json", dashboard shows CPU utilization, Memory Utilization and bandwidth capacity utilization where user can also set an alert. The dashboard can be expanded to include graphs of any other stats which the exporter is collecting. For more information on modifying the Grafana dashboard, please take a look at their documentation or demo videos.
<img src="images/k8s-service-stats-dashboard.png" width="400"> <img src="images/system-stats-dashboard.png" width="400">
</details> <br>
Troubleshooting:
<details> <summary>1. Grafana dashboard has no plots</summary> <br>
If the graphs on the Grafana dashboards do not have any values plotted (not even a flat '0' value line), this means that Grafana is unable to obtain stats from its datasource. The following can be done:
i. Check if the prometheus datasource is saved and working properly. On saving the datasource after providing the Name and IP, a "Data source is working" message should appear in green indicating the datasource is reachable and detected. ii. If the dashboard was created using</code></pre>samplegrafanadashboard.json<pre><code class="lang-">, ensure the name given to the Prometheus datasource begins with the word "prometheus", with all lowercase letters. iii. Check the Targets page of prometheus to see if the requried target exporter is in</code></pre>DOWN<pre><code class="lang-">state.
</details> <br>
<details> <summary>2. DOWN: Context deadline exceeded</summary> <br>
If this appears against any of the exporter target of Prometheus, this means that Prometheus is unable to connect to that exporter, or is unable to fetch all the metrics from that exporter within the given</code></pre>scrape_timeout<pre><code class="lang-">.
i. If Prometheus Operator is being used</code></pre>scrape_timeout<pre><code class="lang-">is usually adjusted automatically and such an error means that the exporter itself is not reachable ii. If a standalone Promtheus container/pod is being used, try increasing the</code></pre>scrapeinterval<pre><code class="lang-">and</code></pre>scrapetimeout<pre><code class="lang-">in the</code></pre>/etc/prometheus/prometheus.cfg<pre><code class="lang-">file to allow for more time to collect the metrics.
</details> <br>
<details> <summary>3. Empty values next to metric names</summary> <br>
It may be observed that some metrics are being received by Prometheus but have no value associated with them. This means that that the exporter is unable to collect that particular metric from the Citrix ADC. It could be either becuase:
i. The device provided as a</code></pre>--target-nsip<pre><code class="lang-">is reachable on the IP and port but is not a Citrix ADC, or ii. The metric being fetched does not exist in the Citrix ADC. Possibly due to it being an invalid metric name. </details> <br>
NOTE: The exporter is designed to catch and handle all exceptions that could arise duriing its operation. This is a requirement for the Citrix Ingress Controller's metrics-visualizer. To debug errors the exporter might have run into, provide the</code></pre>--log-level=DEBUG
`` flag.


