
OpenTelemetry-native LLM observability CLI. Point any OTEL exporter at it and watch your LLM/agent traces in real time.
Axon

Axon is a local observability tool for LangChain and OpenTelemetry-instrumented AI agents. It receives trace data from your application, stores it on your machine, and gives you a real-time dashboard to monitor and debug every LLM call, tool invocation, and chain execution. No cloud account is required and no data leaves your environment.
Features
Overview - shows your OTLP endpoint and integration snippets the moment Axon starts 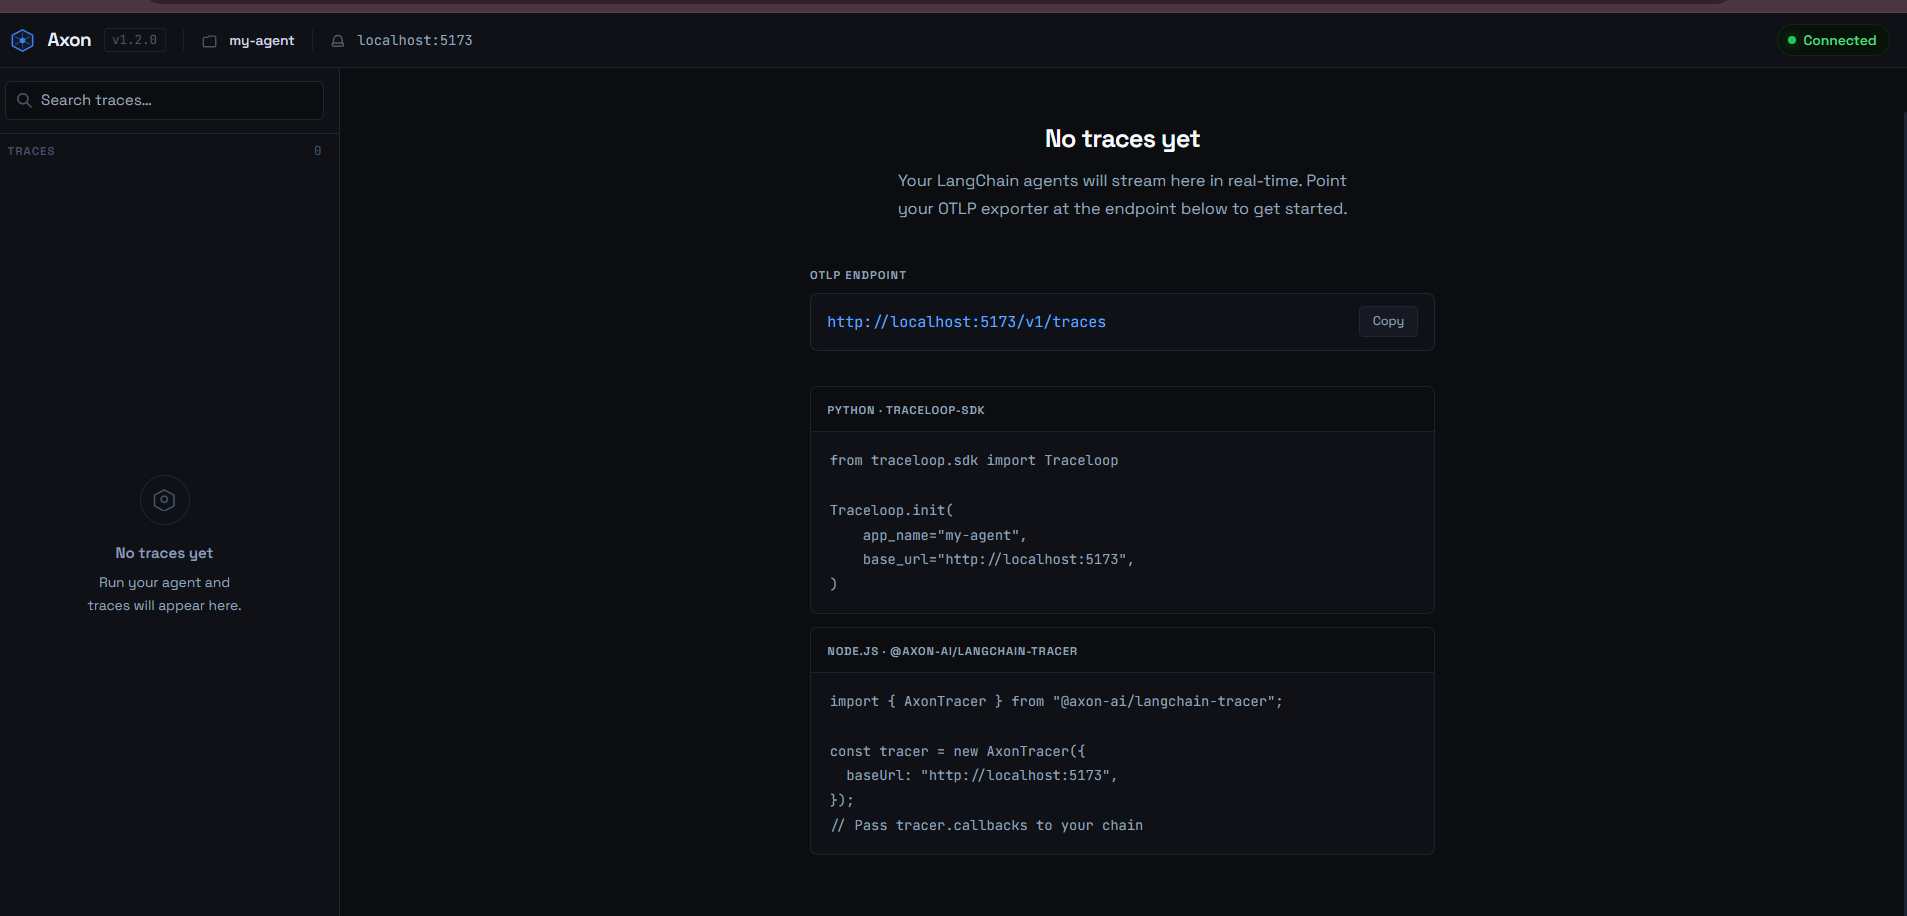
Trace Views
Transcript — renders the run as a conversation with tool call inputs and outputs inline 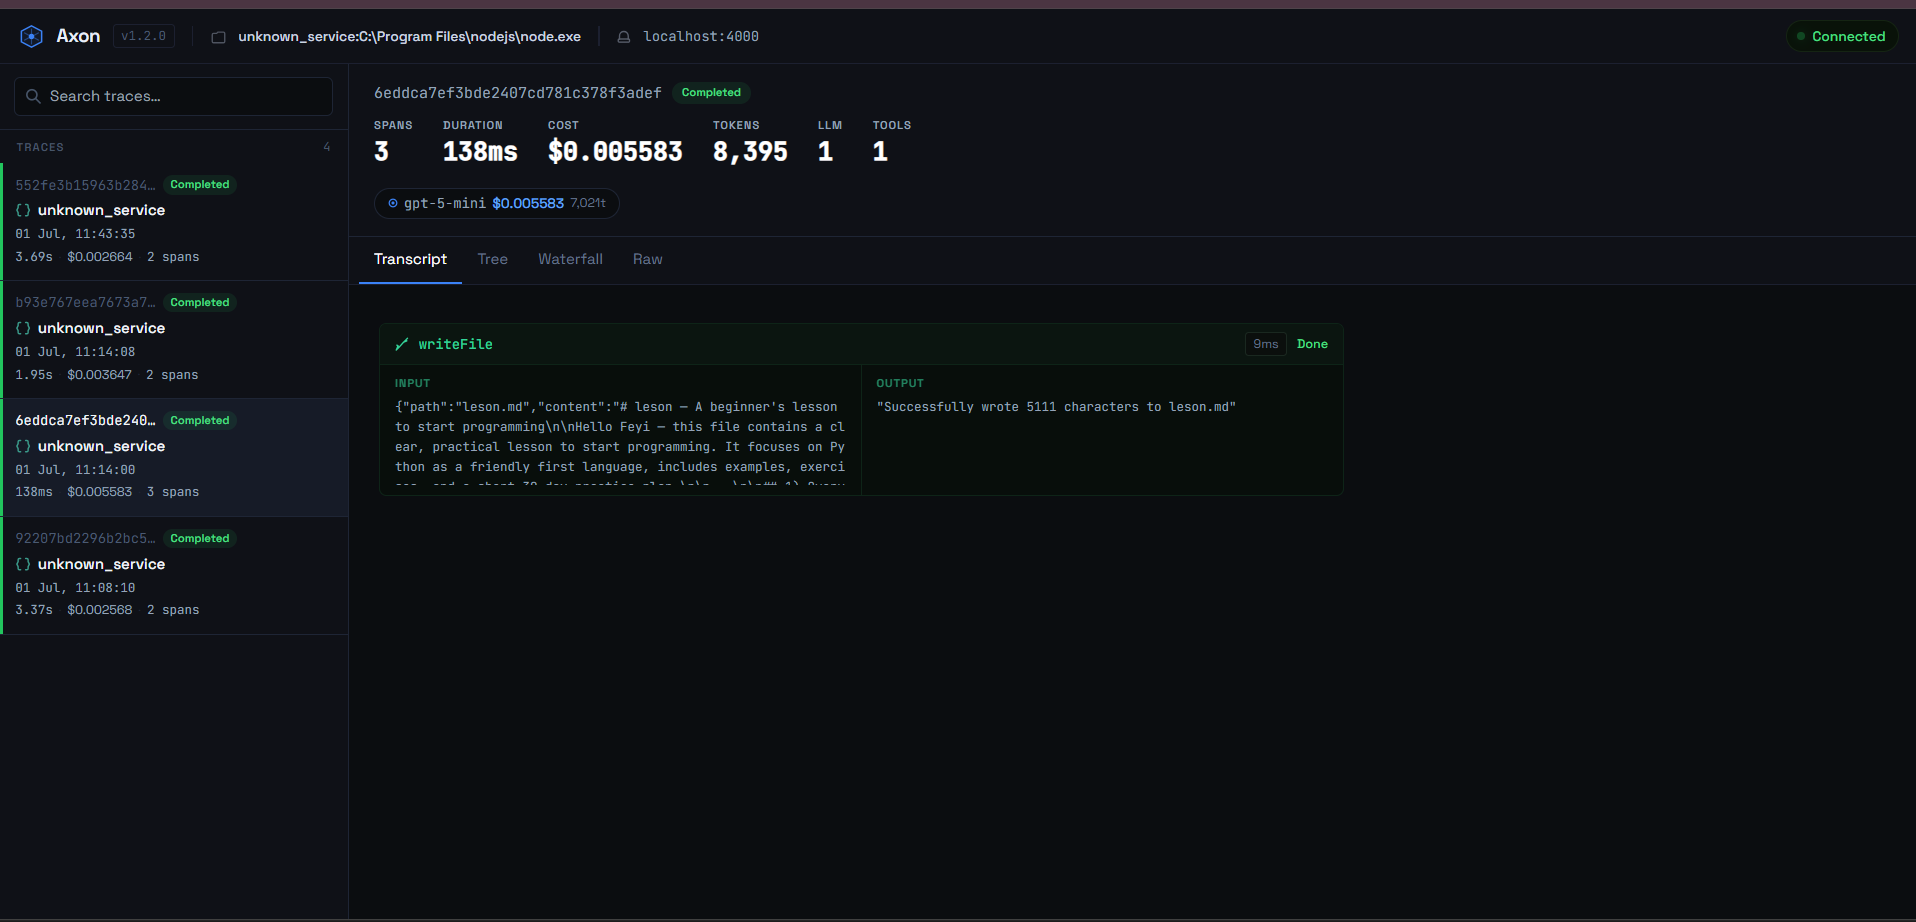
Waterfall — each span as a horizontal bar on a shared time axis with a detail panel 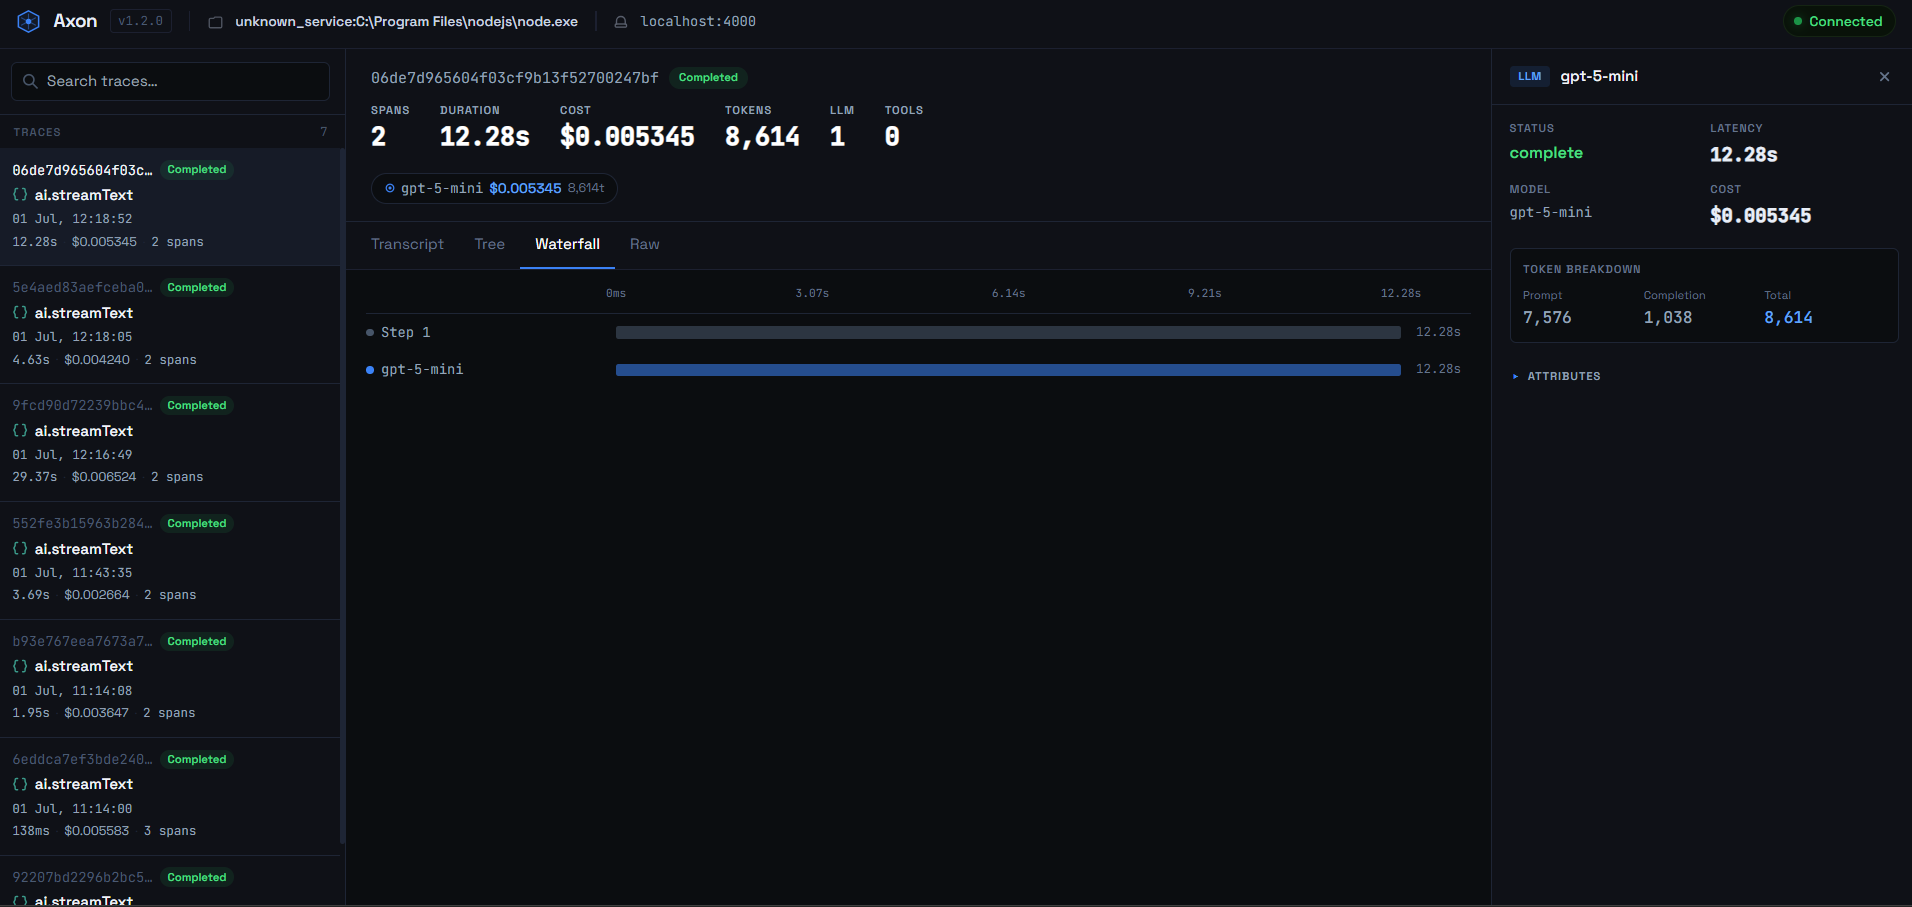
Tree — parent-child span hierarchy with type icons, model names, and token counts 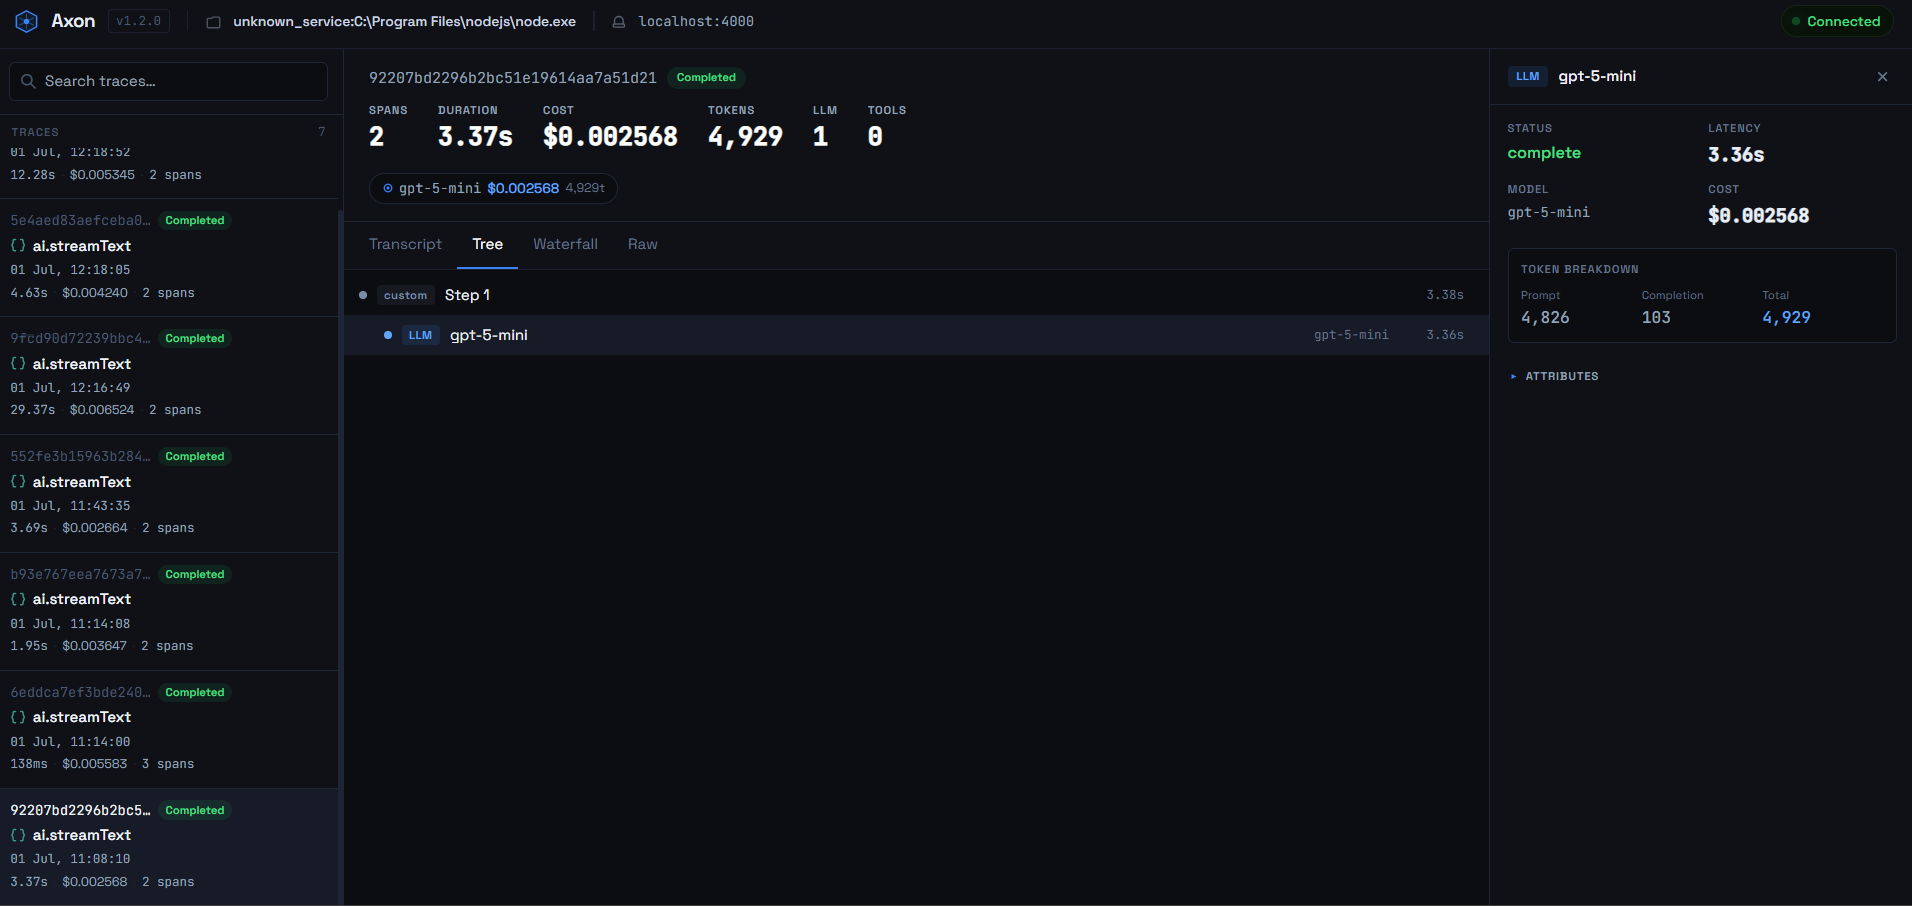
Raw — full JSON of every span with a copy button 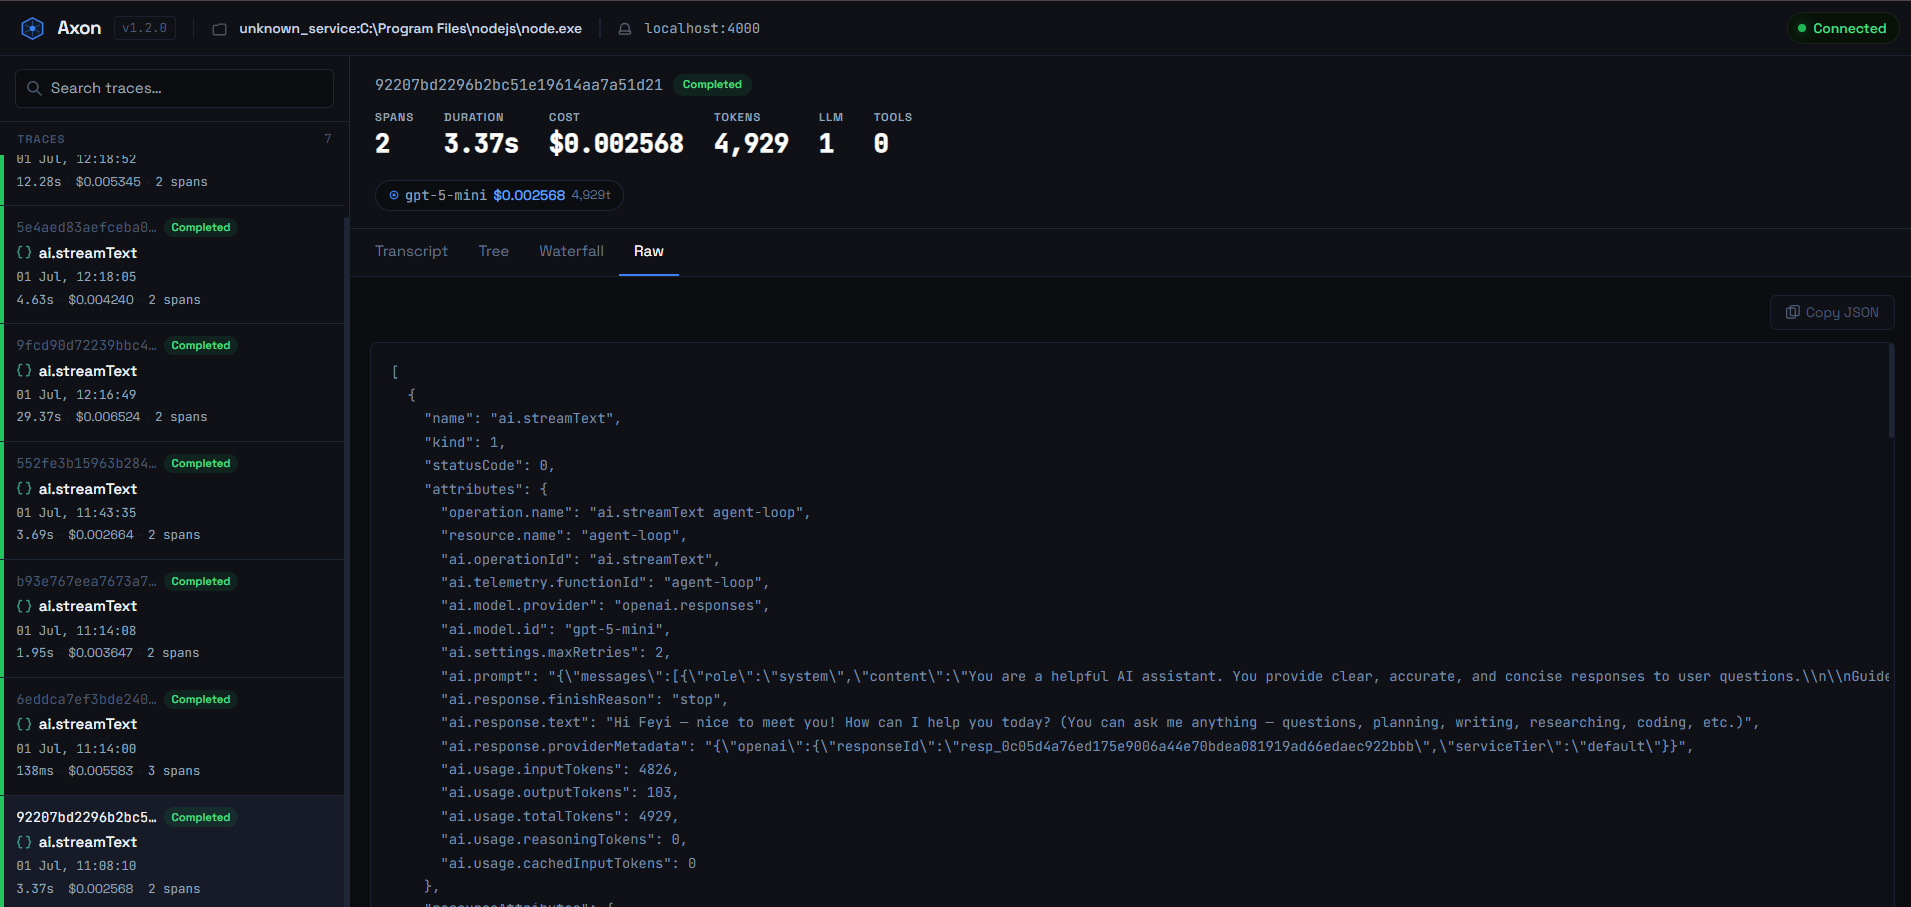
How it works
Axon runs entirely on your machine. When you start it, a single server comes up that handles two responsibilities: it accepts incoming OTLP trace data from your application, and it serves the dashboard that visualises those traces. The server writes all trace data to a local SQLite database scoped to your project directory. The dashboard connects to the server over Server-Sent Events so new spans appear in real time as your agent runs.
The tool is distributed as three packages that work together. @axon-ai/cli is the command-line interface you interact with. @axon-ai/backend is the Express server and database layer. @axon-ai/dashboard is the React web interface. When you install the CLI, it bundles the other two so you only need one install.
Getting started
Prerequisites
- Node.js 18 or higher
- A LangChain or OpenTelemetry-instrumented application running in development
npm install -g @axon-ai/cliInitialise your project
Run this inside your project directory. It creates a .axon-ai/ folder that holds your configuration and local trace database.
axon-ai init --project my-appStart Axon
axon-ai startThis launches the backend server and opens the dashboard in your browser. By default the server runs on port 4000. The OTLP ingest endpoint is available at http://localhost:4000/v1/traces.
Point your application at Axon
For Node.js applications using @axon-ai/langchain-tracer:
npm install @axon-ai/langchain-tracerimport { createAutoTracer } from '@axon-ai/langchain-tracer';
createAutoTracer({ endpoint: 'http://localhost:4000' });For Python applications using OpenLLMetry:
pip install traceloop-sdkfrom traceloop.sdk import Traceloop
Traceloop.init(
app_name="my-agent",
api_endpoint="http://localhost:4000",
)Run your application and switch to the dashboard. Traces appear automatically as your agent executes.
CLI reference
| Command | Description | |---|---| | axon-ai init | Initialise Axon in the current directory | | axon-ai start | Start the backend and dashboard | | axon-ai status | Check whether services are running | | axon-ai stop | Stop all running services | | axon-ai version | Show version information |
Options for axon-ai init
--project <name>sets the project name used to group traces. Defaults todefault.--auto-startlaunches the dashboard immediately after initialisation.
axon-ai start
--port <number>sets the port for both the server and dashboard. Defaults to4000.--no-openprevents the browser from opening automatically.--project <name>tags incoming traces with a project name.
Configuration
axon-ai init creates a .axon-ai/config.json file in your project root. You can edit it directly.
{
  "project": "my-app",
  "backend": {
    "port": 4000,
    "host": "localhost"
  }
}
Trace data is stored in .axon-ai/traces.db. This file is local to your machine and is not committed to source control. Add .axon-ai/traces.db to your .gitignore if you want to keep it out of your repository.
Docker
If you prefer not to install Node.js, you can run the full stack with Docker Desktop.
make start      # start backend and dashboard
make stop       # stop all services
make logs       # stream logs from all containers
make restart    # restart services
make clean      # remove containers and volumes
The dashboard is available at http://localhost:8080 and the OTLP endpoint at http://localhost:3000/v1/traces.
To reset the trace database:
make stop
docker volume rm axon_axon-data
make start
Troubleshooting
Port already in use
Another process is using the default port. Pass a different port with axon-ai start --port 5000.
Dashboard does not open
Run axon-ai status to confirm the server started successfully. If it did, open http://localhost:4000 manually in your browser.
Traces are not appearing
Confirm your application's OTLP exporter is pointing at the correct endpoint (http://localhost:<port>/v1/traces). Check the terminal where axon-ai start is running for any ingestion errors.
Database issues
If the database becomes corrupted, stop Axon, delete .axon-ai/traces.db, and restart. All historical traces will be lost but the service will recover cleanly.
Contributing
Contributions are welcome from developers of all experience levels.
To get started, fork the repository. The project is a Node.js monorepo with three workspaces: packages/cli, backend, and dashboard. Install dependencies from the root with npm install. You can run the full stack in development mode with npm run dev, which starts the backend and dashboard in parallel with hot reload.
When making changes, run npm test to execute the test suite before submitting a pull request. Please keep pull requests focused on a single concern and include a clear description of what the change does and why.
License
This project is licensed under the MIT License.


