
Minimalistic graph card for Home Assistant Lovelace UI
Lovelace Mini Graph Card
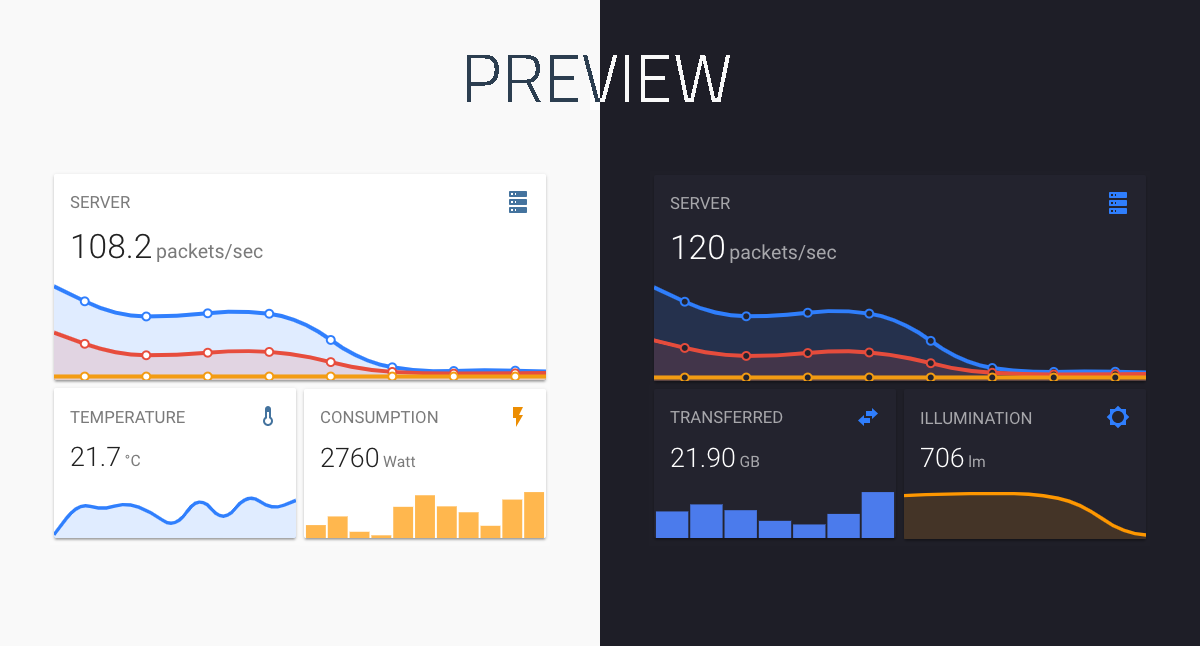
A minimalistic and customizable graph card for Home Assistant Lovelace UI.The card works with entities from within the sensor & binary_sensor domain and displays the sensors current state as well as a line graph representation of the history.
Install
HACS (recommended)
This card is available in HACS (Home Assistant Community Store).
HACS is a third party community store and is not included in Home Assistant out of the box.

Manual install
- Download and copy
mini-graph-card-bundle.jsfrom the latest release into yourconfig/wwwdirectory.
- Add the resource reference as decribed below.
CLI install
- Move into your
config/wwwdirectory.
- Grab
mini-graph-card-bundle.js:
$ wget https://github.com/kalkih/mini-graph-card/releases/download/v0.13.0/mini-graph-card-bundle.js- Add the resource reference as decribed below.
Add resource reference
If you configure Lovelace via YAML, add a reference to mini-graph-card-bundle.js inside your configuration.yaml:
resources:
    - url: /local/mini-graph-card-bundle.js?v=0.13.0
      type: module
Else, if you prefer the graphical editor, use the menu to add the resource:
- Make sure, advanced mode is enabled in your user profile (click on your user name to get there)
- Navigate to Configuration -> Lovelace Dashboards -> Resources Tab. Hit orange (+) icon
- Enter URL
/local/mini-graph-card-bundle.jsand select type "JavaScript Module".
/hacsfiles/mini-graph-card/mini-graph-card-bundle.js and select "JavaScript Module" for HACS install)
- Restart Home Assistant.
Updating
If you have a version older than v0.0.8 installed, please delete the current files and follow the installation instructions again.- Find your
mini-graph-card-bundle.jsfile inconfig/wwwor wherever you ended up storing it.
- Replace the local file with the latest one attached in the latest release.
- Add the new version number to the end of the cards reference url in your
ui-lovelace.yamllike below:
resources:
    - url: /local/mini-graph-card-bundle.js?v=0.13.0
      type: module
You may need to empty the browsers cache if you have problems loading the updated card.
Using the card
We recommend looking at the Example usage section to understand the basics to configure this card. (also) pay attention to the required options mentioned below.
Options
Card options
| Name | Type | Default | Since | Description | |------|:----:|:-------:|:-----:|-------------| | type (required) | string | | v0.0.1 |custom:mini-graph-card.
| entities (required) | list | | v0.2.0 | One or more sensor entities in a list, see entities object for additional entity options.
| icon | string | | v0.0.1 | Set a custom icon from any of the available mdi icons.
| icon_image | string | | v0.12.0 | Override icon with an image url
| name | string | | v0.0.1 | Set a custom name which is displayed beside the icon.
| unit | string | | v0.0.1 | Set a custom unit of measurement ('' value for an empty unit).
| tap_action | action object | | v0.7.0 | Action on click/tap.
| group | boolean | false | v0.2.0 | Disable paddings and box-shadow, useful when nesting the card.
| hourstoshow | integer | 24 | v0.0.2 | Specify how many hours of history the graph should present.
| pointsperhour | number | 0.5 | v0.2.0 | Specify amount of data points the graph should display for each hour, (basically the detail/accuracy/smoothing of the graph).
| aggregate_func | string | avg | v0.8.0 | Specify aggregate function used to calculate point/bar in the graph.
| group_by | string | interval | v0.8.0 | Specify type of grouping of data, dynamic interval, date or hour.
| update_interval | number | | v0.4.0 | Specify a custom update interval of the history data (in seconds), instead of on every state change.
| cache | boolean | true | v0.9.0 | Enable/disable local caching of history data.
| show | list | | v0.2.0 | List of UI elements to display/hide, for available items see available show options.
| animate | boolean | false | v0.2.0 | Add a reveal animation to the graph.
| height | number | 150 | v0.0.1 | Set a custom height of the line graph.
| bar_spacing | number | 4 | v0.9.0 | Set the spacing between bars in bar graph.
| line_width | number | 5 | v0.0.1 | Set the thickness of the line.
| line_color | string/list | var(--accent-color) | v0.0.1 | Set a custom color for the graph line, provide a list of colors for multiple graph entries.
| color_thresholds | list | | v0.2.3 | Set thresholds for dynamic graph colors, see Line color object.
| colorthresholdstransition | string | smooth | v0.4.3 | Color threshold transition, smooth or hard.
| decimals | integer | | v0.0.9 | Specify the exact number of decimals to show for states.
| hour24 | boolean | false | v0.2.1 | Set to true to display times in 24-hour format.
| font_size | number | 100 | v0.0.3 | Adjust the font size of the state, as percentage of the original size.
| fontsizeheader | number | 14 | v0.3.1 | Adjust the font size of the header, size in pixels.
| align_header | string | default | v0.2.0 | Set the alignment of the header, left, right, center or default.
| align_icon | string | right | v0.2.0 | Set the alignment of the icon, left, right or state.
| align_state | string | left | v0.2.0 | Set the alignment of the current state, left, right or center.
| lower_bound | number or string | | v0.2.3 | Set a fixed lower bound for the graph Y-axis. String value starting with ~ (e.g. ~50) specifies soft bound.
| upper_bound | number or string | | v0.2.3 | Set a fixed upper bound for the graph Y-axis. String value starting with ~ (e.g. ~50) specifies soft bound.
| minboundrange | number | | v0.x.x | Applied after everything, makes sure there's a minimum range that the Y-axis will have. Useful for not making small changes look large because of scale.
| lowerboundsecondary | number or string | | v0.5.0 | Set a fixed lower bound for the graph secondary Y-axis. String value starting with ~ (e.g. ~50) specifies soft bound.
| upperboundsecondary | number or string | | v0.5.0 | Set a fixed upper bound for the graph secondary Y-axis. String value starting with ~ (e.g. ~50) specifies soft bound.
| minboundrange_secondary | number | | v0.x.x | Applied after everything, makes sure there's a minimum range that the secondary Y-axis will have. Useful for not making small changes look large because of scale.
| smoothing | boolean | true | v0.8.0 | Whether to make graph line smooth.
| state_map | state map object | | v0.8.0 | List of entity states to convert (order matters as position becomes a value on the graph).
| value_factor | number | 0 | v0.9.4 | Scale value by order of magnitude (e.g. convert Watts to kilo Watts), use negative value to scale down.
| logarithmic | boolean | false | v0.10.0 | Use a Logarithmic scale for the graph
Entities object
Entities may be listed directly (as persensor.temperature in the example below), or defined using
properties of the Entity object detailed in the following table (as per sensor.pressure in the example below).
| Name | Type | Default | Description | |------|:----:|:-------:|-------------| | entity (required) | string | | Entity id of the sensor. | attribute | string | | Retrieves an attribute or sub-attribute (attr1.attr2...) instead of the state | name | string | | Set a custom display name, defaults to entity's friendly_name. | color | string | | Set a custom color, overrides all other color options including thresholds. | unit | string | | Set a custom unit of measurement, overrides unit set in base config ('' value for an empty unit). | aggregate_func | string | | Override for aggregate function used to calculate point on the graph, avg, median, min, max, first, last, sum. | show_state | boolean | | Display the current state. | showlegendstate | boolean | false | Display the current state as part of the legend. | show_indicator | boolean | | Display a color indicator next to the state. | show_graph | boolean | | Set to false to completely hide the entity in the graph. | show_line | boolean | | Set to false to hide the line. | show_fill | boolean | | Set to false to hide the fill. | show_points | boolean | | Set to false to hide the points. | show_legend | boolean | | Set to false to turn hide from the legend. | stateadaptivecolor | boolean | | Make the color of the state adapt to the entity color. | y_axis | string | | If 'secondary', displays using the secondary y-axis on the right. | fixed_value | boolean | | Set to true to graph the entity's current state as a fixed value instead of graphing its state history. | smoothing | boolean | | Override for a flag indicating whether to make graph line smooth.
entities:
  - sensor.temperature
  - entity: sensor.pressure
    name: Pressure
    show_state: true
  - sensor.humidity
Available show options
All properties are optional.| Name | Default | Options | Description | |------|:-------:|:-------:|-------------| | name | true | true / false | Display name. | icon | true | true / false | Display icon. | state | true | true / false / last | Display current state. last will show the last graph point's value. | graph | line | line / bar / false | Display option for the graph. If set to bar a maximum of 96 bars will be displayed. | fill | true | true / false / fade | Display the line graph fill. | points | hover | true / false / hover | Display graph data points. | legend | true | true / false | Display the graph legend (only shown when graph contains multiple entities). | average | false | true / false | Display average information. | extrema | false | true / false | Display max/min information. | labels | hover | true / false / hover | Display Y-axis labels. | labels_secondary | hover | true / false / hover | Display secondary Y-axis labels. | nameadaptivecolor | false | true / false | Make the name color adapt with the primary entity color. | iconadaptivecolor | false | true / false | Make the icon color adapt with the primary entity color. | loading_indicator | true | true / false | Show loading indicator while attempting to retrieve a history.
Line color object
See dynamic line color for example usage.| Name | Type | Default | Description | |------|:----:|:-------:|-------------| | value (required except in interpolation (see below)) | number | | The threshold for the color stop. | color (required) | string | | Color in 6 digit hex format (e.g. #008080).
Line color interpolation of stop values
As long as the first and last threshold stops havevalue properties, intermediate stops can exclude value; they will be interpolated linearly. For example, given stops like:
color_thresholds:
  - value: 0
    color: "#ff0000"
  - color: "#ffff00"
  - color: "#00ff00"
  - value: 4
    color: "#0000ff"
The values will be interpolated as:
color_thresholds:
  - value: 0
    color: "#ff0000"
  - value: 1.333333
    color: "#ffff00"
  - value: 2.666667
    color: "#00ff00"
  - value: 4
color: "#0000ff"- between
0(including this value) and1.33333, the color is#ff0000, - between
1.33333(including this value) and2.666667, the color is#ffff00, - between
2.666667(including this value) and4, the color is#00ff00, - equal to or more than
4, the color is#0000ff.
- value: 0
    color: "#ff0000"
  - "#ffff00"
  - "#00ff00"
  - value: 4
    color: "#0000ff"
Action object options
| Name | Type | Default | Options | Description | |------|:----:|:-------:|:-----------:|-------------| | action | string |more-info | more-info / navigate / call-service / url / none | Action to perform.
| entity | string | | Any entity id | Override default entity of more-info, when action is defined as more-info.
| service | string | | Any service | Service to call (e.g. media_player.toggle) when action is defined as call-service.
| servicedata | object | | Any service data | Service data to include with the service call (e.g. entityid: media_player.office).
| navigation_path | string | | Any path | Path to navigate to (e.g. /lovelace/0/) when action is defined as navigate.
| url | string | | Any URL | URL to open when action is defined as url.
State map object
| Name | Type | Default | Description | |------|:----:|:-------:|-------------| | value (required) | string | | Value to convert. | label | string | same as value | String to show as label (if the value is not precise).Aggregate functions
Recorded values are grouped in time buckets which are determined bygroupby, pointsper_hour configuration.
These buckets are converted later to single point/bar on the graph. Aggregate function defines the methods of that conversion.
| Name | Since | Description | |------|:-------:|-------------| | avg | v0.8.0 | Average | median | v0.11.0 | Median | min | v0.8.0 | Minimum - lowest value | max | v0.8.0 | Maximum - largest value | first | v0.9.0 | | last | v0.9.0 | | sum | v0.9.2 | | delta | v0.9.4 | Calculates difference between max and min value | diff | v0.11.0 | Calculates difference between first and last value
Theme variables
The following theme variables can be set in your HA theme to customize the appearance of the card.| Name | Default | Description | |------|:-------:|-------------| | mcg-title-letter-spacing | | Letter spacing of the card title (name option). | mcg-title-font-weight | 500 | Font weight of the card title.
Example usage
Single entity card
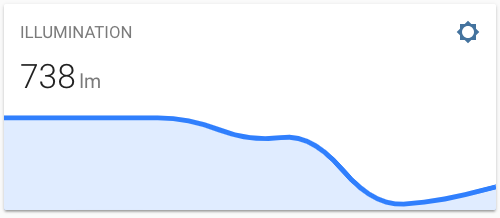
type: custom:mini-graph-card
entities:
 - sensor.illumination
Alternative style
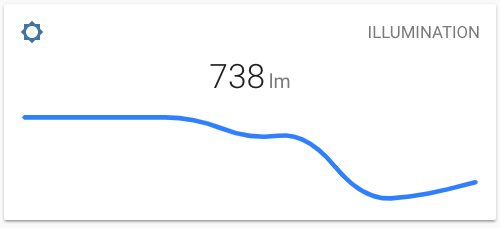
type: custom:mini-graph-card
entities:
 - sensor.illumination
align_icon: left
align_state: center
show:
  fill: false
Multiple entities card
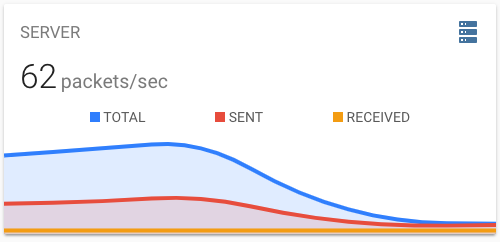
type: custom:mini-graph-card
name: SERVER
icon: mdi:server
entities:
  - entity: sensor.server_total
    name: TOTAL
  - sensor.server_sent
  - sensor.server_received
Bar chart card
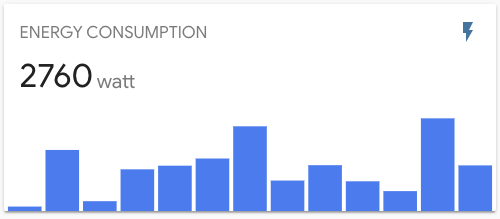
type: custom:mini-graph-card
entities:
  - entity: sensor.energy_consumption
name: ENERGY CONSUMPTION
show:
  graph: bar
Show data from the past week
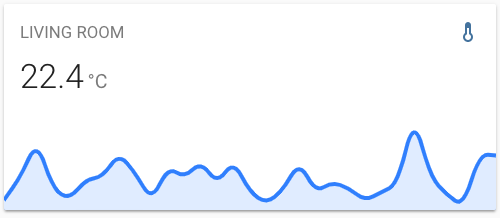
Use the hourstoshow option to specify how many hours of history the graph should represent. Use the pointsperhour option to specify the accuracy/detail of the graph.
type: custom:mini-graph-card
entities:
  - sensor.livingroomtemp
name: LIVING ROOM
hourstoshow: 168
pointsperhour: 0.25
Graph only card
Use theshow option to show/hide UI elements.
type: custom:mini-graph-card
entities:
  - sensor.humidity
show:
  icon: false
  name: false
  state: false
Horizontally stacked cards
You can stack cards horizontally by using one or morehorizontal-stack(s).
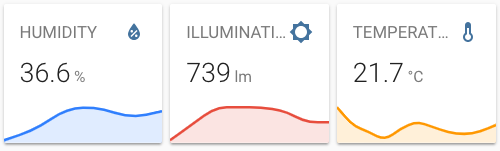
type: horizontal-stack
cards:
  - type: custom:mini-graph-card
    entities:
      - sensor.humidity
    line_color: blue
    line_width: 8
    font_size: 75
  - type: custom:mini-graph-card
    entities:
      - sensor.illumination
    line_color: '#e74c3c'
    line_width: 8
    font_size: 75
  - type: custom:mini-graph-card
    entities:
      - sensor.temperature
    line_color: var(--accent-color)
    line_width: 8
    font_size: 75
Dynamic line color
Have the graph change line color dynamically.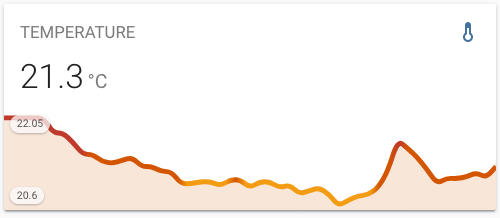
type: custom:mini-graph-card
entities:
  - sensor.sensor_temperature
show:
  labels: true
color_thresholds:
  - value: 20
    color: "#f39c12"
  - value: 21
    color: "#d35400"
  - value: 21.5
    color: "#c0392b"
Alternate y-axis
Have one or more series plot on a separate y-axis, which appears on the right side of the graph. This example also shows turning off the line, points and legend.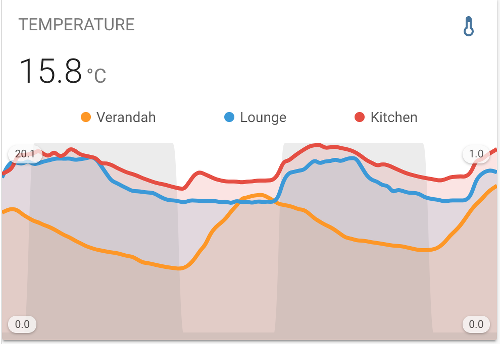
type: custom:mini-graph-card
entities:
  - entity: sensor.verandah
    name: Verandah
  - entity: sensor.lounge
    name: Lounge
  - entity: sensor.kitchen
    name: Kitchen
  - color: gray
    entity: input_number.nighttime
    name: Night
    show_line: false
    show_points: false
    show_legend: false
    y_axis: secondary
show:
  labels: true
  labels_secondary: true
Grouping by date
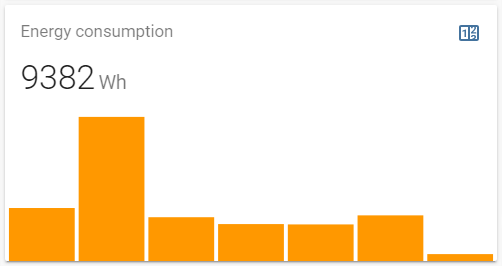
You can group values by date, this way you can visualize for example daily energy consumption.
type: custom:mini-graph-card
entities:
  - entity: sensor.energy_daily
name: Energy consumption
hourstoshow: 168
aggregate_func: max
group_by: date
show:
  graph: bar
Data aggregation functions
You can decide how values are aggregated for points on graph. Example how to display min, max, avg temperature per day from last week.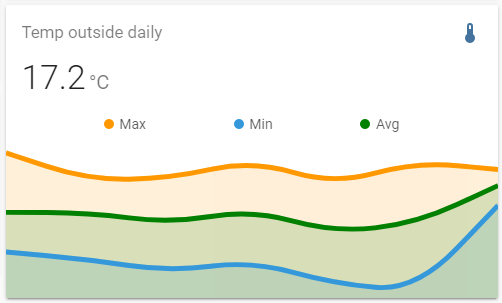
type: custom:mini-graph-card
entities:
  - entity: sensor.outside_temp
    aggregate_func: max
    name: Max
    color: "#e74c3c"
  - entity: sensor.outside_temp
    aggregate_func: min
    name: Min
  - entity: sensor.outside_temp
    aggregate_func: avg
    name: Avg
    color: green
name: Temp outside daily (last week)
hourstoshow: 168
group_by: date
Non-numeric sensor states
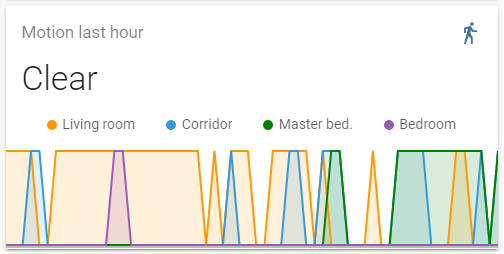
You can render non-numeric states by providing state_map config. For example this way you can show data coming from binary sensors.
type: custom:mini-graph-card
entities:
  - entity: binarysensor.livingroom_motion
    name: Living room
  - entity: binarysensor.corridormotion
    name: Corridor
  - entity: binarysensor.masterbed_motion
    name: Master bed.
    color: green
  - entity: binarysensor.bedroommotion
    name: Bedroom
name: Motion last hour
hourstoshow: 1
pointsperhour: 60
update_interval: 30
aggregate_func: max
line_width: 2
smoothing: false
state_map:
  - value: "off"
    label: Clear
  - value: "on"
    label: Detected
Showing additional info on the card
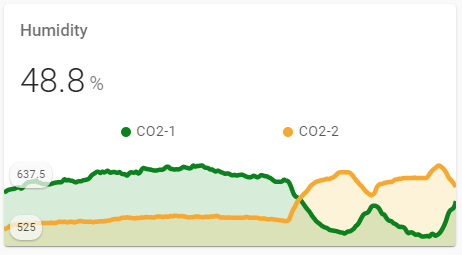
It is possible to show a state without displaying a graph for a sensor. Imagine there are two CO-2 sensors & one humidity sensor; graphs are displayed for the CO-2 only, and the humidity is shown as a state only.
type: custom:mini-graph-card entities: - entity: sensor.xiaomicg1_humidity show_state: true show_graph: false - entity: sensor.xiaomicg1_co2 color: green show_state: false name: CO2-1 - entity: sensor.xiaomicg2_co2 color: orange show_state: false name: CO2-2 name: Humidity hourstoshow: 4 pointsperhour: 60 show: name: true legend: true icon: false labels: trueaggregate_func option.
Accessing attributes in complex structures
When using the attribute option in the entities object, you can access data in structured attributes, such as dictionaries and lists.
Accessing dictionary attributes
Suppose you have data stored inside a dictionary attribute nameddict_attribute
dict_attribute:
  value_1: 53
  value_2: 64
value_3: 72dictattribute.subattribute:
type: custom:mini-graph-card
entities:
  - entity: sensor.testingobjectdata
    attribute: dictattribute.value1
    name: value_1 from dictionary attribute
Accessing list attributes
Suppose you have data stored inside a list attribute named list_attribute:
list_attribute: - value_1: 67 value_2: 65 value_3: 93 - value_1: 134 value_2: 130 value_3: 186 - value_1: 201 value_2: 195 value_3: 279listattribute.index.subattribute: type: custom:mini-graph-card entities: - entity: sensor.testingobjectdata_list attribute: listattribute.0.value1 name: value_1 from first element of list attributeDevelopment
- Clone this repository into your
config/wwwfolder using git:
$ git clone https://github.com/kalkih/mini-graph-card.git- Add a reference to the card in your
ui-lovelace.yaml:
resources:
  - url: /local/mini-graph-card/dist/mini-graph-card-bundle.js
    type: module
Instructions
Requires nodejs & npm.
- Move into the
mini-graph-cardrepo, checkout the dev branch & install dependencies:
$ cd mini-graph-card && git checkout dev && npm install- Make changes to the source code.
- Build the source by running:
$ npm run build- Refresh the browser to see changes.
- (Optional) Watch the source and automatically rebuild on save:
$ npm run watchThe new mini-graph-card-bundle.js will be build and ready inside /dist.
Note that the dev branch is the most up-to-date and matches our beta releases.
Please refer to the Contribution Guidelines if you're interested in contributing to the project. (And thanks for considering!)
Getting errors?
Make sure you havejavascript_version: latest in your configuration.yaml under frontend:.
Make sure you have the latest versions of mini-graph-card.js & mini-graph-lib.js.
If you have issues after updating the card, try clearing your browser cache.
If you have issues displaying the card in older browsers, try changing type: module to type: js at the card reference in ui-lovelace.yaml.


