
🚀 Rust-backed pandas-shaped DataFrame for live OHLCV data: 254 indicators, incremental O(lookback) refresh, NumPy/Torch output.




English | 简体中文
High-performance, Rust-backed columnar kernel for stock / candlestick (OHLCV) time-series data.
volas is a Rust-backed, pandas-shaped DataFrame for live OHLCV pipelines: 254 trading-indicators, incremental O(lookback) refresh, and NumPy/Torch-ready output.
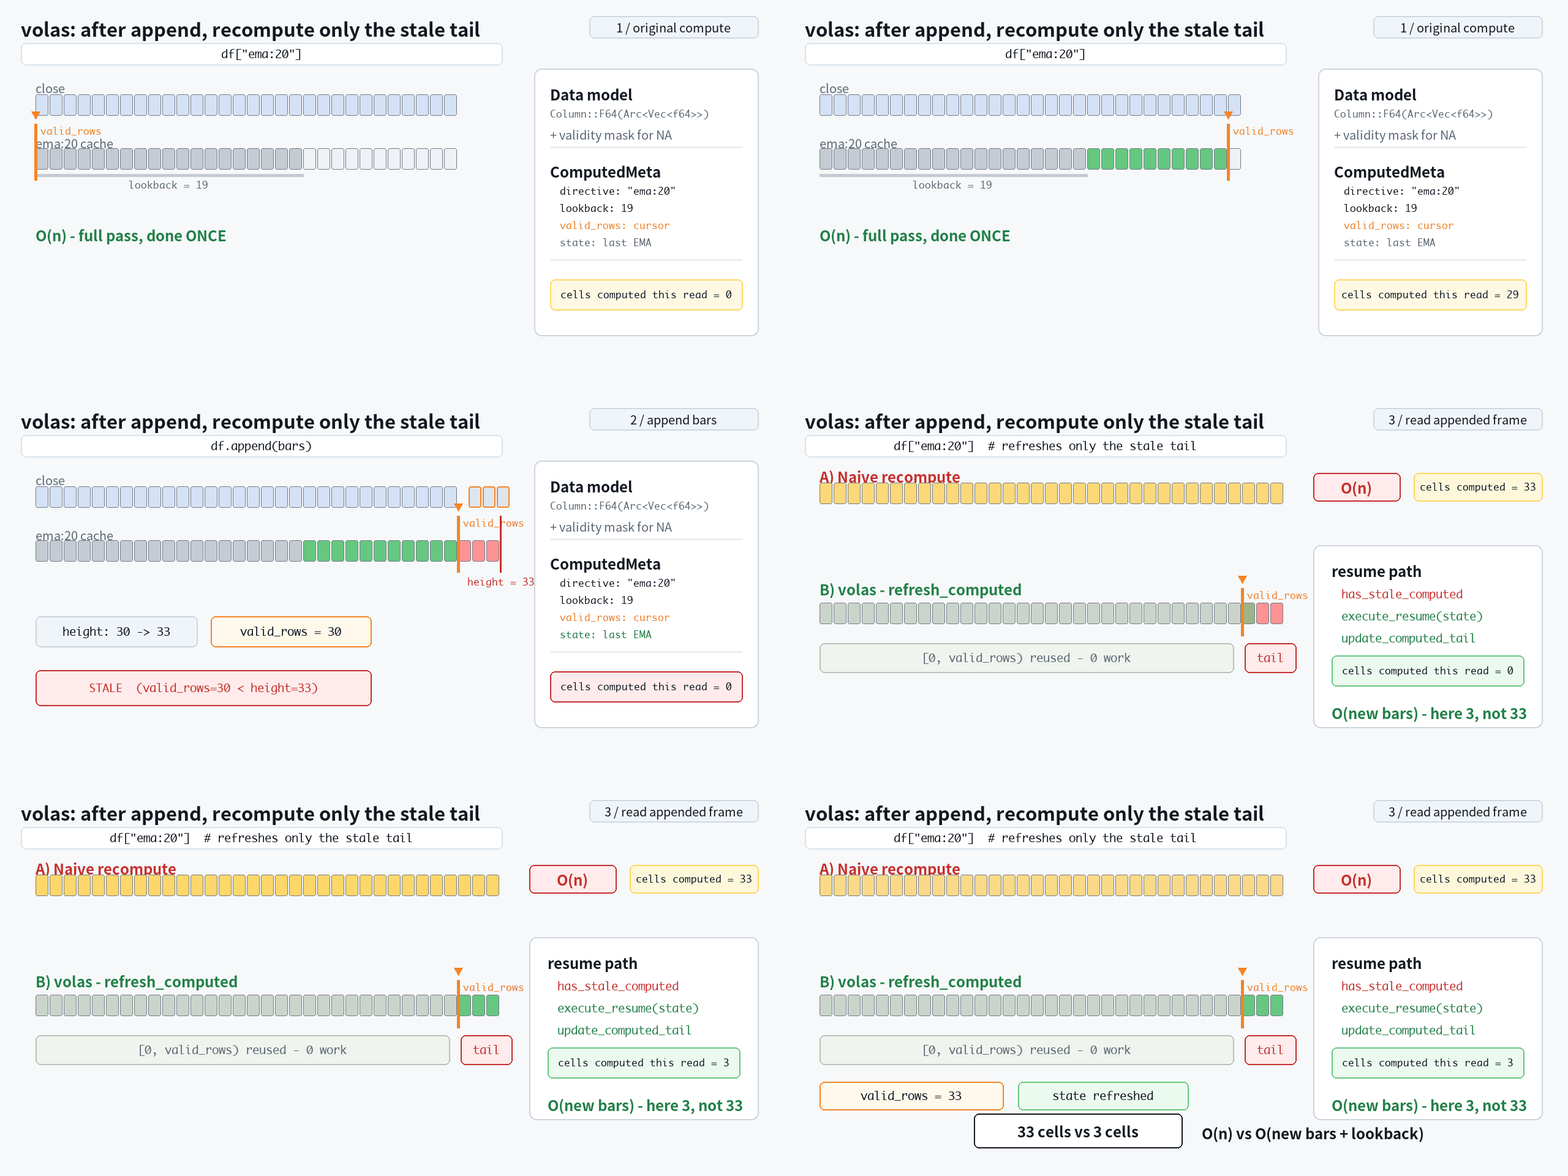
It is not a general-purpose pandas replacement. It is a narrow, fast DataFrame for candlestick / OHLCV workflows: append a new bar, keep indicator columns cached, and refresh only the stale tail.
volas is also a Rust crate.
from volas import read_csv
df = readcsv("aapl1m.csv")
Cache indicator directives as DataFrame columns.
df["rsi:14"]
df[["macd", "macd.signal", "atr:14"]]
In a live loop:
df.append(new_bar)     # one-row OHLCV frame
df["rsi:14"]           # refreshes only the affected tail, O(lookback)
features = df.to_numpy()- 254 built-in indicators and TA-Lib-compatible directives
- Incremental refresh after
append: O(lookback), not O(n) - Rust kernels, no pandas runtime dependency
- pandas-shaped indexing:
.loc/.iloc/.at/readcsv/tonumpy - NumPy / Torch-ready output
pip install volasOn our reproducible benchmark suite, volas is faster than pandas, polars, stock-pandas and TA-Lib on most live-update indicator workloads.
Why volas
- pandas-shaped API. The same
.loc/.iloc/.at,read_csv,
to_numpy and resampling — for OHLCV workflows, change the import and keep
your code. It is not a general-purpose pandas replacement. (See
what's not covered)
- Fast on live OHLCV indicator workloads, with reproducible benchmarks —
make benchmark.
- On incremental update (each new bar), volas is the fastest of every
library across all indicators — ~5× faster than TA-Lib, and up to
~360× faster than pandas.
- Built for the live tick. A new bar touches only the affected tail
O(lookback), not O(n)); indicators refresh in microseconds, never a full
recompute.
- Rust inside, NumPy / Torch out. Compiled kernels — hot paths tuned down to the
to_numpy() feeds NumPy and
torch.Tensor pipelines.
Why I built volas
I've spent years building quantitative trading-signal systems, and for most of that time pandas was just the tax I paid to get any work done. Loading a single CSV of a few hundred thousand candlesticks, computing a handful of indicators, cleaning them up, normalizing — that one data-processing pass routinely took 10 to 20 minutes before any real research could even begin.
Backtesting made it worse. To honestly simulate live trading you feed history in one bar at a time — usually fine-grained bars, say 1-minute candles — appending each new bar to the DataFrame and recomputing every indicator across the whole frame again, bar after bar, to mimic the OHLCV stream a live system actually sees. So much of that was pure waste — the same columns rebuilt from scratch on every step — and across a few years of 1-minute data that redundant work alone could drag a single backtest out by hours. Every idea I wanted to try, every parameter I wanted to sweep, paid that tax again. **The tooling, not the thinking, was setting the pace of my research.**
So I stopped patching around it and rebuilt the whole data layer from the ground up, pandas thrown out entirely. The bet paid off: the data-processing pass that used to take 10–20 minutes now finishes in seconds, and the per-bar recomputation that used to drag those runs out collapsed to near nothing. A backtest still has real work to do — strategy logic, fills, accounting — but the data layer stopped being the thing I sit and wait on. volas is that layer: hundreds of times faster where it counts, and finally fast enough to get out of the way.
When to reach for volas
volas is not a general-purpose pandas replacement — for plain dataframe analysis, keep pandas or polars. It is a narrow, fast DataFrame for the case where a new OHLCV bar arrives and indicators must refresh now:
| | pandas | polars | TA-Lib | volas | | --- | :---: | :---: | :---: | :---: | | pandas-shaped indexing (.loc / .iloc / .at) | ✅ | ❌ | ❌ | ✅ | | OHLCV-native indicator directives (df['rsi:14']) | ❌ | ❌ | ✅ | ✅ | | Indicator cache owned by the frame | ❌ | ❌ | ❌ | ✅ | | Incremental O(lookback) refresh on a new bar | ❌ | ❌ | ❌ | ✅ | | Rust-backed kernels, no pandas at runtime | ❌ | ✅ | C | ✅ | | NumPy / Torch export | ✅ | ✅ | arrays | ✅ |
Table of Content
- Installation
- Quick start
- Usage
- Bounded rolling window
- Cumulation and DatetimeIndex
- TimeFrame
- Syntax of directive
- Indexing & selection
- Writing & assignment
- Timezones
- Missing values (
volas.NA) - pandas interop
- Arrow & DLPack interop (zero-copy)
- Error handling
- Built-in Indicators
- License
- For Developers
Installation
pip install volasRequires Python >= 3.11. Wheels are published for Linux (x86_64 / aarch64), macOS (x8664 / arm64) and Windows (x8664). For a local build from source, see For Developers.
Verify the install in 30 seconds, then see the examples/ — each is self-contained and prints an OK: line:


pip install volas
python examples/00installcheck.py
python examples/03liveohlcv_append.py   # append a bar, refresh only the stale tail
More docs: TA-Lib migration, pandas migration, directive cheat sheet, and when not to use volas.
Quick start
from volas import DataFrame
df = DataFrame({     'open':   [2.0, 3.0, 4.0, 5.0, 6.0, 7.0],     'high':   [12.0, 13.0, 14.0, 15.0, 16.0, 17.0],     'low':    [1.0, 2.0, 3.0, 4.0, 5.0, 6.0],     'close':  [3.0, 4.0, 5.0, 6.0, 7.0, 8.0],     'volume': [100, 200, 300, 400, 500, 600], })
A plain column -> Series
df['close']
0    3.0
1    4.0
2    5.0
3    6.0
4    7.0
5    8.0
Name: close, dtype: float64
An indicator directive -> Series (2-period SMA of close)
df['ma:2']
0   <NA>
1    3.5
2    4.5
3    5.5
4    6.5
5    7.5
Name: ma:2, dtype: float64
A boolean directive -> bool Series, usable as a row mask
bullish = df['close > open']
df[bullish]                      # DataFrame of the rows where close > open
Several directives at once -> DataFrame
df[['ma:2', 'ma:3', 'close > open']]
Export to NumPy (and, zero-copy, to Arrow / DLPack — see the interop section)
df['close'].to_numpy()           # 1-D ndarray
df.to_numpy()                    # 2-D ndarray (rows x columns)
Usage
from volas import (
    DataFrame, Series, readcsv, todatetime, TimeFrame, Timestamp,
)
The sub-sections below follow volas's public surface in order: the DataFrame class, then its instance methods, its static methods, the other classes, and the top-level package functions — closing with the rest of the pandas-compatible API that behaves exactly as it does in pandas. (A top-level name imported from volas, such as read_csv, is written without a volas. prefix.)
DataFrame(data, columns=None, time_frame=None, cumulators=None)
DataFrame has a pandas-compatible API, so if you are familiar with pandas.DataFrame, you are already ready to use volas. Unlike pandas, volas is backed by a Rust kernel and has no pandas runtime dependency.
df = read_csv('stock.csv')We can use [], which is called pandas indexing (a.k.a. getitem in python) to select out lower-dimensional slices. In addition to indexing with colname (the column name of the DataFrame), we could also do indexing by directives.
df[directive]                  # Gets a Series
df[[directive0, directive1]]   # Gets a DataFrame
We have an example to show the most basic indexing using [directive]
df = DataFrame({
    'open' : ...,
    'high' : ...,
    'low'  : ...,
    'close': [5, 6, 7, 8, 9]
})
df['ma:2']
0   <NA>
1    5.5
2    6.5
3    7.5
4    8.5
Name: ma:2, dtype: float64
Which gets the 2-period simple moving average on column "close".
Parameters
- data
dict[str, list | np.ndarray] | DataFramethe column data, one of:
float, int, bool, datetime64, or string);
- another volas DataFrame, which is then copied (like pandas.DataFrame(df)).
The constructor does not accept a pandas.DataFrame or an Arrow object — bridge those with the dedicated DataFrame.frompandas / DataFrame.fromarrow instead. To attach a DatetimeIndex, parse a column with todatetime, promote it with setindex, then tag a zone with tzlocalize / tzconvert. See Timezones.
- columns
Optional[list[str]] = NoneSelect and order the columns to keep —
df[[...]]. A name not present raises KeyError; an empty list or a duplicate name is rejected, and an absent column is never silently filled. - time_frame
Optional[str | TimeFrame] = NoneIf set, makes this a
appends fold finer bars into the forming bar. Requires a DatetimeIndex. See Cumulation and DatetimeIndex. - cumulators
Optional[dict[str, str]] = NonePer-column aggregator overrides
{'amount': 'sum'}), only meaningful together with time_frame. Defaults to OHLCV semantics (open=first, high=max, low=min, close=last, volume=sum; any other column last). Each dict value is one of: - 'first' — the first value in the bucket - 'last' — the last value in the bucket - 'max' — the maximum - 'min' — the minimum - 'sum' — the sum - window
Optional[int] = NoneMake this a bounded rolling-window frame
window rows (see Bounded rolling window). Requires max_lookback. - max_lookback
Optional[int | list[str]] = NoneRequired withwindow(and
window + max_lookback) that keeps cached indicators correct across the automatic front-drop. Recursive indicators (EMA/Wilder/ATR/RSI/MACD) stay bit-exact; finite-window ones (ma/wma/trima/stddev/…) match an unbounded frame to floating-point tolerance (~1e-13). Pass an int to state the largest indicator lookback you will use, or a list of indicator directives to derive it from the largest of their lookbacks (e.g. ['atr:14', 'ma:50'] → margin 49), so you never hand-compute a compound indicator's warm-up. Each list entry must be an indicator directive ('ma:50'); a bare/typo'd name ('ma50') is rejected. Sizing the margin too small silently breaks the guarantee.
Bounded rolling window
Pass window= to cap the frame at the last window rows. This is the live-trading / NN-input shape: you keep append-ing bars forever, but memory stays bounded — the frame transparently drops old rows once it has accumulated enough, while retaining a hidden max_lookback-row margin so cached indicators stay consistent across each drop — recursive indicators (EMA/ATR/RSI/…) are bit-exact with an unbounded frame, finite-window ones (ma/wma/…) match it to floating-point tolerance (~1e-13).
# A bounded 30-bar window; the margin is sized from the indicators you declare.
wf = DataFrame(seed, timeframe='15m', window=30, maxlookback=['atr:14'])
for bar in feed:            # runs forever; memory never grows     wf.append(bar)          # fold a 1m bar into the forming 15m bar     wf.fulfill()            # refresh the cached atr:14 tail (O(lookback))     if wf.ready:            # warmed up: all 30 rows have valid history         x = wf[['close', 'atr:14']].to_numpy('float32')   # the 30×2 feature window
Every row-facing surface — len, shape, index, indexing ([] / .iloc / .loc / .iat / .at), head / tail, reductions, tonumpy, tocsv, to_pandas, repr — shows only the window rows; the margin is never visible.
ready — has the window warmed up?
ready (a property) is True once the frame holds window + max_lookback rows — so every one of the window visible rows has a full indicator history behind it and the cached indicators are valid end-to-end. During the initial warm-up it is False and the visible rows are still filling in; gate your inference / training on it.
wf = DataFrame(seed, timeframe='15m', window=30, maxlookback=['atr:14'])
wf.ready          # False — fewer than 30 + 14 rows accumulated so far
...               # append until warmed
wf.ready          # True  — every visible row now has valid indicator history
An unbounded frame (no window=) has no warm-up contract and is always True.
fill_into(out, columns=None) — zero-allocation feature export
fill_into writes the window's values straight into a NumPy array you own, in place — nothing is allocated per call. It is the export half of a live inference loop: paired with one preallocated buffer, an append → fulfill → fill_into → infer loop allocates nothing per bar (unlike to_numpy, which mints a fresh matrix every call).
Contract:
- Only already-cached columns, named by their canonical directive string. A
name = wf['atr:14'].name), because a cached directive is stored under its
canonical form (e.g. 'MA: 5' → 'ma:5'), not the string you passed, and columns=
matches on the exact stored name. (max_lookback=['atr:14'] only sizes the margin; it
does not create the column, and fill_into exports cached values, never computes them.)
outmust be afloat32orfloat642-D array whose shape is exactly
(len(df), k), where k is the number of exported columns (strides are respected, so a
non-contiguous or Fortran-order view works too). A wrong shape or dtype raises.
columnsselects which columns to export, in order (default: every column). A
columns= to exclude it.
- A missing / NA cell becomes
NaN. - An
appendleaves the cached indicators stale, so **callfulfill()before
fill_into()** — exporting with an unrefreshed directive column raises.
import numpy as np
wf = DataFrame(seed, timeframe='15m', window=30, maxlookback=['atr:14']) atr = wf['atr:14'].name               # materialize the directive once, and read its column                                       # name back: a cached directive lands under its CANONICAL                                       # form (here 'atr:14', but e.g. 'MA: 5' -> 'ma:5'), not the                                       # string you passed — and max_lookback only sized the margin COLS = ['open', 'high', 'low', 'close', atr]    # k = 5 features
One reusable buffer for the whole run — shape (window, k), the model's input tensor.
buf = np.empty((30, len(COLS)), dtype=np.float32)
for bar in feed:     wf.append(bar)     wf.fulfill()                      # refresh atr's stale tail before exporting     if not wf.ready:         continue                      # warming up: buf isn't (30, k) yet, indicators not valid     wf.fill_into(buf, columns=COLS)   # zero-alloc write of the 30×5 window into buf     prediction = model(buf)           # feed the model the same memory every bar
Shape note. The shape match is exact against len(df), which **grows during
warm-up** (1, 2, … up towindow) and only then settles atwindow. Gating on
wf.ready(as above) sidesteps this: by the time it isTrue,len(df) == window,
so a fixed(window, k)buffer always fits. To export mid-warm-up, sizeoutto the
current len(df) instead.
fill_into is not windowed-only — on a plain frame it exports the whole logical view the same way; the bounded window is just where reusing one buffer matters most.
DataFrame.from_pandas(pdf) -> DataFrame
A volas-specific static method that builds a DataFrame from a pandas.DataFrame (pdf) — the inverse of df.to_pandas(). pandas is imported lazily (only here, so volas stays pandas-free at import). A nullable column keeps its dtype + volas.NA, and a DatetimeIndex (tz-aware too) round-trips. See pandas interop.
df = DataFrame.frompandas(pandasdf) # pandas.DataFrame -> volas DataFrameDataFrame.from_arrow(data) -> DataFrame
A volas-specific static method that builds a DataFrame from any object exposing the Arrow C-Stream protocol (arrowcstream) — a pyarrow.Table / RecordBatch / RecordBatchReader, a polars DataFrame, etc. The data buffers are borrowed where the dtypes match (otherwise a column is copied), a multi-chunk source is concatenated, and the result carries a fresh RangeIndex.
- data the Arrow source — any object implementing
arrowcstream.
df = DataFrame.fromarrow(patable)        # pyarrow.Table     -> DataFrame
df = DataFrame.fromarrow(polarsdf)       # polars.DataFrame  -> DataFrame
Arrow is not accepted by the DataFrame(data=...) constructor (which takes a
dictor anotherDataFrame); build from an Arrow object throughfrom_arrow.
df.exec(directive: str) -> np.ndarray
Evaluates the given directive and returns its values as a numpy ndarray. It is a pure, stateless evaluation — the frame is never modified (no column is created, and no cache is read or written).
# Compute the directive without touching the frame
df.exec('ma:20')
The difference between df[directive] and df.exec(directive) is that
df[directive]creates a column for the result and caches it (incrementally
df.exec(directive) computes fresh every time and leaves the frame untouched — for a cached ndarray, use df[directive].to_numpy() df[directive]also accepts other indexing targets (a column name, a list, a
df.exec(directive) only accepts a valid volas directive string df[directive]returns aSeriesorDataFrameobject while
df.exec(directive) returns an np.ndarray
df.get_column(key: str) -> Series
Directly gets the column value by key, returning a Series — and **never computes**: unlike df[key], which parses an unknown key as an indicator directive and executes it, get_column only fetches an existing column and raises KeyError otherwise. Use it whenever the column name comes from external data (CSV headers, user input, configuration), so a name that happens to look like a directive (e.g. "ma:5") can never silently trigger a computation.
df = DataFrame({
    'open' : ...,
    'high' : ...,
    'low'  : ...,
    'close': [5, 6, 7, 8, 9]
})
df.get_column('close') 0    5 1    6 2    7 3    8 4    9 Name: close, dtype: int64
df.append(other: DataFrame | Row | dict) -> DataFrame
Appends rows of other to the end of the caller in place, returns the same DataFrame, and applies the DatetimeIndex to the newly-appended row(s) if possible. Use copy() first when the original frame must stay unchanged.
other is a DataFrame, a Row, or a scalar bar dict — one bar written as {column: value} with the bar's timestamp under the key equal to the index's name (a RangeIndex auto-increments). The dict form is the fast live path — it builds the bar straight into the frame with no per-bar 1-row DataFrame:
df.append({'time_key': ts, 'open': o, 'high': h, 'low': l, 'close': c, 'volume': v})It is strict: every data column must be provided (a missing one raises — unlike a DataFrame / Row, where a missing column is NA-padded), and an unknown key raises. Cached directive columns are not supplied — they are padded and refreshed automatically.
If the caller is a tf-aware DataFrame (one built with a time_frame, or the result of cumulate), append instead folds each finer bar into the forming bar rather than adding a row — see Live cumulation.
append is lazy: it does not recompute the indicator columns of the new rows. They stay stale until an indicator-column read refreshes them or df.fulfill() is called (see below).
df.cumulate(time_frame: TimeFrame | str, cumulators: dict | None = None) -> DataFrame
Cumulate (resample) the data frame to a coarser time_frame, returning a new DataFrame. Requires a DatetimeIndex.
- time_frame
TimeFrame | strthe target bar interval, e.g.TimeFrame.m5
'5m'. See TimeFrame.
- cumulators?
dict[str, str] | None = Noneper-column aggregator overrides
{'amount': 'sum'}). Defaults to OHLCV semantics (open=first, high=max,
low=min, close=last, volume=sum; any other column last). Each dict value
is one of:
- 'first' — the first value in the bucket
- 'last' — the last value in the bucket
- 'max' — the maximum
- 'min' — the minimum
- 'sum' — the sum
# from 1-minute klines to 5-minute klines
fiveminute = oneminute.cumulate('5m')
fifteenminute = oneminute.cumulate('15m')
fiveminute.append(newcandle_1m) appending a 1-minute candle to a 5-minute DataFrame folds it into the 5m bar
fifteenminute.append(newcandle_1m) so 1-minute data conveniently generates 5m and 15m test datasets
See Cumulation and DatetimeIndex for details.
df.fulfill() -> None
Batch-refresh every cached indicator column's stale tail in place (O(lookback + new rows) each, not an O(n) recompute), and return None.
Since append is lazy, the cache becomes fresh in one of two ways:
- Reading an indicator column —
df['ma:20']ordf[['ma:20', 'rsi:14']]—
- Every other read —
to_numpy(),.iloc/.loc/.at, the reductions
sum / mean / max / describe / …), to_csv, repr, … — does not
auto-refresh; while the frame is stale it raises, telling you to call
fulfill() first. This is deliberate: a half-updated frame fails loud instead
of silently returning stale values, and you control when the (bounded) refresh
cost is paid — which matters on a latency-sensitive live path.
df['ma:20']              # cache + read the 20-period SMA (fresh)
df.append(new_bar)       # lazy: the new row's ma:20 is now stale
df['ma:20']              # a column read auto-refreshes only the tail (fresh again)
df.append(new_bar)       # stale again df.fulfill()             # batch-refresh every cached column's tail df.to_numpy()            # now fresh (a bulk read would have raised while stale)
df.is_computed(name: str) -> bool
Whether the column name is a directive (computed) column — one derived from a directive (e.g. df['rsi:14']) and refreshed by fulfill — rather than a plain data column you supply per bar. Raises KeyError if name is not a column.
Use it to tell the two kinds of column apart, e.g. to export only the raw columns:
df['ma:5']                                              # materialize a directive column
df.is_computed('ma:5')                                  # True
df.is_computed('close')                                 # False
raw = [c for c in df.columns if not df.is_computed(c)] # ['open', 'high', 'low', 'close', 'volume']df.tonumpy(dtype=None, navalue=...) -> np.ndarray
The frame as a 2-D NumPy array (rows × columns). It tracks pandas except for one deliberate guard: an integer dtype over a frame that holds missing values raises instead of silently writing garbage (NumPy cannot store NA in an integer array) — give na_value to fill instead.
- dtype
str | None— an optional export cast.None(the default) gives the
'object' (or 'O') — a lossless 2-D array of typed cells (number / str /
Timestamp / volas.NA); the only dtype that keeps a str or datetime column intact.
- 'int64', 'int32', 'int16', 'int8' (and the unsigned 'uint*') — the exact
i64 channel (a large int and a datetime's epoch-ns survive without a float round
trip). Over a frame with missing values this raises unless na_value is given.
- 'float64', 'float32', 'float16' — the (lossy) float channel: a missing cell
is NaN, a datetime past 2⁵³ ns quantises.
- 'bool' — boolean.
- 'datetime64[ns]' — datetime nanoseconds; a NaT cell is preserved.
- A str column rejects every numeric / temporal dtype — use 'object'.
- na_value
Any— the value substituted for each missing cell. Default: the
NaN / NaT / volas.NA).
df = DataFrame({'a': [1, 2, 3], 'b': [1.5, 2.5, 3.5]})
df.to_numpy()                 # -> float64 2-D array df.to_numpy(dtype='int64')    # exact int64 cast (dense frame) df.to_numpy(dtype='object')   # typed cells — lossless (numbers / str / Timestamp / volas.NA)
an integer dtype over a missing value raises — unless na_value fills it
DataFrame({'a': [1, None]}).to_numpy(dtype='int64')               # ValueError
DataFrame({'a': [1, None]}).tonumpy(dtype='int64', navalue=0)   # -> [[1], [0]]  (int64)
Notes:
- The default (no
dtype) is the honest representation: an all-numeric/bool frame
float64 matrix (a missing cell → NaN), a frame containing str or mixed dtypes is an object matrix of typed cells, and a datetime frame is datetime64[ns]. dtype='object'is always lossless — each cell keeps its own typed value (a
str, a Timestamp, or volas.NA). - A
strcolumn has no numeric meaning, so any numeric/temporaldtyperaises —
dtype='object' to keep the strings. - A datetime column is exempt from the integer-NA raise: under
dtype='int64'
NaT exports as its exact epoch-ns sentinel (datetime never round-trips through float); na_value overrides that sentinel when given. to_numpy()is a bulk read; it does not auto-refresh stale indicator columns and
df.fulfill() first.
For a zero-copy hand-off to Arrow / DLPack consumers, see Arrow & DLPack interop.
df.to_arrow() -> pyarrow.Table
A volas-specific export to a pyarrow.Table, zero-copy where the dtypes match — the numeric / string / datetime column buffers are shared with Arrow, while bool and the null bitmap are repacked. Requires pyarrow (imported lazily, only here). It is a convenience over volas's Arrow C-Stream bridge: any Arrow consumer can read the frame directly through the standard arrowcstream PyCapsule protocol, with no to_arrow() call and without volas depending on pyarrow.
import pyarrow as pa
tbl = df.to_arrow()        # -> pyarrow.Table (shares the column buffers)
tbl = pa.table(df)         # identical, via the arrowcstream protocol
pdf = pl.from_dataframe(df)  # polars reads it through the same protocol
Returns a pyarrow.Table. See Arrow & DLPack interop for the full zero-copy contract and the DLPack export.
df.topandas(dtypebackend='numpy') -> pandas.DataFrame
Export to a pandas.DataFrame (pandas is imported lazily, only here — it is not a runtime dependency). A DatetimeIndex round-trips, and the reverse bridge is DataFrame.frompandas.
- dtype_backend?
str = 'numpy'how a missing value is carried into pandas:
'numpy' — the most ecosystem-compatible form: an int / bool column with a missing
value becomes float64 / object with NaN (like pandas.Int64.to_numpy()).
- 'numpy_nullable' — a faithful, lossless masked round-trip: an int / bool / str
column stays Int64 / boolean / string with the hole as pandas.NA.
pdf = df.to_pandas()                                # 'numpy' backend (NaN-based)
pdf = df.topandas(dtypebackend='numpy_nullable')  # lossless masked Int64 / boolean / string
See pandas interop for the round-trip details.
df.to_csv(path=None, ...) -> str | None
Write the frame as CSV — a subset of pandas to_csv. With a path it writes the file and returns None; with path=None it returns the CSV as a str.
- path?
str | os.PathLike | None = Nonethe output file;Nonereturns a string. - sep?
str = ','the field delimiter. - index?
bool = Truewrite the row index as the first column. - header?
bool = Truewrite the column-name header row. - na_rep?
str = ''the token written for a missing value. - columns?
list[str] | None = Nonethe columns to write, in order;None
- float_format?
str | None = Nonea printf-style float format, e.g.'%.2f'.
to_csv writes **every column the frame holds — directive (computed)
columns included**. A directive column like ma:3 is a real column once
materialized (it counts in df.columns), so it is exported alongside the raw
OHLCV columns; its warm-up rows render as the empty na_rep. Pass columns= to
choose exactly what to write — e.g. the raw columns only. Like every bulk read,
to_csv first requires the frame to be fresh: call fulfill() after an append,
or it raises while a cached column is stale.
from volas import DataFrame
df = DataFrame({     'open':   [1.0, 2, 3, 4, 5],     'high':   [2.0, 3, 4, 5, 6],     'low':    [0.5, 1, 2, 3, 4],     'close':  [1.5, 2.5, 3.5, 4.5, 5.5],     'volume': [10, 20, 30, 40, 50.0], }) df['ma:3']                                # materialize a directive (computed) column df.fulfill()                              # refresh the cache before a bulk export
Default: EVERY column is written — the ma:3 directive column included:
df.to_csv(index=False)
'open,high,low,close,volume,ma:3\n1.0,2.0,0.5,1.5,10.0,\n...,2.5\n...'
                           ^^^^ directive column present; warm-up rows blank
Pass columns= to write exactly what you want — here the raw columns only:
df.to_csv(index=False, columns=['open', 'high', 'low', 'close', 'volume'])
Series
df[col] and df[directive] return a Series — a named 1-D column whose API is pandas-compatible: arithmetic / comparison / logical operators, .sum() / .mean() / .std() / …, .shift() / .diff() / .fillna(), .iloc / .loc, .tonumpy() / .tolist(). See the rest of the pandas-compatible API for the full list. There is no public Series constructor — a Series is always obtained by indexing a DataFrame.
s = df['close']
s.name                 # 'close'
(s - s.shift(1)).mean()
df['ma:5 > ma:20']     # a directive likewise returns a Series (here a bool one)
Beyond pandas, a Series also exposes the 15 TA-Lib Math Transform functions as methods — acos asin atan ceil cos cosh exp floor ln log10 sin sinh sqrt tan tanh:
df['close'].ln()
df['high'].sqrt()
A datetime64[ns] Series exposes the pandas .dt accessor: calendar components (year month day hour minute second microsecond nanosecond quarter dayofweek dayofyear daysinmonth), calendar predicates (ismonthstart … isyearend, isleapyear), names (dayname() / monthname()), formatting (strftime(fmt)), bar alignment (floor(freq) / ceil(freq) / round(freq) / normalize()), and isocalendar(). A missing element yields NA in every component:
t = volas.to_datetime(df['time'])
t.dt.hour                  # int64 Series, 0..23
t.dt.dayofweek             # Monday=0 .. Sunday=6
t.dt.floor('15min')        # datetime Series aligned to the 15-minute bar
Series.from_arrow(data, name=None) -> Series
A volas-specific static method that builds a Series from any object exposing the Arrow C-Data array protocol (arrowcarray) — a pyarrow.Array, a polars Series, etc. The data buffer is borrowed where the dtype matches (otherwise copied); the result carries a fresh RangeIndex.
- data the Arrow source — any object implementing
arrowcarray. - name?
str | None = Nonethe name for the resultingSeries.
s = Series.fromarrow(paarray, name='close') # pyarrow.Array -> Seriesseries.tonumpy(dtype=None, navalue=...) -> np.ndarray
The column values as a 1-D NumPy array — pandas.Series.to_numpy semantics:
- dtype
str | None— an optional export cast.None(the default) gives the
numpy.ndarray.astype, the common values being:
- 'int64', 'int32', 'int16', 'int8' (and the unsigned 'uint64', 'uint32',
'uint16', 'uint8') — integer. Over a column with missing values this raises
unless na_value is given (an NA has no integer representation).
- 'float64', 'float32', 'float16' — floating point; a missing cell is NaN.
- 'bool' — boolean.
- 'datetime64[ns]' — datetime nanoseconds; a missing cell is NaT.
- 'object' (or 'O') — Python objects, each cell its own typed value (lossless).
- na_value
Any— the value to substitute for each missing cell. Default: the
NaN for the float export, None in an object array). With
an explicit integer dtype, the values stay exact (a large int is not funnelled
through float64) and the holes become na_value.
series = DataFrame({'qty': [1, None, 3]})['qty']    # int64 with a missing value
series.to_numpy()                          # -> array([ 1., nan,  3.])   (float64; a missing int -> NaN) series.tonumpy(dtype='int64', navalue=0) # -> array([1, 0, 3])         (int64; NA filled, dtype kept) series.tonumpy(navalue=-1)               # -> array([ 1., -1.,  3.])   (default float export, NA -> -1)
without na_value, an integer dtype over a missing value raises
series.to_numpy(dtype='int64')
ValueError: cannot convert a column with missing values to integer NumPy dtype 'int64' ...
Notes:
- The default (no
dtype, nona_value) is the dtype-specific export: a missing
NaN / NaT (NumPy has no NA), while a dense column keeps its native dtype. A float NaN is in-band, so a float column cast to an integer dtype likewise raises when any value is NaN (pass na_value). - Like pandas,
na_valueonly changes the missing cells — without an explicitdtype
float64 (the default), and na_value simply fills the NaN slots. - For a lossless NA round-trip that keeps the native dtype and the missing
series.to_arrow() carries the null bitmap) or series.topandas(dtypebackend='numpy_nullable'); the NA mask alone is series.isna().to_numpy().
series.to_arrow() -> pyarrow.Array
A volas-specific export of the column to a pyarrow.Array, zero-copy where the dtype matches (the numeric / string / datetime buffer is shared; bool and the null bitmap are repacked). Requires pyarrow (imported lazily). It is a convenience over volas's Arrow C-Data bridge: any Arrow consumer can read the series directly through the standard arrowcarray PyCapsule protocol.
import pyarrow as pa
arr = series.to_arrow()    # -> pyarrow.Array (shares the buffer)
arr = pa.array(series)     # identical, via the arrowcarray protocol
Returns a pyarrow.Array. The column also exports zero-copy to NumPy / PyTorch / JAX via DLPack (np.from_dlpack(series)) — see Arrow & DLPack interop.
Row
df.iloc[i] and df.loc[label] return a Row — a single record whose .name is its index label. A Row has no public constructor (Row(...) raises TypeError: No constructor defined for Row); you only obtain one by indexing a frame, and you may pass it to df.append.
row = df.iloc[-1]      # the latest bar
row.name               # its index label (e.g. a Timestamp for a DatetimeIndex)
row.to_dict()          # {column: value}
row.to_numpy()         # the numeric cells as a 1-D ndarray
Live cumulation — a tf-aware DataFrame
For live streaming, give a DataFrame a time_frame and append finer bars into it, instead of re-cumulating the whole frame each tick. df.cumulate(tf) returns such a frame (the forming period kept live), or build one directly with DataFrame(data, time_frame=..., cumulators=...) (the given rows are taken as already-final bars at that frame; requires a DatetimeIndex).
On a tf-aware frame:
- df.append(bar) folds the bar in: one in the open period **updates the
df.iloc[-1]); one in a new period rolls over into a fresh
row; a re-sent forming bar (same timestamp) updates rather than double-counts.
- df.iloc[-1] is the current (still-open) period — the live bar.
- df[directive] / df.exec(directive) computes indicators over the
append only
marks them stale, and the next read recomputes just the tail.
- df.cumulate(target) must be a whole multiple of the source frame (e.g.
5m→15m, not 5m→7m; a week or 3-day bar does not nest into a month/year);
the same frame is a copy().
df = history.cumulate('5m')   # a tf-aware 5m frame (history is finer, e.g. 1m)
for bar in stream:            # each bar is a finer DataFrame
    df.append(bar)            # folds into the forming 5m bar
    df.iloc[-1]               # the live, still-forming bar
    df['macd']               # indicators over the cumulated frame
See Cumulation and DatetimeIndex for details.
readcsv(path, sep=',', header=True, parsedates=None, indexcol=None, navalues=None, keepdefaultna=True, tz=None, date_unit=None) -> DataFrame
A top-level function that reads a CSV file into a DataFrame, inferring per-column dtypes — a fast, pandas-subset CSV reader.
- path
str | os.PathLikethe CSV file path — a string or anyos.PathLike
pathlib.Path).
- sep?
str = ','the field delimiter (a single character);delimiteris an
- header?
bool = TrueTrue(or omitted) treats the first row as the header;
False / None means no header (columns are named '0'…'n-1').
- parse_dates?
list[str] | None = Nonecolumn names to parse into datetime
- index_col?
str | int | None = Nonea column name or integer position to move
parse_dates, so naming a parsed date column
yields a DatetimeIndex.
- na_values?
str | list[str] | None = Noneextra missing-value tokens. - keepdefaultna?
bool = Truealso treat the default NA tokens as missing. - tz?
str | None = Nonethe timezone for theindex_coldatetime: a naive date
tz (stored UTC, the index tagged). Pass the date column via
indexcol and do not also list it in parsedates. See Timezones.
Accepts either:
- a fixed UTC offset, e.g. '+08:00' / '-05:00'
- an IANA timezone name, e.g. 'America/New_York' / 'Asia/Shanghai' / 'UTC'
- dateunit?
str | None = Nonereadindexcolas an epoch integer in this unit
tz then only sets the display zone). One of:
- 's' — seconds
- 'ms' — milliseconds
- 'us' — microseconds
- 'ns' — nanoseconds
from volas import read_csv
df = read_csv('klines.csv')                        # RangeIndex df = read_csv('klines.csv',               parsedates=['timekey'],            # parse to datetime               indexcol='timekey')                # -> DatetimeIndex df = read_csv('data.tsv', sep='\t', header=False,  # no header -> '0'..'n-1'               na_values=['NA', 'null'])
to_datetime(obj, unit='ns', format=None) -> Series
A top-level function that converts epoch numbers or datetime strings to a datetime Series, mirroring pandas.to_datetime. obj may be a Series, a 1-D NumPy array, or a list. A missing input (a float NaN, or a volas.NA in an int column) becomes NaT, like pd.to_datetime.
- obj the values to convert — numeric epochs, datetime strings, or an
Series (returned unchanged).
- unit?
str = 'ns'the epoch unit for numeric input (sub-unit fractions are
pd.to_datetime). One of:
- 's' — seconds
- 'ms' — milliseconds
- 'us' — microseconds
- 'ns' — nanoseconds (the default)
- format?
str | None = Nonean explicit datetime format for string input
format=, e.g. '%Y-%m-%d %H:%M:%S') — faster and unambiguous; ignored for
numeric input. Any strftime/strptime directive string; None auto-infers.
Naive strings parse as UTC and offset-aware strings (…+08:00) are absolute. To display the resulting index in a zone, make it the index and tag the zone with tzlocalize / tzconvert (see Timezones).
from volas import to_datetime
parse an epoch-seconds column to datetime, then make it the index
df['time'] = to_datetime(df['time'], unit='s')
df = df.set_index('time')                       # -> DatetimeIndex
df = df.tzlocalize('America/NewYork')         # tag the display zone (see Timezones)
For an in-place, truncating cast (the NumPy / pandas astype idiom), use df.astype({'time': 'datetime64[s]'}) instead.
directive_stringify(directive: str) -> str
Get the canonical full name of a directive — the actual column name volas caches it under. The command name is lowercased and default arguments / series are dropped to save space.
from volas import directive_stringify
directive_stringify('kdj.j') 'kdj.j'
directive_stringify('kdj.j:9,3,2,100@high,close,close') 'kdj.j:,,2,100@,close'
command names are case-insensitive and canonicalize to lowercase
directive_stringify('MACD:12,26')
'macd'
directive_lookback(directive: str) -> int
Get the lookback period of a directive — the minimum number of prior data points required before the indicator produces a valid result.
from volas import directive_lookback
directive_lookback('ma:20') 19
directive_lookback('boll') 19 (default period 20)
Compound directive: lookback accumulates across nested expressions.
repeat:5 needs 4 extra points, boll.upper (period 20) needs 19 -> 23
directive_lookback('repeat:5@(close > boll.upper)')
23
The rest of the pandas-compatible API
Everything below behaves like its pandas counterpart — if you know it from pandas, it works the same in volas, except for the deliberate NA-model divergences noted after the listing.
# --- DataFrame: metadata --------------------------------------------------
df.columns / df.shape / len(df) / df.dtypes      # dtypes -> dict
df.index                          # row labels, as a NumPy array
col in df ; for col in df         # membership / iterate column names
df.tz / df.tzlocalize(tz) / df.tzconvert(tz)   # DatetimeIndex tz; see Timezones
--- DataFrame: selection -------------------------------------------------
df[col]                           # -> Series
df[[col, ...]]                    # -> DataFrame
df[bool_mask]                     # -> DataFrame (filter rows; mask = Series | ndarray)
df.iloc[...] / df.loc[...] / df.at[label, col] / df.iat[i, j]
df.head(n=5) / df.tail(n=5)
--- DataFrame: reshaping & dtypes ----------------------------------------
df.drop([label, ...], axis=0)     # drop rows by label (axis=1 -> columns)
df.dropna(how='any') / df.sortindex(ascending=True) / df.resetindex(drop=False)
df.rename({old: new}) / df.astype({col: dtype}) / df.set_index(col)
df.astype({col: 'datetime64[s]'})  # numeric epoch -> datetime (unit s|ms|us|ns; truncating)
df.copy() / df.equals(other) / df.tocsv(path=None, ...)   # tonumpy: see its own section (dtype, na_value)
--- DataFrame: writing ---------------------------------------------------
df[col] = scalar | array | Series          # add / replace a column (positional)
df.loc[mask, col] = value ; df.iloc[i, j] = value ; df.at[label, col] = value
--- Series ---------------------------------------------------------------
s.name / s.dtype / len(s) / s.tz / s.index
s.tolist()                       # tonumpy has NA caveats -> see its own section (dtype, na_value)
s.iloc[...] / s.loc[...]
s + s, s - 1, -s, ...             # elementwise arithmetic
s > 0, s == t, s != t, ...        # comparison -> bool Series
s & t, s | t, ~s, s ^ t           # logical -> bool Series
s.sum() / s.mean() / s.min() / s.max() / s.std() / s.var() / s.median()   # skip missing
s.shift(n=1) / s.diff(n=1) / s.fillna(v) / s.ffill() / s.bfill()           # see Missing values: NA keeps the dtype
s.isna() / s.notna() / s.dropna() / s.equals(t)
Window operations (rolling / expanding / ewm) — compatibility only
**This surface exists so pandas research / labeling code moves over verbatim.
It is NOT the recommended way to compute indicators, and it should NOT be
used in a live trading system**: a window result is a plain Series — it does
not join the directive cache and is not incrementally refreshed by
append()/fulfill(); every new bar costs a fullO(n)recompute.
Prefer the equivalent directive (df['ma:20'],df['median:30'],
df['stddev:20'], …): same kernels, plus caching andO(lookback)per-bar
refresh.
s.rolling(window, minperiods=None, center=False)   # int window; minperiods defaults to window
s.expanding(min_periods=1)
s.ewm(com=|span=|halflife=|alpha=, minperiods=0, adjust=True, ignorena=False)
                                                    # exactly ONE decay spelling
Rolling / Expanding (pandas semantics: NA skipped, min_periods gates):
.count() .nunique()                                 # -> int64 Series (native NA)
.sum() .mean() .median() .min() .max()
.var(ddof=1) .std(ddof=1) .sem(ddof=1) .skew() .kurt()
.quantile(q, interpolation='linear') .rank(method='average', ascending=True, pct=False)
.first() .last()                                    # dtype-preserving
.corr(other) .cov(other, ddof=1)
Ewm:
.mean() .sum() .var(bias=False) .std(bias=False) .corr(other) .cov(other, bias=False)
center=True labels each window at its center — it reads future bars relative to the label. That is exactly what a labeling pass wants, and exactly what a live signal must never do; it is supported for the former.
Time-based windows (rolling('5min') / a timedelta) are deliberately not implemented. For multi-timeframe computation, maintain **two tf-aware DataFrames** (see Cumulation) and append each bar to both — that is the supported, O(lookback)-per-bar design; emulating a coarser timeframe through window arithmetic recomputes everything on every bar.
Not provided (pandas members that conflict with volas's model): apply / agg / pipe (arbitrary-Python-per-window), win_type, step, on, closed, method, ewm(times=...), ewm.online() — append() + directives already cover the streaming use case.
Known pandas divergences (the volas.NA model)
A handful of APIs diverge from pandas by design, because volas stores missing values natively as volas.NA (no object dtype, no silent float upcast):
shift/diff/fillnaand friends keep the column's dtype — a missing
volas.NA, not an int/bool/str column upcast to float/object.
- Comparisons (
==!=<<=>>=) return a non-nullable bool mask:
False (and != compares True), following IEEE /
NumPy — not pandas-nullable's three-valued NA. This keeps masks free of NA
so df[mask] and assignment stay total.
- Storage keeps the dtype. Where pandas upcasts an int/bool column with a missing
float64 / object, volas keeps it int64 / boolean with the hole as
volas.NA — so to_list() returns exact ints and volas.NA. The numpy export
(to_numpy()) still follows pandas 3.0 exactly: a missing cell becomes NaN / NaT
by default, an integer dtype= over missing values raises, and na_value= fills —
see the dedicated df.tonumpy / series.tonumpy sections above.
For the full picture — why volas's type system is built this way, where pandas's breaks, and the migration gotchas — see volas vs pandas — the type system.
The pandas-shaped indexing and writing details have their own sections — Indexing & selection and Writing & assignment.
Cumulation and DatetimeIndex
Suppose we have a csv file containing kline data of a stock in the 1-minute time frame:
csv = readcsv(csvpath)
print(csv)
date   open   high    low  close    volume
0   2020-01-01 00:00:00  329.4  331.6  327.6  328.8  14202519
1   2020-01-01 00:01:00  330.0  332.0  328.0  331.0  13953191
2   2020-01-01 00:02:00  332.8  332.8  328.4  331.0  10339120
3   2020-01-01 00:03:00  332.0  334.2  330.2  331.0   9904468
4   2020-01-01 00:04:00  329.6  330.2  324.9  324.9  13947162
5   2020-01-01 00:04:00  329.6  330.2  324.8  324.8  13947163    <- an update of
                                                                    2020-01-01 00:04:00
...
19  2020-01-01 00:19:00  327.0  327.2  322.0  323.0  15086985
Note that duplicated records of the same timestamp are not cumulated. All
records except the latest one are discarded.
Read the same csv, but parse the date column into a DatetimeIndex:
df = read_csv(
    csv_path,
    parse_dates=['date'],
    index_col='date'
)
print(df)
open   high    low  close    volume
2020-01-01 00:00:00  329.4  331.6  327.6  328.8  14202519
2020-01-01 00:01:00  330.0  332.0  328.0  331.0  13953191
...
2020-01-01 00:19:00  327.0  327.2  322.0  323.0  15086985
You must have figured it out that the data frame now has a DatetimeIndex.
But it will not become a 5-minute kline unless we cumulate it:
df_5m = df.cumulate('5m')
print(df_5m)
Now we get a 5-minute kline:
open   high    low  close      volume
2020-01-01 00:00:00  329.4  334.2  324.8  324.8  62346461.0
2020-01-01 00:05:00  325.0  327.8  316.2  322.0  82176419.0
2020-01-01 00:10:00  323.0  327.8  314.6  327.6  74409815.0
2020-01-01 00:15:00  330.0  335.2  322.0  323.0  82452902.0
cumulate defaults to OHLCV semantics — open=first, high=max, low=min, close=last, volume=sum — and any other column falls back to last. Pass cumulators= to override a column's aggregator; the common case is a non-OHLCV column that should be summed, such as a turnover (amount) column that would otherwise default to last:
df.cumulate('1h', cumulators={'amount': 'sum'})The supported aggregators are first, max, min, last and sum.
The time_frame may be a string label or a TimeFrame constant — see TimeFrame for the full list.
Bar labels are the period start
Every time frame lies on a fixed grid, and a cumulated bar is labelled with its period's grid start — even when the first raw bar arrives mid-period. A bar that opens with a 09:07 tick on a 15m frame is labelled 09:00, never 09:07, so volas bars line up exactly with exchange klines and with pandas resample (label='left').
The grid origins per frame: intraday frames anchor at midnight of the index's (timezone-aware) trading day — a 15m bar starts at :00/:15/:30/ :45, a 4h bar at 00:00/04:00/…; 1d starts at midnight; 1w on Monday; 3d is a continuous grid from the Unix epoch; 1M / 1y on the calendar month / year. If a daylight-saving transition removes or repeats a period's boundary, the label resolves to the period's earliest real instant.
For live streaming you do not re-cumulate the whole history on every tick — you keep the current 5-minute bar forming and update it as each finer bar arrives. A tf-aware DataFrame does exactly that: it stays an ordinary DataFrame (read columns, run directives, slice it), except append folds each finer bar into the bar currently forming instead of adding a row. You make one with df.cumulate('5m') or DataFrame(data, time_frame='5m'), and the live loop is then just:
| step | call | | ------------------------------ | ------------------------- | | make a 5m frame | cum = df.cumulate('5m') | | feed it the next finer bar | cum.append(bar) | | read the current forming bar | cum.iloc[-1] | | read an indicator over it | cum['macd'] |
Watch the forming bar grow
Build the 5-minute frame from the 1-minute df above one bar at a time. Seed it with the 00:00 bar, then fold in 00:01. Both fall in the same 00:00–00:05 window, so the frame still holds one row — the forming bar — now updated (high rose to 332.0, close to 331.0, volume summed):
cum = df.iloc[0:1].cumulate('5m')   # seed the 5m frame with the 00:00 bar
cum.append(df.iloc[1:2])            # fold in 00:01 (same 5m window)
print(cum)
open   high    low  close      volume
2020-01-01 00:00:00  329.4  332.0  327.6  331.0  28155710.0
Fold in 00:02, 00:03 and 00:04 and the window fills up. That single forming row is now the finished first 5-minute bar — identical to the first row of the one-shot df.cumulate('5m') printed earlier:
for i in range(2, 5):
    cum.append(df.iloc[i:i + 1])
print(cum)
open   high    low  close      volume
2020-01-01 00:00:00  329.4  334.2  324.8  324.8  62346461.0
Now fold in 00:05. It opens the next window, so the 00:00 bar is finalized and a fresh forming bar starts; the frame grows to two rows and cum.iloc[-1] is the new, still-forming 00:05 bar:
cum.append(df.iloc[5:6])
print(cum)
open   high    low  close      volume
2020-01-01 00:00:00  329.4  334.2  324.8  324.8  62346461.0   <- finalized
2020-01-01 00:05:00  325.0  327.8  324.8  327.6  10448427.0   <- still forming
Two properties make this safe for a live feed:
- Indicators are lazy, and fresh on read.
appenddoes not recompute
cum['ema:9'] (or any directive): only the stale tail is refreshed —
O(lookback), not the whole column — over the frame including the forming
row, bit-identical to a one-shot cumulate-then-compute. (A bulk read such as
to_numpy() does not auto-refresh; call cum.fulfill() first, or just read
the directive.)
- Re-sent bars do not double-count. Folding a bar whose timestamp you have
See Live cumulation for the API summary.
TimeFrame
A TimeFrame names a bar interval. It is accepted anywhere volas resamples — df.cumulate, the time_frame DataFrame argument, and the hv indicator — either as a TimeFrame constant or as its equivalent string label. There is no TimeFrame(...) constructor — use one of the constants below or a label string.
TimeFrame.m5            # the 5-minute frame
'5m'                    # the equivalent label string, accepted everywhere too
df.cumulate(TimeFrame.m5)     # identical to df.cumulate('5m')
Supported frames (constant ⇄ label):
| Constant | Label | Alignment | | --- | --- | --- | | TimeFrame.s1 | '1s' | Civil second. | | TimeFrame.m1 | '1m' | Civil minute. | | TimeFrame.m3 | '3m' | Minute-of-hour buckets starting at 00, 03, 06, ... | | TimeFrame.m5 | '5m' | Minute-of-hour buckets starting at 00, 05, 10, ... | | TimeFrame.m15 | '15m' | Minute-of-hour buckets starting at 00, 15, 30, 45. | | TimeFrame.m30 | '30m' | Minute-of-hour buckets starting at 00 and 30. | | TimeFrame.H1 | '1h' | Civil hour. | | TimeFrame.H2 | '2h' | Hour-of-day buckets starting at 00, 02, 04, ... | | TimeFrame.H4 | '4h' | Hour-of-day buckets starting at 00, 04, 08, ... | | TimeFrame.H6 | '6h' | Hour-of-day buckets starting at 00, 06, 12, 18. | | TimeFrame.H8 | '8h' | Hour-of-day buckets starting at 00, 08, 16. | | TimeFrame.H12 | '12h' | Hour-of-day buckets starting at 00 and 12. | | TimeFrame.D1 | '1d' | Civil day in the frame timezone. | | TimeFrame.D3 | '3d' | Continuous 3-day buckets anchored to the Unix epoch; they do not reset at month boundaries. | | TimeFrame.W1 | '1w' | Continuous Monday-start w
README truncated. View on GitHub


