
🚴 Call stack profiler for Python. Shows you why your code is slow!
pyinstrument ============




Pyinstrument is a Python profiler. A profiler is a tool to help you optimize your code - make it faster. To get the biggest speed increase you should focus on the slowest part of your program. Pyinstrument helps you find it!
☕️ Not sure where to start? Check out this video tutorial from calmcode.io!
Installation
pip install pyinstrument
Pyinstrument supports Python 3.8+.
To run Pyinstrument from a git checkout, there's a build step.Take a look at Contributing for more info.
Documentation
To learn how to use pyinstrument, or to check the reference, head to the documentation.
Known issues
- Profiling code inside a Docker container can cause some strange results,
- When using
pyinstrument script.pywherescript.pycontains a class
pickle, you might encounter errors because the
serialisation machinery doesn't know where main is. See this issue
for workarounds
Changelog
v5.1.2
4 January 2026
- Adds the ability to customize description using CLI option
--target-description(#408) - You can set the interval for the Django middleware using the PYINSTRUMENT_INTERVAL option (#416)
- HTMLRenderer can now run preprocessors on the input, to manipulate the call tree before writing to HTML (#403)
- Fix a bug where mismatched start/stops can produce "call stack without an active session" errors (#406)
- Limit sample count for the HTML renderer to ensure the browser can load the sample (#407)
v5.1.1
12 August 2025
- Fix some memory leaks in the low-level C extension (#394)
v5.1.0
10 August 2025
- Precision of printed durations now adapts to the interval of the profile. This allows you to see more detail when the interval, and hides unnecessary detail when the interval is large. (#390)
- Adds an option to the Django middleware to customise the filename of saved profile runs using a callback (#393)
- Adds an aiohttp.web example to the documentation (#389)
v5.0.3
2 July 2025
- Fix a bug where the HTML renderer would crash when the profile is empty (#377)
v5.0.2
24 May 2025
- Fix a bug that caused jupyter notebooks to continue to run after a profiled cell was interrupted with Ctrl-C (#373)
- Fix a type annotation issue when using mypy and import pyinstrument (#373)
v5.0.1
23 January 2025
- Adds a Django option to customise the filename of saved profile runs (#339)
- Improve the FastAPI integration docs (#355)
- Include more options in the IPython magic (#350)
v5.0.0
11 October 2024
Loads of improvements to the HTML renderer!
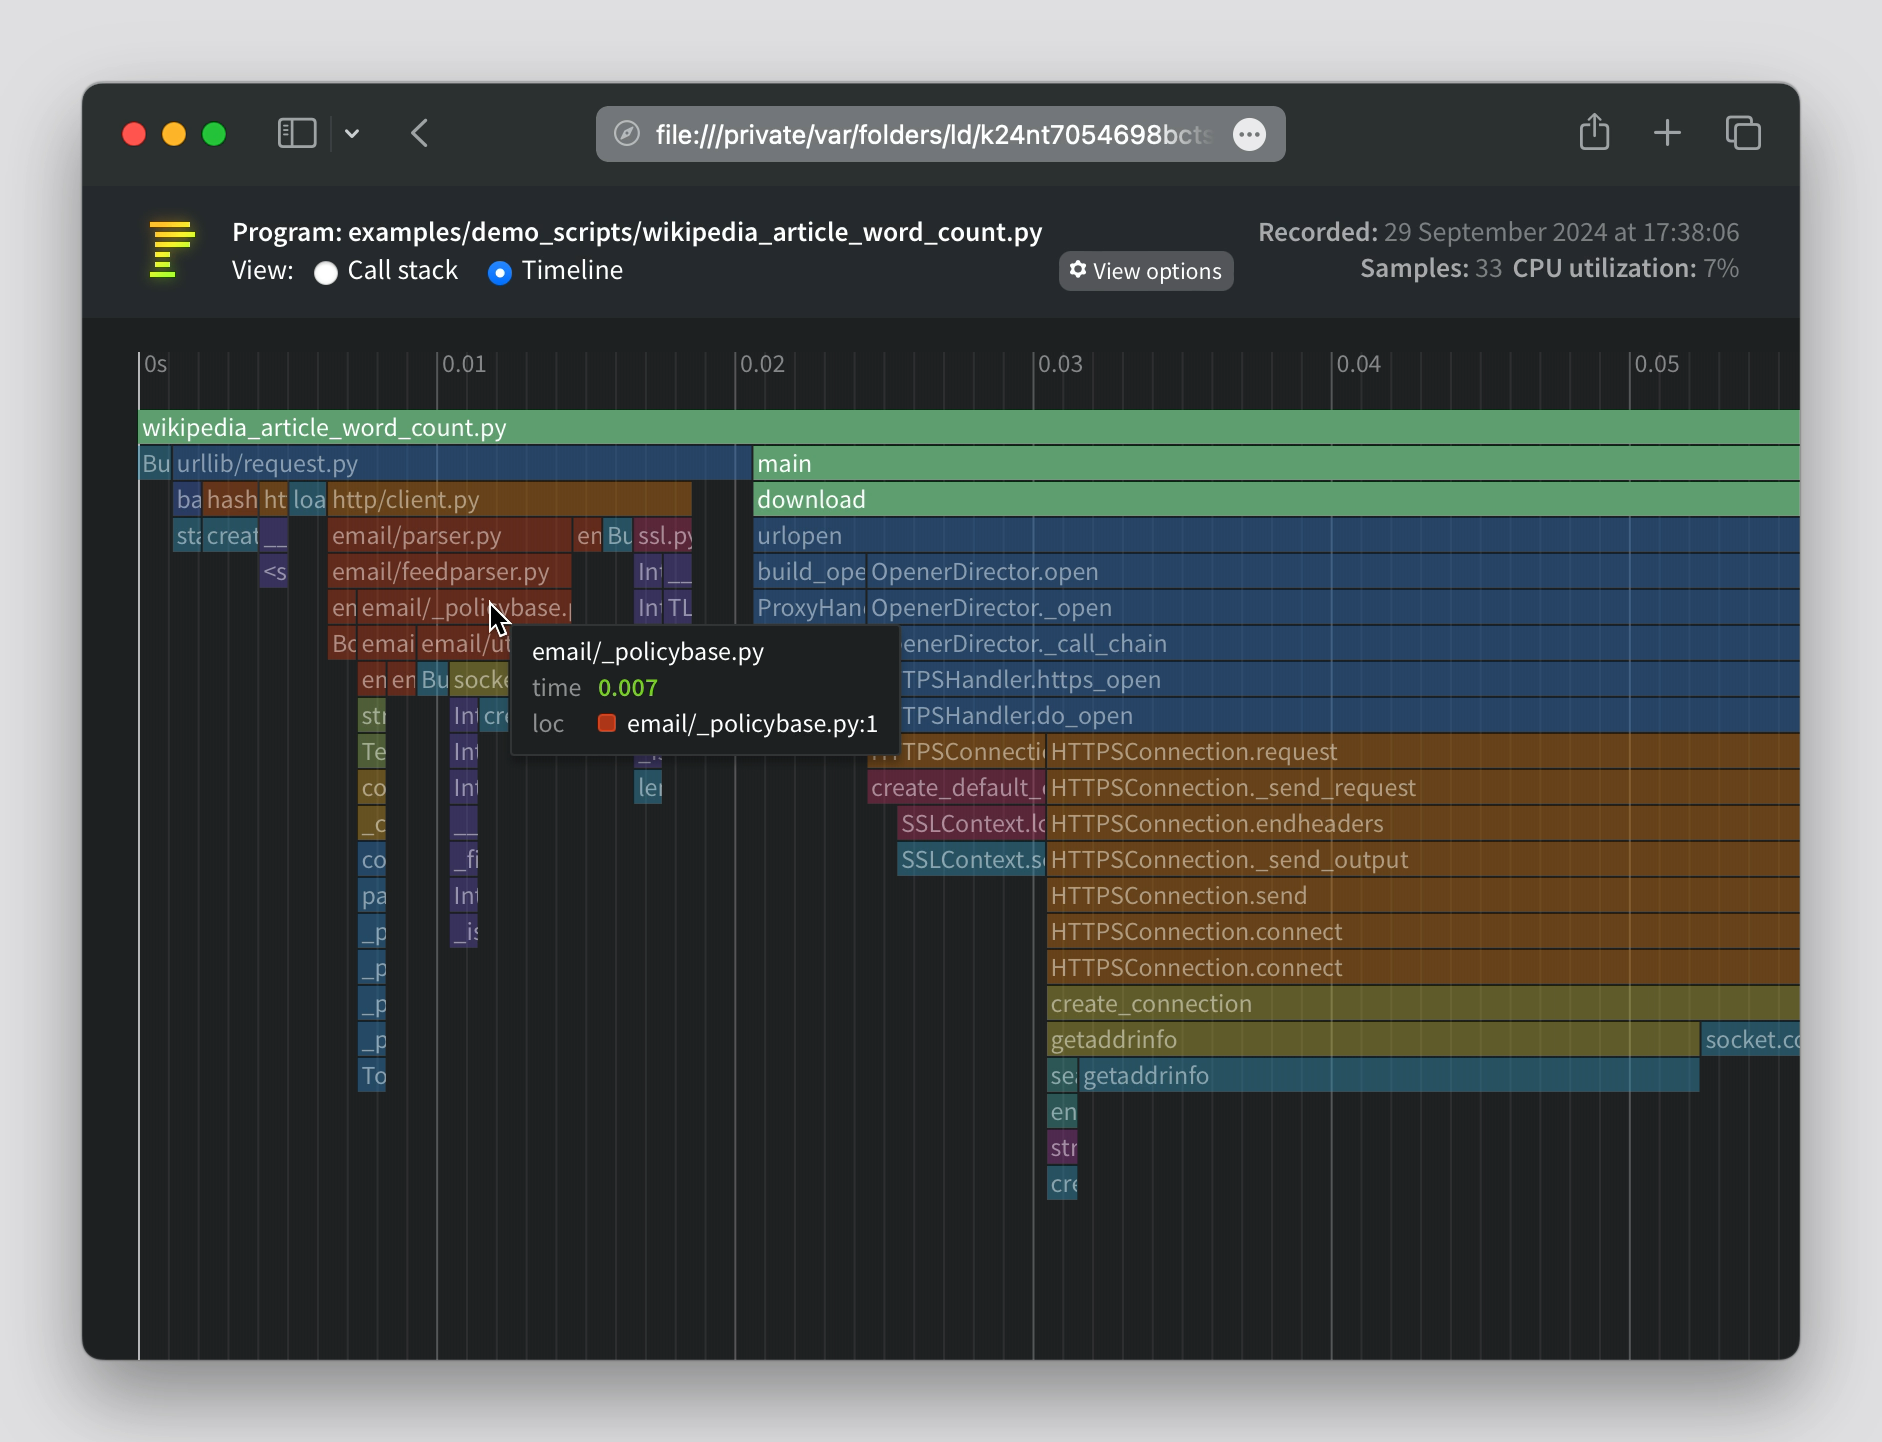
- Timeline mode - see and zoom into an interactive linear timeline!
- HTML mode now has interactive options, rather than needing to set the upfront.
- Streamlined the design of the HTML page header.
- HTML Call stack view supports arrow key navigation.
- The way ‘library’ code is detected has been changed. Previously, if the string ‘/lib/’ occurred in the file path, that was considered library code (and collapsed by default). Now, pyinstrument captures the paths of the Python install and any active virtualenv/conda env at profile time. Files that are stored there are considered library. That should give fewer false positives.
- Calls to profiler.start() can now pass a target_description parameter, which is displayed in the profile readout.
v4.7.3
6 September 2024
- Fix a bug introduced in 4.7.0 which would cause the profiler to crash when profiling code with unusual locals, notably some pytest extensions (#332)
- Fix a bug that causes pyinstrument to fail to import packages like
glomon Python 3.12 or later, which mutate the locals() dict. (#336) - Fix a bug that caused a
UnicodeDecodeErroron some platforms (#330) - Fix a DivideByZero error that occurs in some situations
- The IPython integration takes greater step to ensure a clean profile output, by ensuring internal frames are trimmed before printing. (#321)
v4.7.2
5 August 2024
- Add CPython 3.13 wheels
- Fix a bug that caused the HTML output to fail to render in some browser contexts (#328)
v4.7.1
2 August 2024
- Fix issue with PyPI upload
v4.7.0
1 August 2024
- Adds a new, convenient API for profiling chunks of Python code! You can now profile simply using a
withblock, or a function/method decorator. This will profile the code and print a short readout into the terminal. (#327) - Adds new, lower overhead timing options. Pyinstrument calls timers on every Python function call, which is fine on systems with fast timing available, but it adds significant overhead on systems that require a syscall for each, such as some Docker environments. Pyinstrument will now detect slow timers present a warning with two choices. You can enable a 'timing thread', which offloads the timing workload from the profiled thread, or, if you're happy with lower resolution, you can opt to use a 'coarse' timer, which is provided on some Linux systems. (#273)
- Alt-click rows in the HTML output to collapse/expand the whole tree (#325)
- Adds a
flatargument to the console output, to present a flat list of functions (#294) - Adds a Litestar example config and docs (#284)
- Preliminary Python 3.13 support (#322)
v4.6.2
26 January 2024
- Fixes a bug with the pstats renderer, where additional frames could be seen in the output. (#287)
- Adds
showalloption to Profiler.outputhtml
v4.6.1
8 November 2023
- Fixes a bug with unwanted variable expansion in the IPython magics
%pyinstrument(#278)
v4.6.0
12 October 2023
- Adds a feature
-c, which allows profiling code directly from the command line, likepython -c. (#271) - Adds a convenience method
Profiler.write_html, for writing HTML output to a file directly. (#266)
v4.5.3
7 September 2023
- Fix a problem in the packaging process that prevented upload to PyPI
v4.5.2
1 September 2023
- Show the program name in the header of the HTML output (#260)
- Improve program name capture through resilience to other programs modifying sys.argv (#258)
- Add support for Python 3.12 (#246)
v4.5.1
22 July 2023
- Fix a bug that caused
[X frames hidden]in the output when frames were deleted due totracebackhide(#255) - Fix a bug causing built-in code to display the filepath
Nonein the console output (#254) - Some docs improvements (#251)
v4.5.0
5 June 2023
- Adds a flat mode to the console renderer, which can be enabled by passing
-p flaton the command line. This mode shows the heaviest frame as measured by self-time, which can be useful in some codebases. (#240) - Adds the ability to save
pstatsfiles. This is the file format used by cprofile in the stdlib. It's less detailed than pyinstrument profiles, but it's compatible with more tools. (#236) - Fixes a detail of the
--show-alloption - pyinstrument will no longer remove Python-internal frames when this option is supplied. (#239) - Internally to the HTML renderer, it now uses Svelte to render the frontend, meaning profile HTML files bundle less javascript and so are smaller. (#222)
v4.4.0
5 November 2022
- Adds the class name to methods in the console & HTML outputs (#203)
- Fix a bug that caused pyinstrument machinery to appear at the start of a profile (#215)
- Frames that set a
traceback_hidelocal variable will now be removed from the output (#217) - Jupyter/IPython magic now supports async/await, if you run with a
--async_mode=enabledflag. (#212) - Fix a crash when more than one root frame is captured in a thread - this can happen with gevent.
- A big refactor to the backend, allowing more than just static information to be captured. This currently is just powering the class name feature, but more is to come!
v4.3.0
21 August 2022
- Adds buttons in the HTML output to switch between absolute and
- Adds a command line flag
--interval(seconds, default 0.001) to change the interval that
- Includes wheels for CPython 3.11.
v4.2.0
- Adds a command-line option
-p--render-optionthat allows arbitrary
filter_threshold from the command line, by doing something like
pyinstrument -p processoroptions.filterthreshold=0.
Here's the help output for the option:
-p RENDEROPTION, --render-option=RENDEROPTION options to pass to the renderer, in the format 'flagname' or 'optionname=option_value'. For example, to set the option 'time', pass '-p time=percentoftotal'. To pass multiple options, use the -p option multiple times. You can set processor options using dot-syntax, like '-p processoroptions.filterthreshold=0'. option_value is parsed as a JSON value or a string.- Adds the ability to view times in the console output as percentages,
time='percentoftotal', or on the command line, use -p, like pyinstrument -p time=percentoftotal. - Adds command line options for loading and saving pyinstrument sessions.
-r session, like pyinstrument -r session -o session.pyisession myscript.py. Loading is via --load, e.g. pyinstrument --load session.pyisession. - Command line output format is inferred from the
-ooutput file
pyinstrument -o profile.html myscript.py, you don't need to supply -r html, pyinstrument will automatically use the HTML renderer. Or if you do pyinstrument -o profile.pyisession myscript.py, it will save a raw session object. - Adds usage examples for FastAPI and pytest to the documentation.
- Fixes a bug causing NotImplementedError when using
async_mode=strict. - Adds support for Python 3.11
v4.1.1
- Fixed an issue causing PYINSTRUMENTPROFILEDIR_RENDERER to output the
v4.1.0
- You can now use pyinstrument natively in an IPython notebook! Just use
%load_ext pyinstrument at the top of your notebook, and then
%%pyinstrument in the cell you want to profile.
- Added support for the speedscope format.
pyinstrument -r speedscope, and upload to the
speedscope web app.
- You can now configure renderers for the Django middleware file output,
PYINSTRUMENTPROFILEDIR_RENDERER option.
- Added wheels for Linux aarch64 (64-bit ARM).
v4.0.4
- Fix a packaging issue where a package called 'test' was installed
- Use more modern C APIs to resolve deprecation warnings on Python 3.10.
- Minor docs fixes
v4.0.3
- CPython 3.10 support
- Improve error messages when trying to use Profiler from multiple threads
- Fix crash when rendering sessions that contain a module in a FrameGroup
v4.0.2
- Fix some packaging issues
v4.0.0
- Async support! Pyinstrument now detects when an async task hits an await,
So, for example, here's a simple script with an async task that does a sleep:
import asyncio
    from pyinstrument import Profiler
async def main():         p = Profiler(async_mode='disabled')
with p:             print('Hello ...')             await asyncio.sleep(1)             print('... World!')
p.print()
asyncio.run(main())
Before Pyinstrument 4.0.0, we'd see only time spent in the run loop, like this:
     .   /         /   Recorded: 18:33:03  Samples:  2
     ////// /\ / //// / //_'/ //     Duration: 1.006     CPU time: 0.001
    /   _/                      v3.4.2
Program: examples/asyncexamplesimple.py
1.006 runonce  asyncio/base_events.py:1784     └─ 1.005 select  selectors.py:553           [3 frames hidden]  selectors, <built-in>              1.005 kqueue.control  <built-in>:0
Now, with pyinstrument 4.0.0, we get:
. / / Recorded: 18:30:43 Samples: 2 ////// /\ / //// / //_'/ // Duration: 1.007 CPU time: 0.001 / _/ v4.0.0
Program: examples/asyncexamplesimple.py
1.006 main asyncexamplesimple.py:4 └─ 1.005 sleep asyncio/tasks.py:641 [2 frames hidden] asyncio 1.005 [await]
For more information, check out the [async profiling documentation] and the [Profiler.async_mode] property.
- Pyinstrument has a [documentation site], including full Python API docs!
v3.4.2
- Fix a bug that caused
--show,--show-regex,--show-allto be ignored
v3.4.1
- Under-the-hood modernisation
v3.4.0
- Added
timelineoption (boolean) to Profiler methodsoutput_html()and
openinbrowser().
v3.3.0
- Fixed issue with
pyinstrument -m module, where pyinstrument wouldn't find
- Dropped support for Python 2.7 and 3.5. Old versions will remain available
v3.2.0
- Added the ability to track time in C functions. Minor note - Pyinstrument
Python -> C -> Python is recorded as
Python -> Python, but Python -> Python -> C will be attributed correctly.
(#103)
v3.1.2
- Fix
<array_function internals>frames appearing as app code in reports
v3.1.1
- Added support for timeline mode on HTML and JSON renderers
- Released as a tarball as well as a universal wheel
v3.1.0
- Added PYINSTRUMENTSHOWCALLBACK option on the Django middleware to
- Fixed bug in the Django middleware where file would not be written because
v3.0.3
- Fixed bug with the Django middleware on Windows where profiling would fail
v3.0.2
- Add
--showand--show-regexoptions, to mark certain files to be
pyinstrument --show '/sympy/' script.py.
v3.0.1
- Fix #60: pass all arguments after -m module_name to the called module
- Fix crash during HTML/JSON output when no frames were captured.
v3.0.0
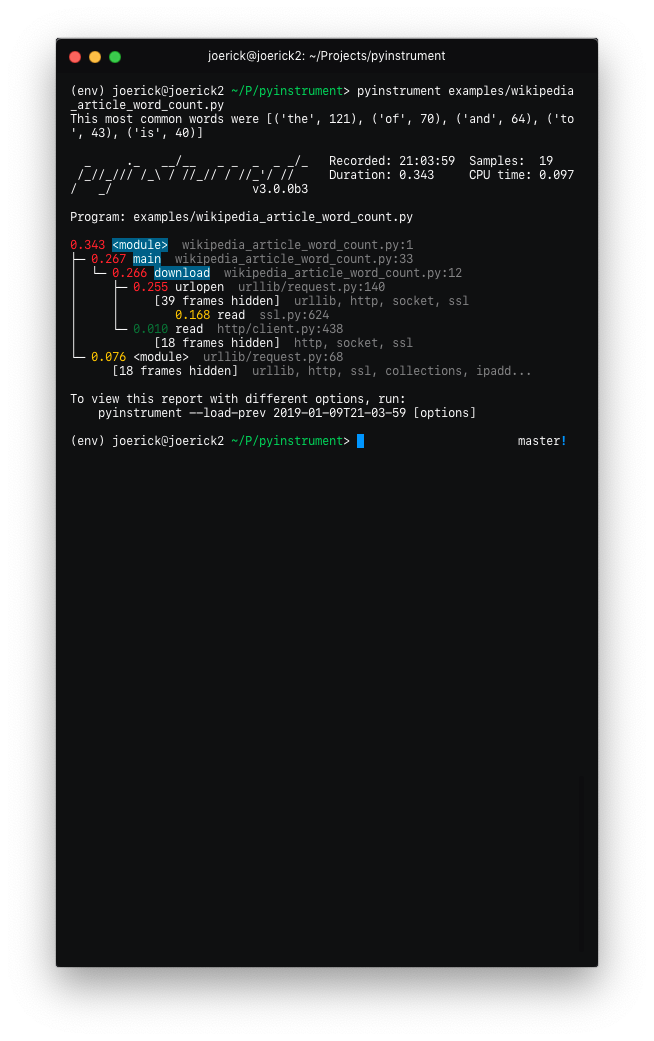
- Pyinstrument will now hide traces through libraries that you're using by default. So instead of showing you loads of frames going through the internals of something external e.g. urllib, it lets you focus on your code.
 |
|  |
|
To go back to the old behaviour, use --show-all on the command line.
- 'Entry' frames of hidden groups are shown, so you know which call is the problem
- Really slow frames in the groups are shown too, e.g. the 'read' call on the socket
- Application code is highlighted in the console
- Additional metrics are shown at the top of the trace - timestamp, number of samples, duration, CPU time
- Hidden code is controlled by the
--hideor--hide-regexoptions - matching on the path of the code files.
--hide=EXPR           glob-style pattern matching the file paths whose
                          frames to hide. Defaults to '/lib/'.
    --hide-regex=REGEX    regex matching the file paths whose frames to hide.
Useful if --hide doesn't give enough control.- Outputting a timeline is supported from the command line.
-t, --timeline        render as a timeline - preserve ordering and don't
condense repeated calls- Because there are a few rendering options now, you can load a previous profiling session using
--load-prev- pyinstrument keeps the last 10 sessions.
- Hidden groups can also call back into application code, that looks like this:

- (internal) When recording timelines, frame trees are completely linear now, allowing
- (internal) The HTML renderer has been rewritten as a Vue.js app. All the console improvements apply to the HTML output too, plus it's interactive.
- (internal) A lot of unit and integration tests added!
v2.3.0
- Big refactor!
Recorders have been removed. The frame recording is now internal to the Profiler object.
This means the 'frame' objects are more general-purpose, which paves the way for...
- Processors! These are functions that mutate the tree to sculpt the output.
They are used by the renderers to filter the output to the correct form. Now, instead of
a time-aggregating recorder, the profiler just uses timeline-style recording (this is
lower-overhead anyway) and the aggregation is done as a processing step.
- The upshot of this is that it's now way easier to alter the tree to filter stuff out, and
do more advanced things like combining frames that we don't care about. More features to
come that use this in v3.0!
- Importlib frames are removed - you won't see them at all. Their children are retained, so
- Django profile file name is now limited to a hundred of characters (#50)
- Fix bug with --html option (#53)
- Add
--versioncommand line option
v2.2.1
- Fix crash when using on the command line.
v2.2.0
- Added support for JSON output. Use
pyinstrument --renderer=json scriptfile.py.
- @iddan has put together an

- When running
pyinstrument --htmland you don't pipe the output to a file, pyinstrument will write the console output to a temp file and open that in a browser.
v2.1.0
- Added support for running modules with pyinstrument via the command line. The new syntax
-m flag e.g. pyinstrument -m modulename! PR
v2.0.4
- Fix crashes due to multi-threaded use of pyinstrument. The fix is in the C extension,
v2.0.3
- Pyinstrument can now be used in a
withblock.
profiler = pyinstrument.Profiler() with profiler: # do some work here... print(profiler.output_text())
- Middleware fix for older versions of Django
v2.0.2
- Fix for max recursion error when used to profile programs with a lot of frames on the stack.
v2.0.1
- Ensure license is included in the sdist.
v2.0.0
- Pyinstrument uses a new profiling mode. Rather than using
- Renderers. Users can customize Pyinstrument to use alternative renderers
renderer argument on Profiler.output(), or using the --renderer
argument on the command line.
- Recorders. To support other use cases of Pyinstrument (e.g. flame charts),
v0.13
-
pyinstrumentcommand. You can now profile python scripts from the shell
$ pyinstrument script.py. This is now equivalent to
python -m pyinstrument. Thanks @asmeurer!
v0.12
- Application code is highlighted in HTML traces to make it easier to spot
- Added
PYINSTRUMENTPROFILEDIRoption to the Django interface, which
- Added
PYINSTRUMENTUSESIGNALoption to the Django interface, for use
Contributing
To setup a dev environment:
virtualenv --python=python3 env . env/bin/activate pip install --upgrade pip pip install -r requirements-dev.txt pre-commit install --install-hooks
To get some sample output:
pyinstrument examples/demoscripts/wikipediaarticlewordcount.py
To run the tests:
pytest
To run linting checks locally:
pre-commit run --all-files
Some of the pre-commit checks, like isort or black, will auto-fix the problems they find. So if the above command returns an error, try running it again, it might succeed the second time :)
Running all the checks can be slow, so you can also run checks individually, e.g., to format source code that fails isort or black checks:
pre-commit run --all-files isort pre-commit run --all-files black
To diagnose why pyright checks are failing:
pre-commit run --all-files pyright
The HTML renderer Vue.js app
The HTML renderer works by embedding a JSON representation of the sample with a Javascript 'bundle' inside an HTML file that can be viewed in any web browser.
To edit the html renderer style, do:
cd html_renderer npm ci npm run serve
When launched without a top-level window.profileSession object, it will fetch a sample profile so you can work with it.
To compile the JS app and bundle it back into the pyinstrument python tool:
bin/buildjsbundle.py [--force]


