
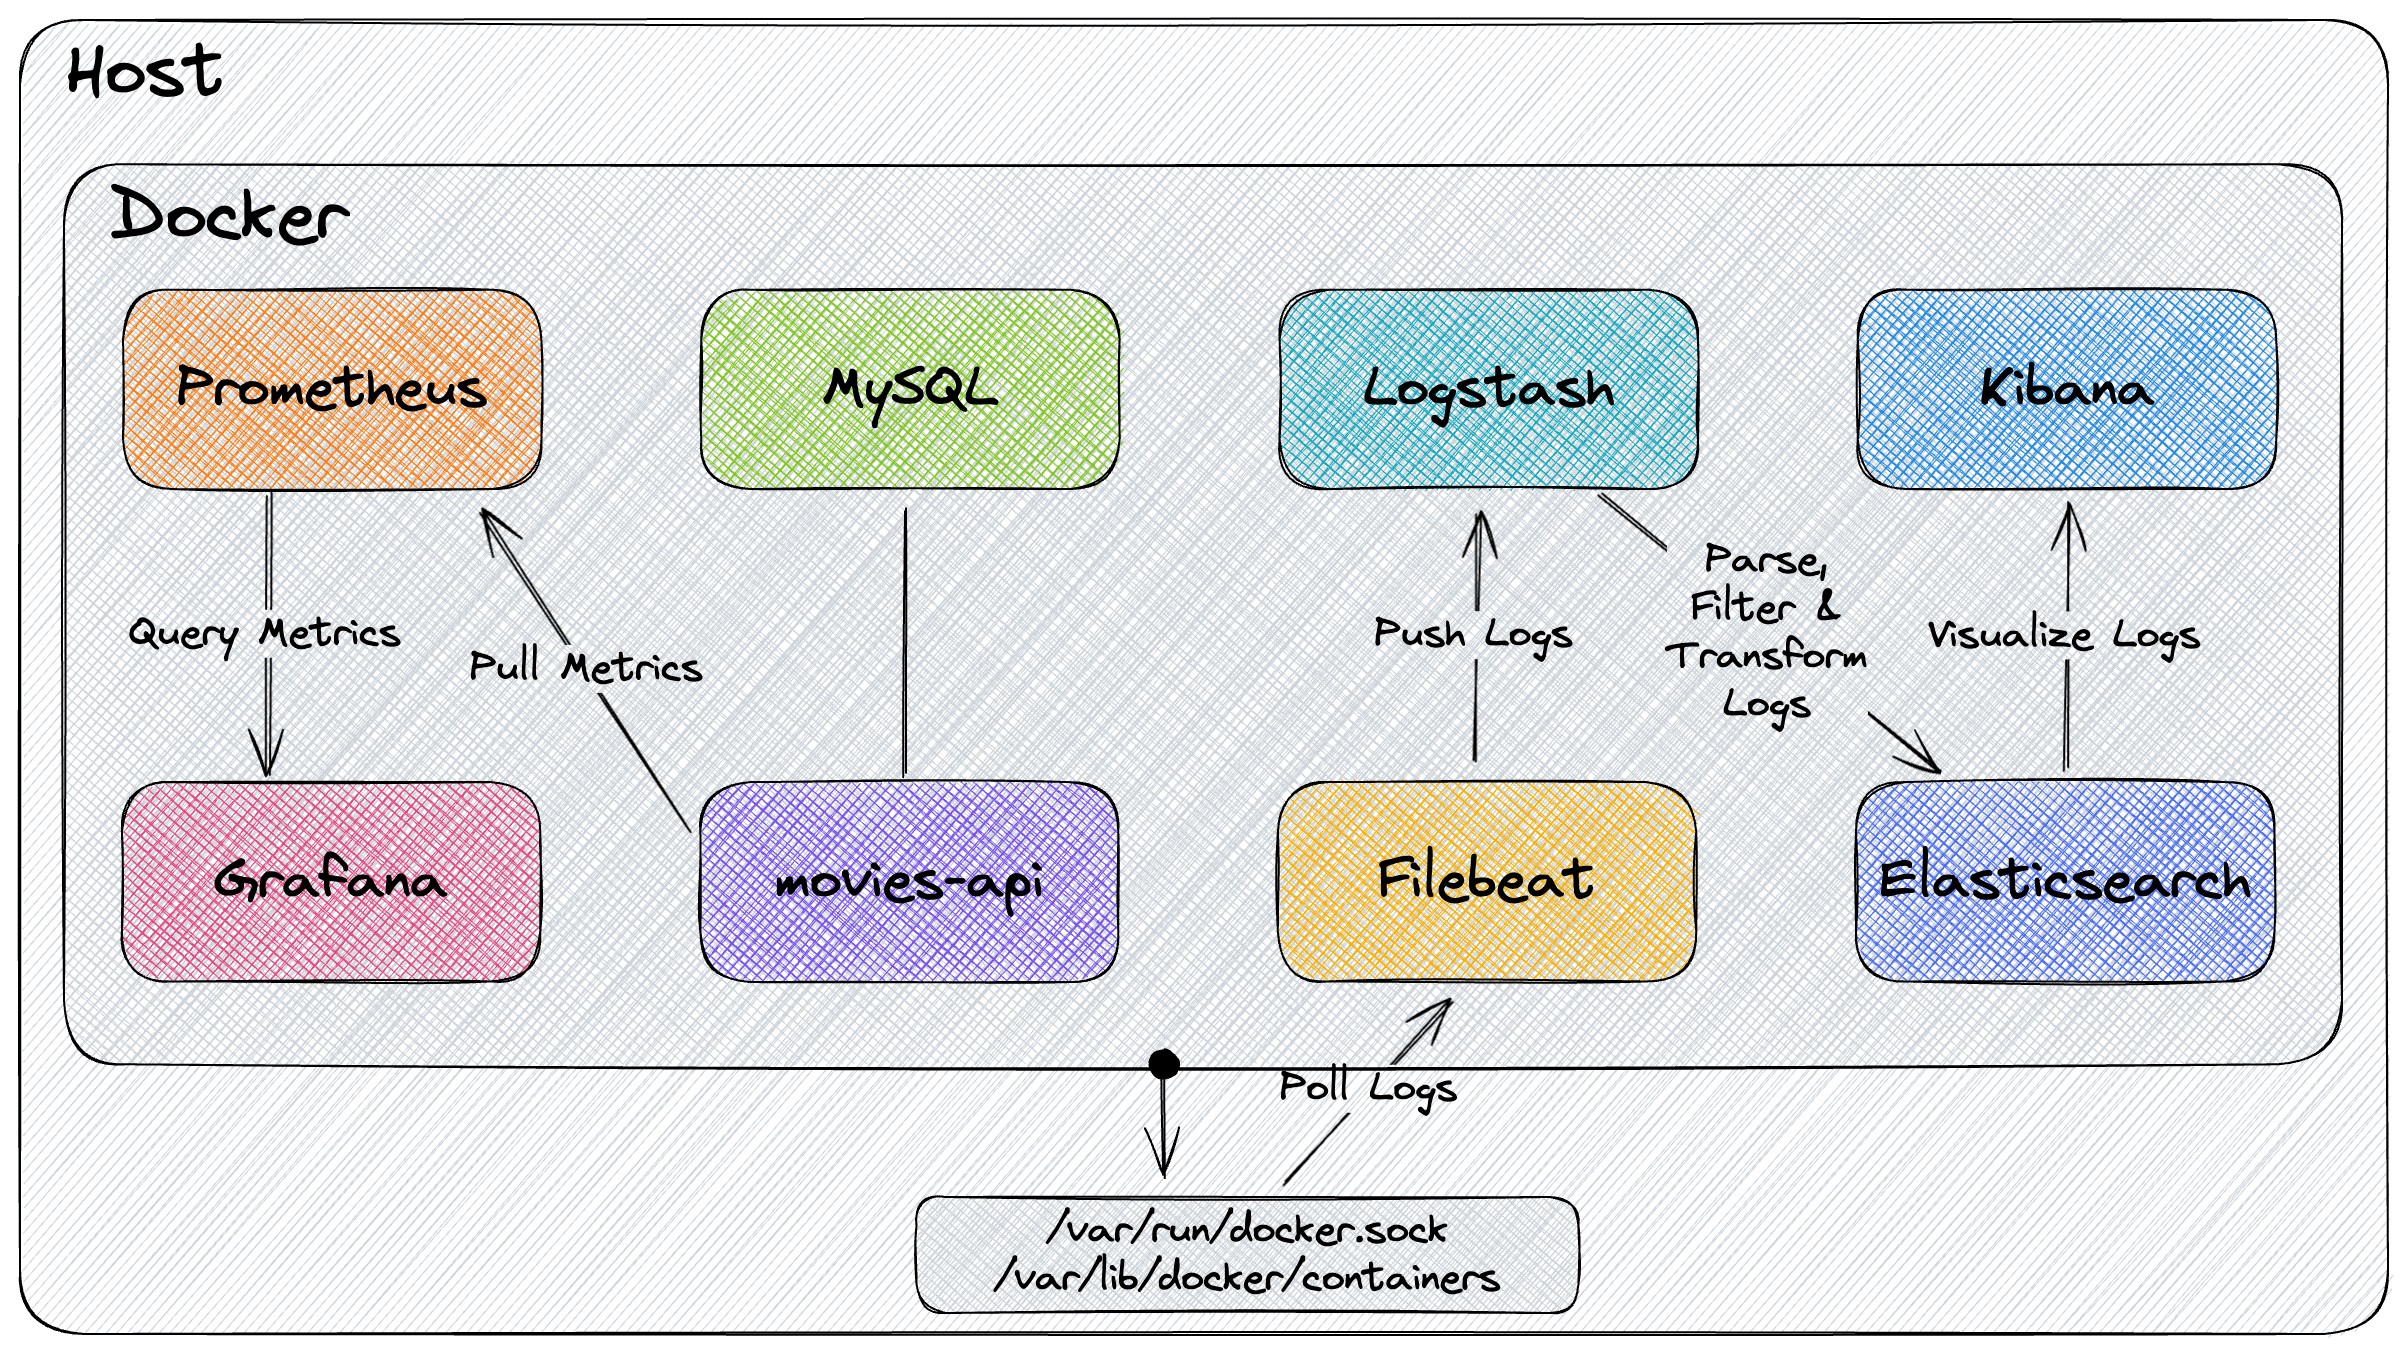
The goal of this project is to implement a Spring Boot application, called movies-api, and use Filebeat & ELK Stack (Elasticsearch, Logstash and Kibana) to collect and visualize application's logs and Prometheus & Grafana to monitor application's metrics.
springboot-elk-prometheus-grafana
The goal of this project is to implement a Spring Boot application, called movies-api, and use Filebeat & ELK Stack (Elasticsearch, Logstash and Kibana) to collect and visualize application's logs and Prometheus & Grafana to monitor application's metrics.
Note: Inkubernetes-minikube-environmentrepository, it shows how to deploy this project inKubernetes(Minikube)
Proof-of-Concepts & Articles
On ivangfr.github.io, I have compiled my Proof-of-Concepts (PoCs) and articles. You can easily search for the technology you are interested in by using the filter. Who knows, perhaps I have already implemented a PoC or written an article about what you are looking for.
Additional Readings
- \[Medium\] Exposing Metrics of a Spring Boot API that uses Spring Data JPA and PostgreSQL
- \[Medium\] Running Prometheus and Grafana to monitor a Spring Boot API application
Project Diagram
Application
- ### movies-api
Spring Boot Web Java application that exposes a REST API for managing movies. It provides the following endpoints:
POST /api/movies -d {"imdbId","title","year","genre","country"}
     GET /api/movies
     GET /api/movies/{imdbId}
  DELETE /api/movies/{imdbId}
Prerequisites
Start Environment
- Open a terminal and inside the
springboot-elk-prometheus-grafanaroot folder run:
docker compose up -d- Wait for the Docker containers to be up and running. To check it, run:
docker ps -aRunning application with Maven
- Open a terminal and make sure you are inside the
springboot-elk-prometheus-grafanafolder;
- Run the following command:
./mvnw clean spring-boot:run --projects movies-api> ./mvnw clean spring-boot:run --projects movies-api -Dspring-boot.run.jvmArguments="-Dspring.profiles.active=non-json-logs"
>Running application as Docker container
- ### Build Docker image
springboot-elk-prometheus-grafana root folder;
- Run the following script to build the image:
- JVM
./build-docker-images.sh./build-docker-images.sh native- ### Environment variables
MYSQL_HOST | Specify host of the MySQL database to use (default localhost) |
| MYSQL_PORT | Specify port of the MySQL database to use (default 3306) |
- ### Start Docker container
docker run --rm --name movies-api -p 8080:8080 \
      -e MYSQL_HOST=mysql \
      --network=springboot-elk-prometheus-grafana_default \
ivanfranchin/movies-api:1.0.0-e SPRINGPROFILESACTIVE=non-json-logs to the command above
Calling the Application Endpoints
- Create movie
curl -X POST http://localhost:8080/api/movies \
    -H "Content-Type: application/json" \
-d '{"imdbId": "tt5580036", "title": "I, Tonya", "year": 2017, "genre": "Biography", "country": "USA"}'- Get all movies
curl http://localhost:8080/api/movies- Get movie
curl http://localhost:8080/api/movies/tt5580036- Delete movie
curl -X DELETE http://localhost:8080/api/movies/tt5580036Services URLs
- MySQL
docker exec -it -e MYSQL_PWD=secret mysql mysql -uroot --database moviesdb
SELECT * FROM movies;exit to leave the MySQL monitor
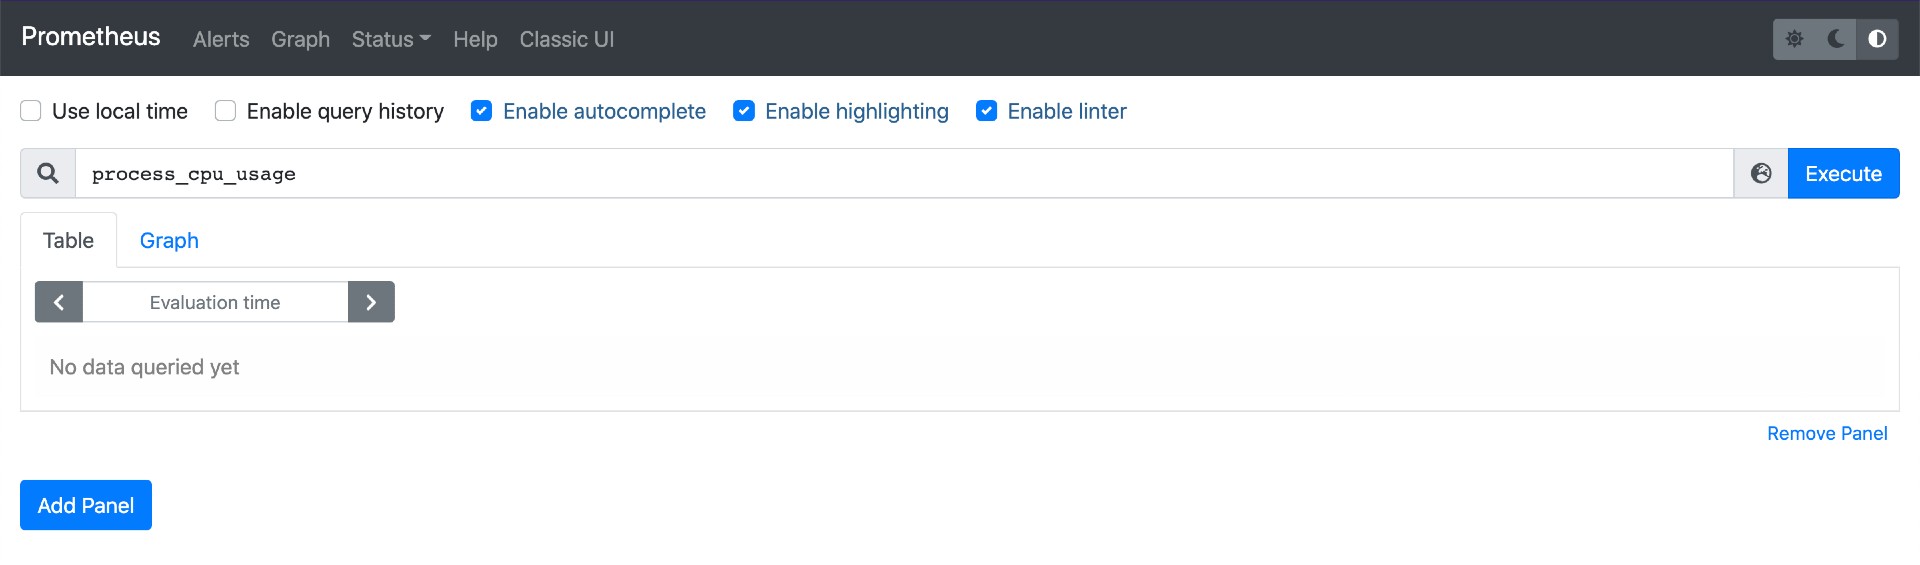
- Prometheus
Prometheus can be accessed at http://localhost:9090
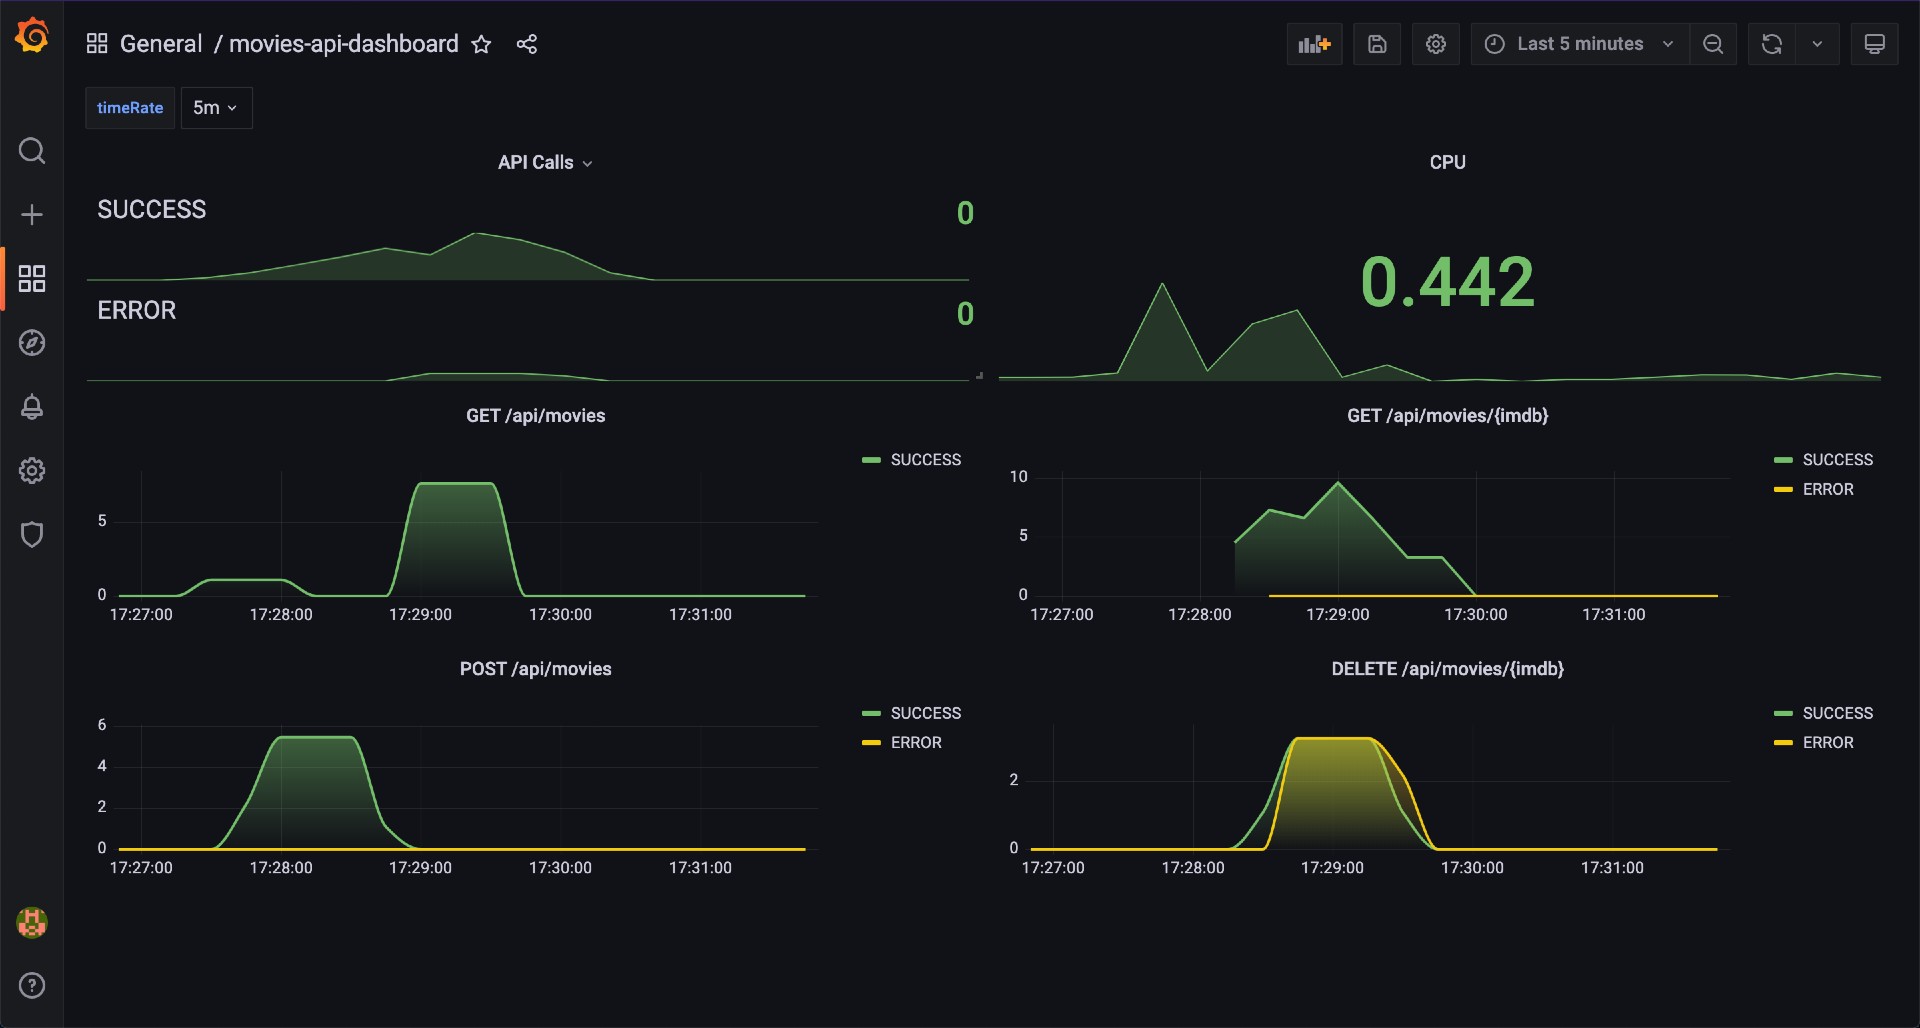
- Grafana
Grafana can be accessed at http://localhost:3000
- In order to login, type admin for both username and password. - You can skip the next screen that asks you to provide a new password. - Select Dashboards on the left-menu. - Click movies-api-dashboard.
- Kibana
Kibana can be accessed at http://localhost:5601
> Note: in order to see movies-api logs in Kibana, you must run the application as Docker container
Configuration
- Access Kibana website; - Click Explore on my own. - On the main page, click the "burger" menu icon, then click Discover. - Click Create index pattern button. - In the Create index pattern form: - Set filebeat-* fot the Name field; - Select @timestamp for the Timestamp field combo-box. - Click Create index pattern button. - Click the "burger" menu icon again, and then click Discover to start performing searches. 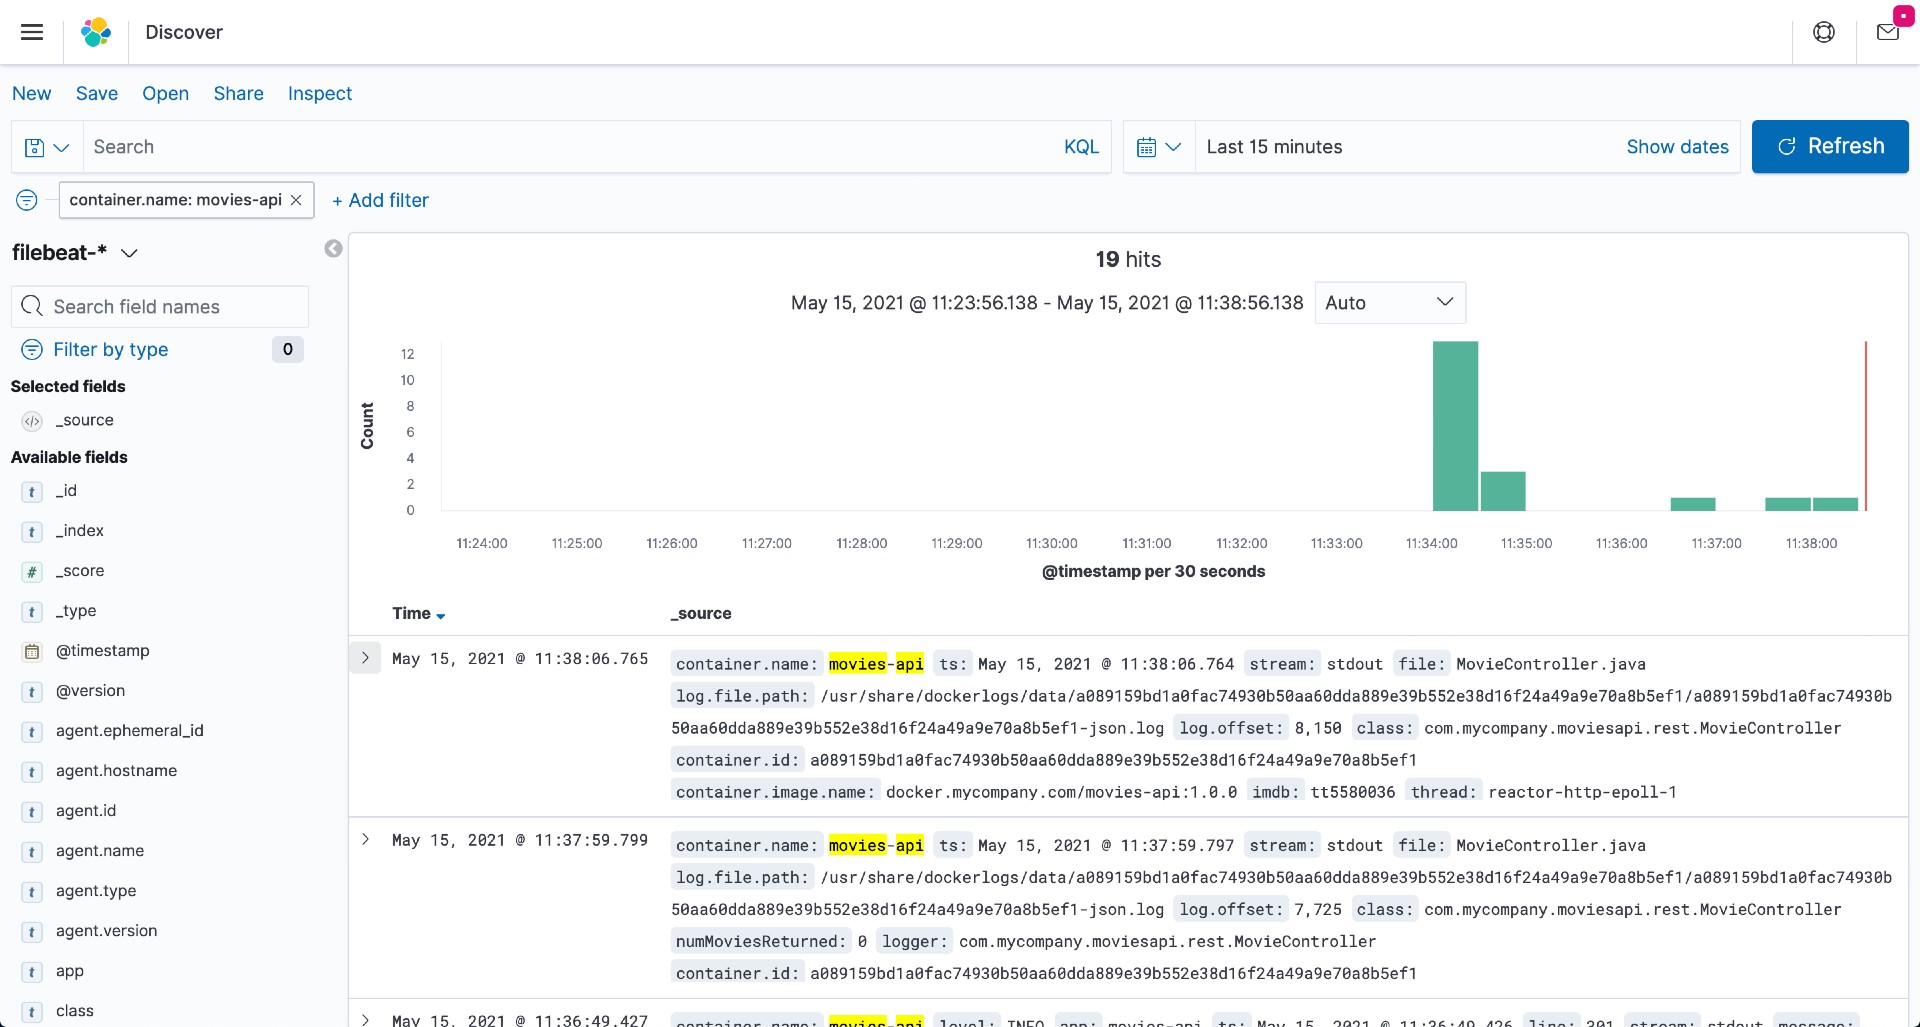
- Elasticsearch
Elasticsearch URL is http://localhost:9200
Useful queries
# Check it's up and running curl localhost:9200 # Check indexes curl "localhost:9200/_cat/indices?v" # Check filebeat index mapping curl "localhost:9200/filebeat-*/_mapping" # Simple search curl "localhost:9200/filebeat-*/_search?pretty"Shutdown
- To stop the application, go to the terminal where it is running and press
Ctrl+C. - To stop and remove docker compose containers, network, and volumes, go to a terminal and, inside the
springboot-elk-prometheus-grafanaroot folder, run the following command:
docker compose down -vCleanup
To remove the Docker images created by this project, go to a terminal and, inside the springboot-elk-prometheus-grafana root folder, run the script below:
./remove-docker-images.shReferences
https://medium.com/@sece.cosmin/docker-logs-with-elastic-stack-elk-filebeat-50e2b20a27c6


