
Generate Grafana dashboards from YAML with automatic panel positioning using Helm Chart templating.
grafaml
WARNING: This chart has moved registries. Starting from v3.0.0,
it will be available only at oci://ghcr.io/ernail/charts/grafaml
Generate Grafana dashboards from YAML with automatic panel positioning using Helm Chart templating.
This YAML:
dashboardBase:
  title: "Simple Dashboard"
panels:   columns: 2   panelHeight: 8   list:     - title: "Prometheus Targets Up"       type: "stat"       targets:         - expr: "up"
- title: "Resource Usage in Percent"       description: "Memory and CPU Usage"       type: "stat"       targets:         - expr: "(1 - (nodememoryMemAvailablebytes / nodememoryMemTotalbytes)) * 100"           legendFormat: "Memory Usage"         - expr: "sum by (instance, job)(avg by (mode, instance) (rate(nodecpuseconds_total{mode!='idle'}[2m]))) * 100"           legendFormat: "CPU Usage"
- title: "Memory Usage in Percent over Time"       type: "timeseries"       targets:         - expr: "(1 - (nodememoryMemAvailablebytes / nodememoryMemTotalbytes)) * 100"
- title: "CPU Usage in Percent over Time"       type: "timeseries"       targets:         - expr: "sum by (instance, job) (avg by (mode, instance) (rate(nodecpuseconds_total{mode!='idle'}[2m])))"
Becomes this dashboard:
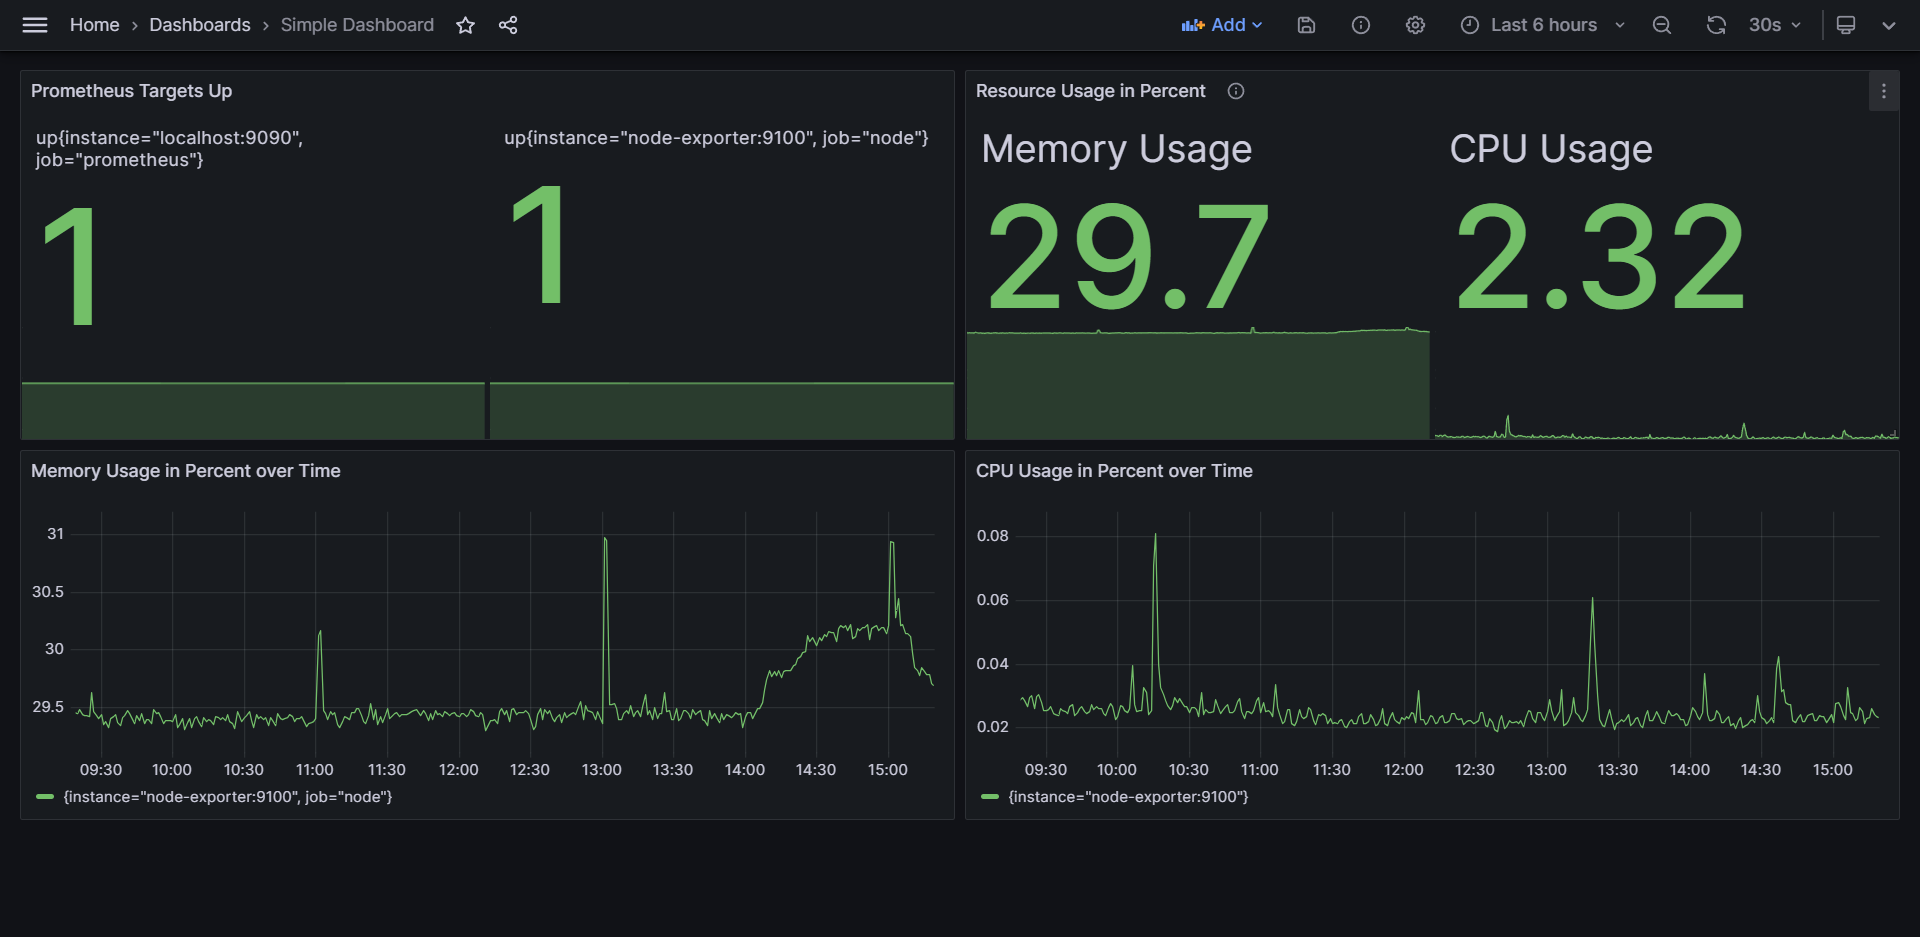
Features
Dashboards from YAML: Instead of using the Grafana UI or writing complex JSON models, you can write simplified YAML files from which the dashboard JSON is generated. This allows better version control and code reviews.
Automatic panel positioning: Grafana doesn't support relative positioning. When trying to write your dashboard as JSON, you need to set and keep track of the position of every panel yourself. grafaml arranges panels based on their definition order in a grid with a flexible number of columns.
Kubernetes-ready: grafaml is a Helm Chart. Grafana dashboards can be deployed as ConfigMaps, which can optionally be discovered by the [Grafana Sidecar Container][1].
Limitations
Variable Positioning of Panels: Panels are arranged in a grid based on their definition order. Due to this, it is not possible to have panels with variable width or positioning.
Getting started
Creating the dashboard YAML
First we need to create a Helm Values file containing the definition of our dashboard. We'll call the file values-my-dashboard.yaml. It will define a very simple dashboard with only 2 panels:
dashboardBase:
  title: "Simple Dashboard"
panels:   columns: 2   panelHeight: 8   list:     - title: "Prometheus Targets Up"       type: "stat"       targets:         - expr: "up"
- title: "Resource Usage in Percent"       description: "Memory and CPU Usage"       type: "stat"       targets:         - expr: "(1 - (nodememoryMemAvailablebytes / nodememoryMemTotalbytes)) * 100"           legendFormat: "Memory Usage"         - expr: "sum by (instance, job)(avg by (mode, instance) (rate(nodecpuseconds_total{mode!='idle'}[2m]))) * 100"           legendFormat: "CPU Usage"
You can find all possible configuration options in the default values.yaml. Be aware that thevalues-my-dashboard.yaml will be merged with the default values.yaml.
You can find example dashboards in the example-dashboards directory.
Generating the dashboard JSON
This step is optional if you want to deploy the dashboard in a Kubernetes Cluster.
Execute the following to create a dashboard.json:
helm template my-dashboard oci://ghcr.io/ernail/charts/grafaml --values ./values-my-dashboard.yaml --set onlyRenderDashboardJson=true | tail -n +3 > dashboard.jsonDeploying the dashboard in Kubernetes
Execute the following in your shell to deploy the dashboard as a ConfigMap in Kubernetes:
helm upgrade my-dashboard oci://registry-1.docker.io/ernail/grafaml --install --create-namespace --namespace my-namespace --values ./values-my-dashboard.yamlIf you are using the [Grafana Sidecar Container][1], the dashboard should now be available in your Grafana instance.
Advanced Usage
Grafana JSON Model Compatibility
grafaml generates standard Grafana JSON dashboards, which means you can use almost any feature that Grafana supports. The dashboardBase field of the values file accepts any field compatible with the Grafana JSON Dashboard model, with only two exceptions:
uid: This is generated automatically, or can be set via the fielduidin the values file.panels: These are configured and automatically positioned via the fieldpanelsin the values.
- Custom time ranges and refresh intervals
- Dashboard variables and templating
- Annotations and alerts
- Custom styling and themes
- Dashboard tags and metadata
row panels will interfere with the positioning logic.
All items in panels.list are treated as regular panels and positioned in the grid sequence.
Using Helmfile
Helmfile is a declarative spec for deploying Helm Charts. It can be used to simplify the commands for rendering and deploying the dashboards.
If you want to use Helmfile, here is an example helmfile.yaml:
repositories:
  - name: "ernail"
    url: "registry-1.docker.io/ernail"
    oci: true
releases:   - name: "my-dashboard"     namespace: "my-namespace"     chart: "ernail/grafaml"     version: "1.0.0"     values:       - "./values-my-dashboard.yaml"       - onlyRenderDashboardJson: false
Execute the following to create a dashboard.json:
helmfile template --file ./helmfile.yaml --set onlyRenderDashboardJson=true | tail -n +3 > dashboard.jsonExecute this code in your shell to deploy the dashboard as ConfigMap in Kubernetes:
helmfile apply --file ./helmfile.yamlDevelopment
Install Dependencies
You can install all required dependencies via Task and Homebrew
brew install go-task
task install
If you'd like to use other tools, you can find all dependencies and relevant commands in the taskfile.yaml.
Rendering the Helm Chart
task renderTesting the Helm Chart
task testRunning linters
task lintGenerating documentation
task docs[1]: https://github.com/grafana/helm-charts/blob/main/charts/grafana/README.md#sidecar-for-dashboards


