
Vue.js component for Apache ECharts™.

Vue ECharts
Vue.js component for Apache ECharts™.




Still using Vue 2? Read v7 docs here →
Installation & usage
npm
npm install echarts vue-echartsExample
<template>
  <VChart class="chart" :option="option" />
</template>

<style scoped> .chart {   height: 400px; } </style>
On-demand importing 
To keep your bundle size small, we recommend manually importing the components and charts you need from ECharts. To make this easier, we’ve created an import code generator. Simply paste your option code into the tool, and it will generate the exact import statements for you.
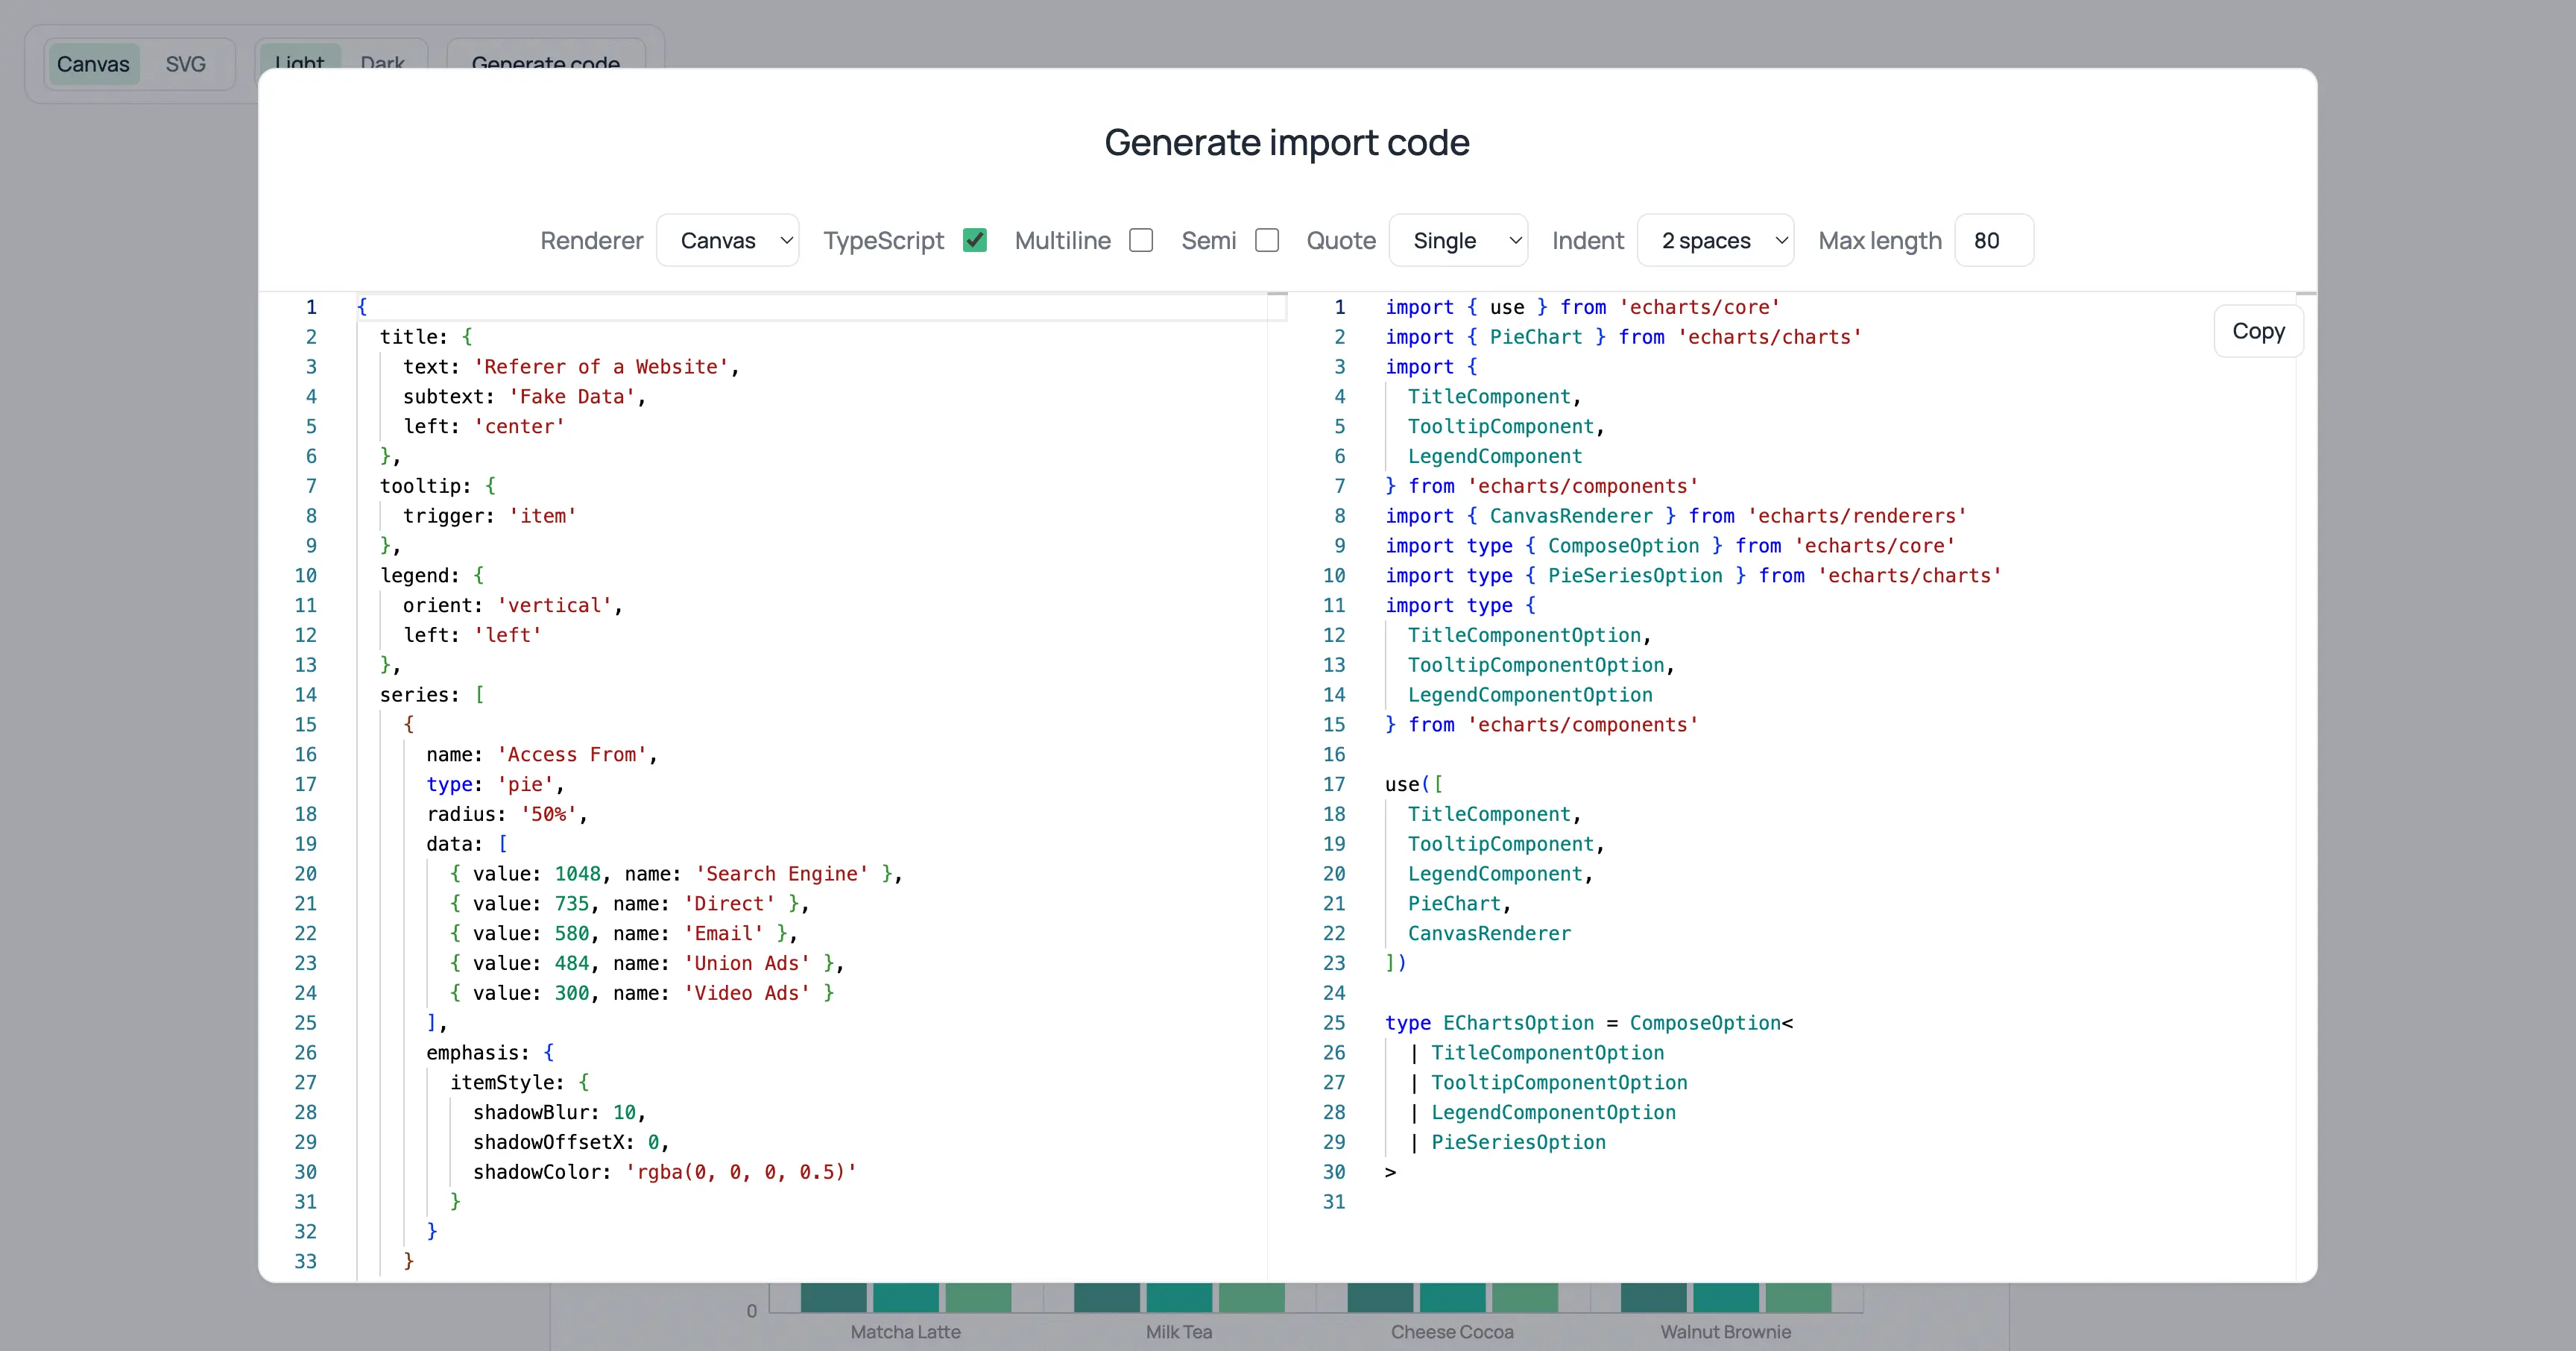
But if you really want to import the whole ECharts bundle without having to import modules manually, just add this in your code:
import "echarts";CDN
Drop
<pre><code class="lang-"><!-- scripts:end --></code></pre>js const app = Vue.createApp(...)
// register globally (or you can do it locally) app.component('VChart', VueECharts) <pre><code class="lang-"></details>
See more examples here.
Props
- init-options: object
's opts parameter here →
Injection key:
INITOPTIONSKEY.
theme: string | object
Theme to be applied. See echarts.init's theme parameter here →
Injection key:
THEME_KEY.
option: object
ECharts' universal interface. Modifying this prop triggers Vue ECharts to compute an update plan and call setOption. Read more here →
#### Smart update - If you supply
update-options (via prop or injection), Vue ECharts forwards it directly to setOption and skips the planner. - Manual setOption calls (only available when manual-update is true) behave like native ECharts, honouring only the per-call override you pass in and are not carried across re-initializations. - Otherwise, Vue ECharts analyses the change: removed objects become null, removed arrays become [] with replaceMerge, ID/anonymous deletions trigger replaceMerge, and risky changes fall back to notMerge: true.
update-options: object
Options for updating chart option. If supplied (or injected), Vue ECharts forwards it directly to setOption, skipping the smart update. See echartsInstance.setOption's opts parameter here →
Injection key:
UPDATEOPTIONSKEY.
group: string
Group name to be used in chart connection. See echartsInstance.group here →
autoresize: boolean | { throttle?: number, onResize?: () => void } (default: false)
Whether the chart should be resized automatically whenever its root is resized. Use the options object to specify a custom throttle delay (in milliseconds) and/or an extra resize callback function.
loading: boolean (default: false)
Whether the chart is in loading state.
loading-options: object
Configuration item of loading animation. See echartsInstance.showLoading's opts parameter here →
Injection key:
LOADINGOPTIONSKEY.
manual-update: boolean (default: false)
Handy for performance-sensitive charts (large or high-frequency updates). When set to true, Vue only uses the option prop for the initial render; later prop changes do nothing and you must drive updates via setOption on a template ref. If the chart re-initializes (for example due to init-options changes, flipping manual-update, or a remount), the manual state is discarded and the chart is rendered again from the current option value.
Events
You can bind events with Vue's
v-on directive.</code></pre>vue <template> <VChart :option="option" @highlight="handleHighlight" /> </template> <pre><code class="lang-">> [!NOTE] > Only the .once event modifier is supported as other modifiers are tightly coupled with the DOM event system.
Vue ECharts support the following events:
highlight →
downplay →
selectchanged →
legendselectchanged →
legendselected →
legendunselected →
legendselectall →
legendinverseselect →
legendscroll →
datazoom →
datarangeselected →
timelinechanged →
timelineplaychanged →
restore →
dataviewchanged →
magictypechanged →
geoselectchanged →
geoselected →
geounselected →
axisareaselected →
brush →
brushEnd →
brushselected →
globalcursortaken →
rendered →
finished →
Mouse events
- click →
- dblclick →
- mouseover →
- mouseout →
- mousemove →
- mousedown →
- mouseup →
- globalout →
- contextmenu →
- ZRender events
- zr:click
- zr:mousedown
- zr:mouseup
- zr:mousewheel
- zr:dblclick
- zr:contextmenu
See supported events in the ECharts API reference →
Native DOM events
As Vue ECharts binds events to the ECharts instance by default, there is some caveat when using native DOM events. You need to prefix the event name with
native: to bind native DOM events.</code></pre>vue <template> <VChart @native:click="handleClick" /> </template> <pre><code class="lang-">Event handlers passed via attrs are reactive by default. Updating onClick, onZr:, or onNative: handlers will rebind them automatically.
Provide / inject
Vue ECharts provides provide/inject API for
theme, init-options, update-options and loading-options to help configuring contextual options. eg. for theme you can use the provide API like this:
<details> <summary>Composition API</summary></code></pre>js import { THEME_KEY } from "vue-echarts"; import { provide } from "vue";
provide(THEME_KEY, "dark");
// or provide a ref const theme = ref("dark"); provide(THEME_KEY, theme);
// getter is also supported provide(THEME_KEY, () => theme.value); <pre><code class="lang-"></details>
<details> <summary>Options API</summary></code></pre>js import { THEME_KEY } from 'vue-echarts' import { computed } from 'vue'
export default { { provide: { [THEME_KEY]: 'dark' } } }
// Or make injections reactive export default { data() { return { theme: 'dark' } }, provide() { return { [THEME_KEY]: computed(() => this.theme) } } } <pre><code class="lang-"></details>
Methods
setOption →
getWidth →
getHeight →
getDom →
getOption →
resize →
dispatchAction →
convertToPixel →
convertFromPixel →
containPixel →
getDataURL →
getConnectedDataURL →
clear →
dispose →
> [!NOTE]
> The following ECharts instance methods aren't exposed because their functionality is already provided by component props:
>
> - showLoading / hideLoading: use the loading and loading-options props instead.
> - setTheme: use the theme prop instead.
Slots
Vue ECharts supports three slot categories:
tooltip.formatter.
Callback slots for toolbox.feature.dataView.optionToContent.
Optional #graphic slot (enabled by importing vue-echarts/graphic) for building option.graphic declaratively with G* components.
Callback slot naming convention (
tooltip / dataView)
These naming rules apply to callback slots only. The graphic slot name is always
#graphic.
- Slot names begin with
tooltip/dataView, followed by hyphen-separated path segments to the target.
Each segment corresponds to an option property name or an array index (for arrays, use the numeric index).
The constructed slot name maps directly to the nested callback it overrides.
Example mappings:
tooltip → option.tooltip.formatter
tooltip-baseOption → option.baseOption.tooltip.formatter
tooltip-xAxis-1 → option.xAxis[1].tooltip.formatter
tooltip-series-2-data-4 → option.series[2].data[4].tooltip.formatter
dataView → option.toolbox.feature.dataView.optionToContent
dataView-media-1-option → option.media[1].option.toolbox.feature.dataView.optionToContent
The slot props correspond to the first parameter of the callback function.
<details> <summary>Usage</summary></code></pre>vue <template> <VChart :option="chartOptions"> <!-- Global
tooltip.formatter --> <template #tooltip="params"> <div v-for="(param, i) in params" :key="i"> <span v-html="param.marker" /> <span>{{ param.seriesName }}</span> <span>{{ param.value[0] }}</span> </div> </template>
<!-- Tooltip on xAxis --> <template #tooltip-xAxis="params"> <div>X-Axis : {{ params.value }}</div> </template>
<!-- Data View Content --> <template #dataView="option"> <table> <thead> <tr> <th v-for="(t, i) in option.dataset[0].source[0]" :key="i"> {{ t }} </th> </tr> </thead> <tbody> <tr v-for="(row, i) in option.dataset[0].source.slice(1)" :key="i"> <th>{{ row[0] }}</th> <td v-for="(v, i) in row.slice(1)" :key="i">{{ v }}</td> </tr> </tbody> </table> </template> </VChart> </template> <pre><code class="lang-">Example →
</details>
> [!NOTE] > Slots take precedence over the corresponding callback defined in
props.option.
Graphic slot&nbsp;<sup><a href="#slots"><img src="https://img.shields.io/badge/new-A855F7" alt="new" align="middle" height="16"></a></sup></code></pre>ts
import { GGroup, GRect, GText } from "vue-echarts/graphic";
<pre><code class="lang-">Available components:
GGroup
GRect
GCircle
GText
GLine
GPolyline
GPolygon
GImage
GSector
GRing
GArc
GBezierCurve
GCompoundPath
Read more at ECharts option.graphic →
> [!NOTE] > > - Graphic element events additionally support
dblclick and contextmenu. > - Event listeners support the .once modifier. > - #graphic overrides option.graphic. In manual-update mode, call chartRef.setOption(...) to apply changes.
<details> <summary>Usage</summary></code></pre>vue
<template> <VChart :option="option"> <template #graphic> <GGroup id="drag-handle" :x="overlay.x" :y="overlay.y"> <GRect :width="88" :height="28" :r="6" fill="#5470c6" draggable @drag="onDrag" /> <GText :x="10" :y="8" :text="
x: ${Math.round(overlay.x)} y: ${Math.round(overlay.y)}" text-fill="#fff" /> </GGroup> </template> </VChart> </template> <pre><code class="lang-"></details>
Static methods
echarts itself.
CSP:
style-src or style-src-elem
If you are both enforcing a strict CSP that prevents inline
<style> injection and targeting browsers that don't support the CSSStyleSheet() constructor, you need to manually include vue-echarts/style.css.
Migration to v8
> [!NOTE] > Please make sure to read the upgrade guide for ECharts 6 as well.
The following breaking changes are introduced in
vue-echarts@8:
vue-echarts@7.
class support. If you need to support legacy browsers, you must transpile the code to ES5 yourself.
- CSP entry point removed: The entry point
vue-echarts/csp is removed. Use vue-echarts instead. You only need to manually include vue-echarts/style.css if you are both enforcing a strict CSP that prevents inline <style> injection and targeting browsers that don't support the CSSStyleSheet() constructor.
Local development</code></pre>sh
pnpm i
pnpm dev
`
Open
http://localhost:5173 to see the demo.
tests/TESTING.md`.
Notice
The Apache Software Foundation Apache ECharts, ECharts, Apache, the Apache feather, and the Apache ECharts project logo are either registered trademarks or trademarks of the Apache Software Foundation.


