
Debugging tool for Kubernetes which tests and displays connectivity between nodes in the cluster.
Goldpinger


Goldpinger makes calls between its instances to monitor your networking. It runs as a DaemonSet on Kubernetes and produces Prometheus metrics that can be scraped, visualised and alerted on.
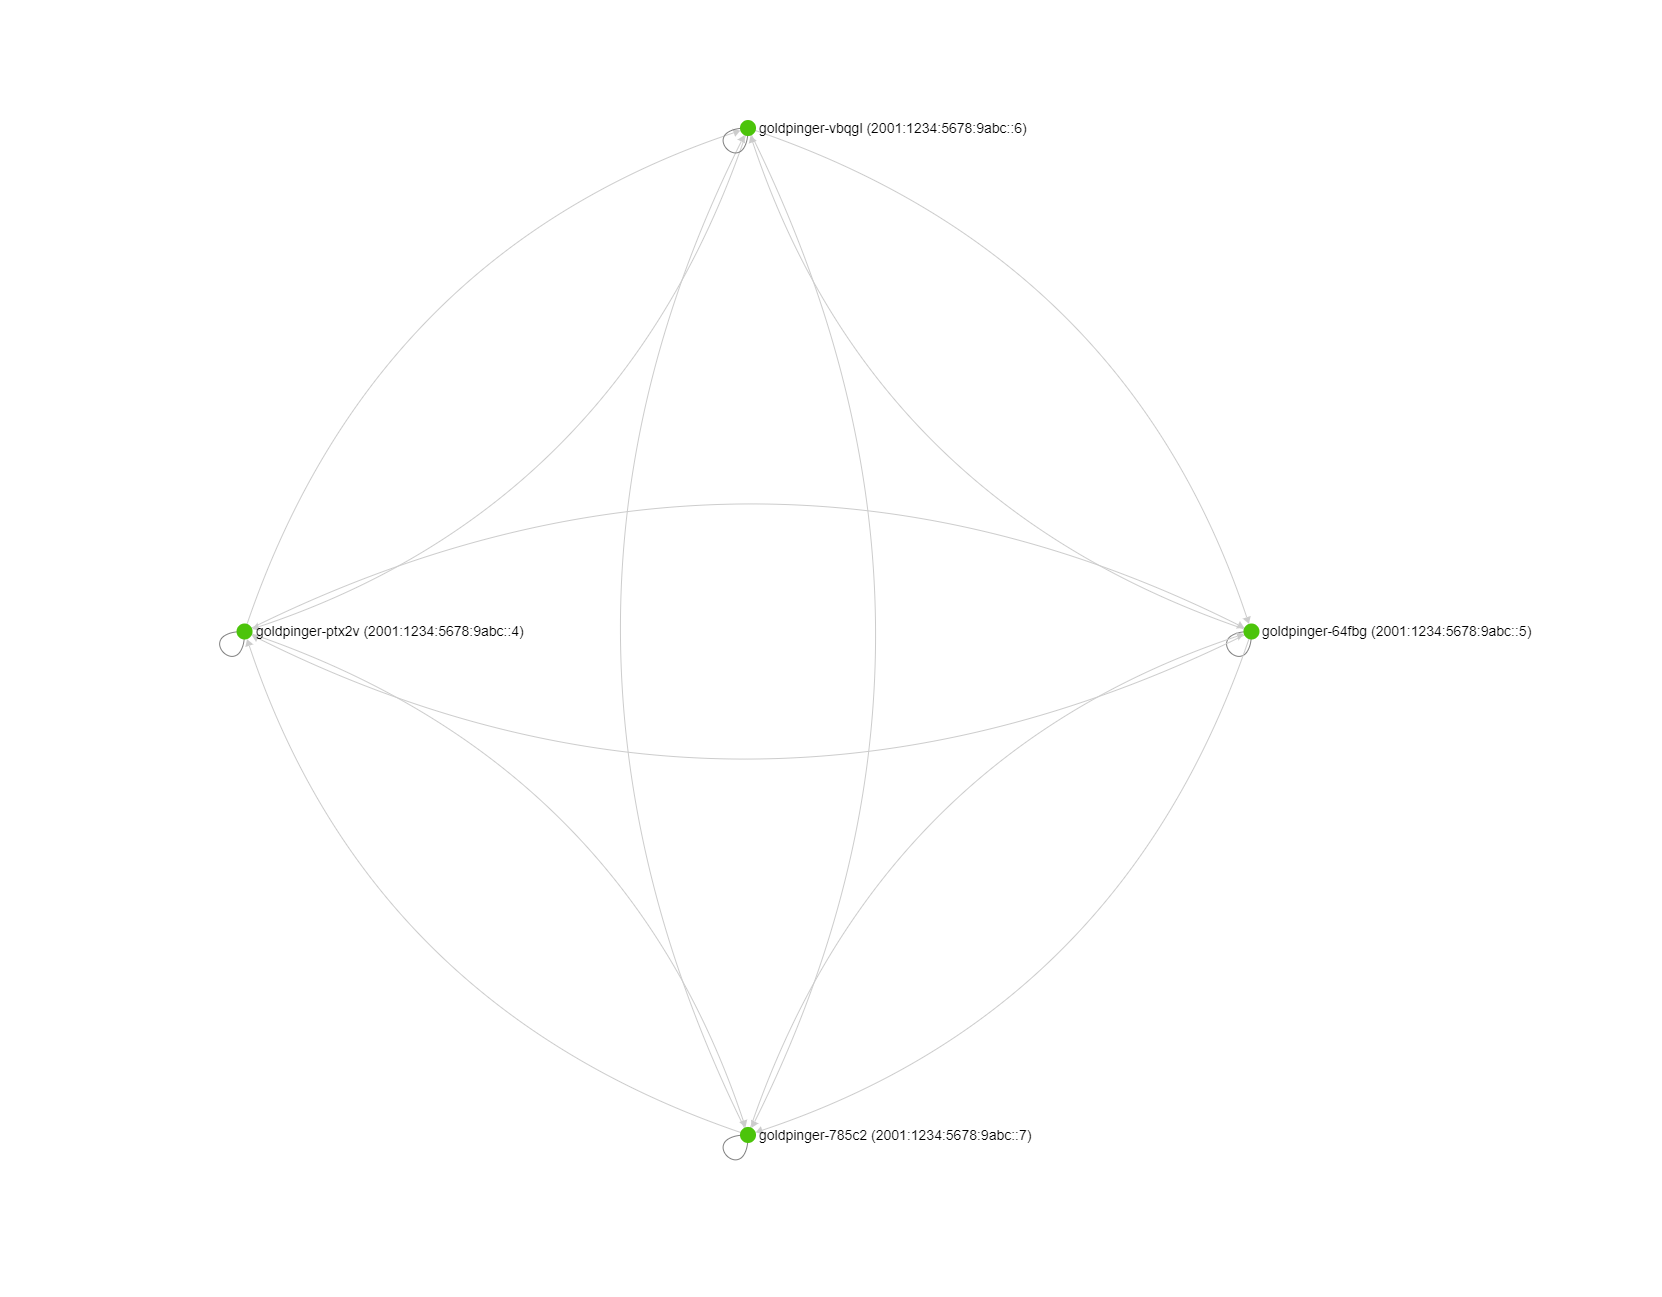
Oh, and it gives you the graph below for your cluster. Check out the video explainer.

:tada: 1M+ pulls from docker hub!
On the menu
- On the menu - Rationale - Quick start - Building - Compiling using a multi-stage Dockerfile - Compiling locally - Installation - Authentication with Kubernetes API - Example YAML - Note on DNS - UDP probe for packet loss, hop count, and RTT - Usage - UI - API - Prometheus - Grafana - Alert Manager - Chaos Engineering - Authors - Contributions - LicenseRationale
We built Goldpinger to troubleshoot, visualise and alert on our networking layer while adopting Kubernetes at Bloomberg. It has since become the go-to tool to see connectivity and slowness issues.
It's small (~16MB), simple and you'll wonder why you hadn't had it before.
If you'd like to know more, you can watch our presentation at Kubecon 2018 Seattle.
Quick start
Getting from sources:
go get github.com/bloomberg/goldpinger/cmd/goldpinger
goldpinger --help
Getting from docker hub:
# get from docker hub
docker pull bloomberg/goldpinger:v3.0.0
Building
The repo comes with two ways of building a docker image: compiling locally, and compiling using a multi-stage Dockerfile image. :warning: Depending on your docker setup, you might need to prepend the commands below with sudo.
Compiling using a multi-stage Dockerfile
You will need docker version 17.05+ installed to support multi-stage builds.
# Build a local container without publishing
make build
Build & push the image somewhere
namespace="docker.io/myhandle/" make build-release
This was contributed via @michiel - kudos !
Compiling locally
In order to build Goldpinger, you are going to need go version 1.15+ and docker.
Building from source code consists of compiling the binary and building a Docker image:
# step 0: check out the code
git clone https://github.com/bloomberg/goldpinger.git
cd goldpinger
step 1: compile the binary for the desired architecture
make bin/goldpinger
at this stage you should be able to run the binary
./bin/goldpinger --help
step 2: build the docker image containing the binary
namespace="docker.io/myhandle/" make build
step 3: push the image somewhere
docker push $(namespace="docker.io/myhandle/" make version)
Installation
Goldpinger works by asking Kubernetes for pods with particular labels (app=goldpinger). While you can deploy Goldpinger in a variety of ways, it works very nicely as a DaemonSet out of the box.
Helm Installation
Goldpinger can be installed via Helm using the following:helm repo add goldpinger https://bloomberg.github.io/goldpinger
helm repo update
helm install goldpinger goldpinger/goldpingerManual Installation
Goldpinger can be installed manually via configuration similar to the following:
Authentication with Kubernetes API
Goldpinger supports using a kubeconfig (specify with --kubeconfig-path) or service accounts.
Example YAML
Here's an example of what you can do (using the in-cluster authentication to Kubernetes apiserver).
---
apiVersion: v1
kind: ServiceAccount
metadata:
  name: goldpinger-serviceaccount
  namespace: default

apiVersion: apps/v1
kind: DaemonSet
metadata:
  name: goldpinger
  namespace: default
  labels:
    app: goldpinger
spec:
  updateStrategy:
    type: RollingUpdate
  selector:
    matchLabels:
      app: goldpinger
  template:
    metadata:
      annotations:
        prometheus.io/scrape: 'true'
        prometheus.io/port: '8080'
      labels:
        app: goldpinger
    spec:
      serviceAccount: goldpinger-serviceaccount
      tolerations:
        - key: node-role.kubernetes.io/master
          effect: NoSchedule
      securityContext:
        runAsNonRoot: true
        runAsUser: 1000
        fsGroup: 2000
      containers:
        - name: goldpinger
          env:
            - name: HOST
              value: "0.0.0.0"
            - name: PORT
              value: "8080"
            # injecting real hostname will make for easier to understand graphs/metrics
            - name: HOSTNAME
              valueFrom:
                fieldRef:
                  fieldPath: spec.nodeName
            # podIP is used to select a randomized subset of nodes to ping.
            - name: POD_IP
              valueFrom:
                fieldRef:
                  fieldPath: status.podIP
          image: "docker.io/bloomberg/goldpinger:v3.0.0"
          imagePullPolicy: Always
          securityContext:
            allowPrivilegeEscalation: false
            readOnlyRootFilesystem: true
          resources:
            limits:
              memory: 80Mi
            requests:
              cpu: 1m
              memory: 40Mi
          ports:
            - containerPort: 8080
              name: http
          readinessProbe:
            httpGet:
              path: /healthz
              port: 8080
            initialDelaySeconds: 20
            periodSeconds: 5
          livenessProbe:
            httpGet:
              path: /healthz
              port: 8080
            initialDelaySeconds: 20
            periodSeconds: 5

apiVersion: v1
kind: Service
metadata:
  name: goldpinger
  namespace: default
  labels:
    app: goldpinger
spec:
  type: NodePort
  ports:
    - port: 8080
      nodePort: 30080
      name: http
  selector:
    app: goldpinger
Note, that you will also need to add an RBAC rule to allow Goldpinger to list other pods. If you're just playing around, you can consider a view-all default rule:
---
apiVersion: rbac.authorization.k8s.io/v1
kind: ClusterRoleBinding
metadata:
  name: default
roleRef:
  apiGroup: rbac.authorization.k8s.io
  kind: ClusterRole
  name: view
subjects:
  - kind: ServiceAccount
    name: goldpinger-serviceaccount
    namespace: default
You can also see an example of using kubeconfig in the ./extras.
Using with IPv4/IPv6 dual-stack
If your cluster IPv4/IPv6 dual-stack and you want to force IPv6, you can set the IP_VERSIONS environment variable to "6" (default is "4") which will use the IPv6 address on the pod and host.
Note on DNS
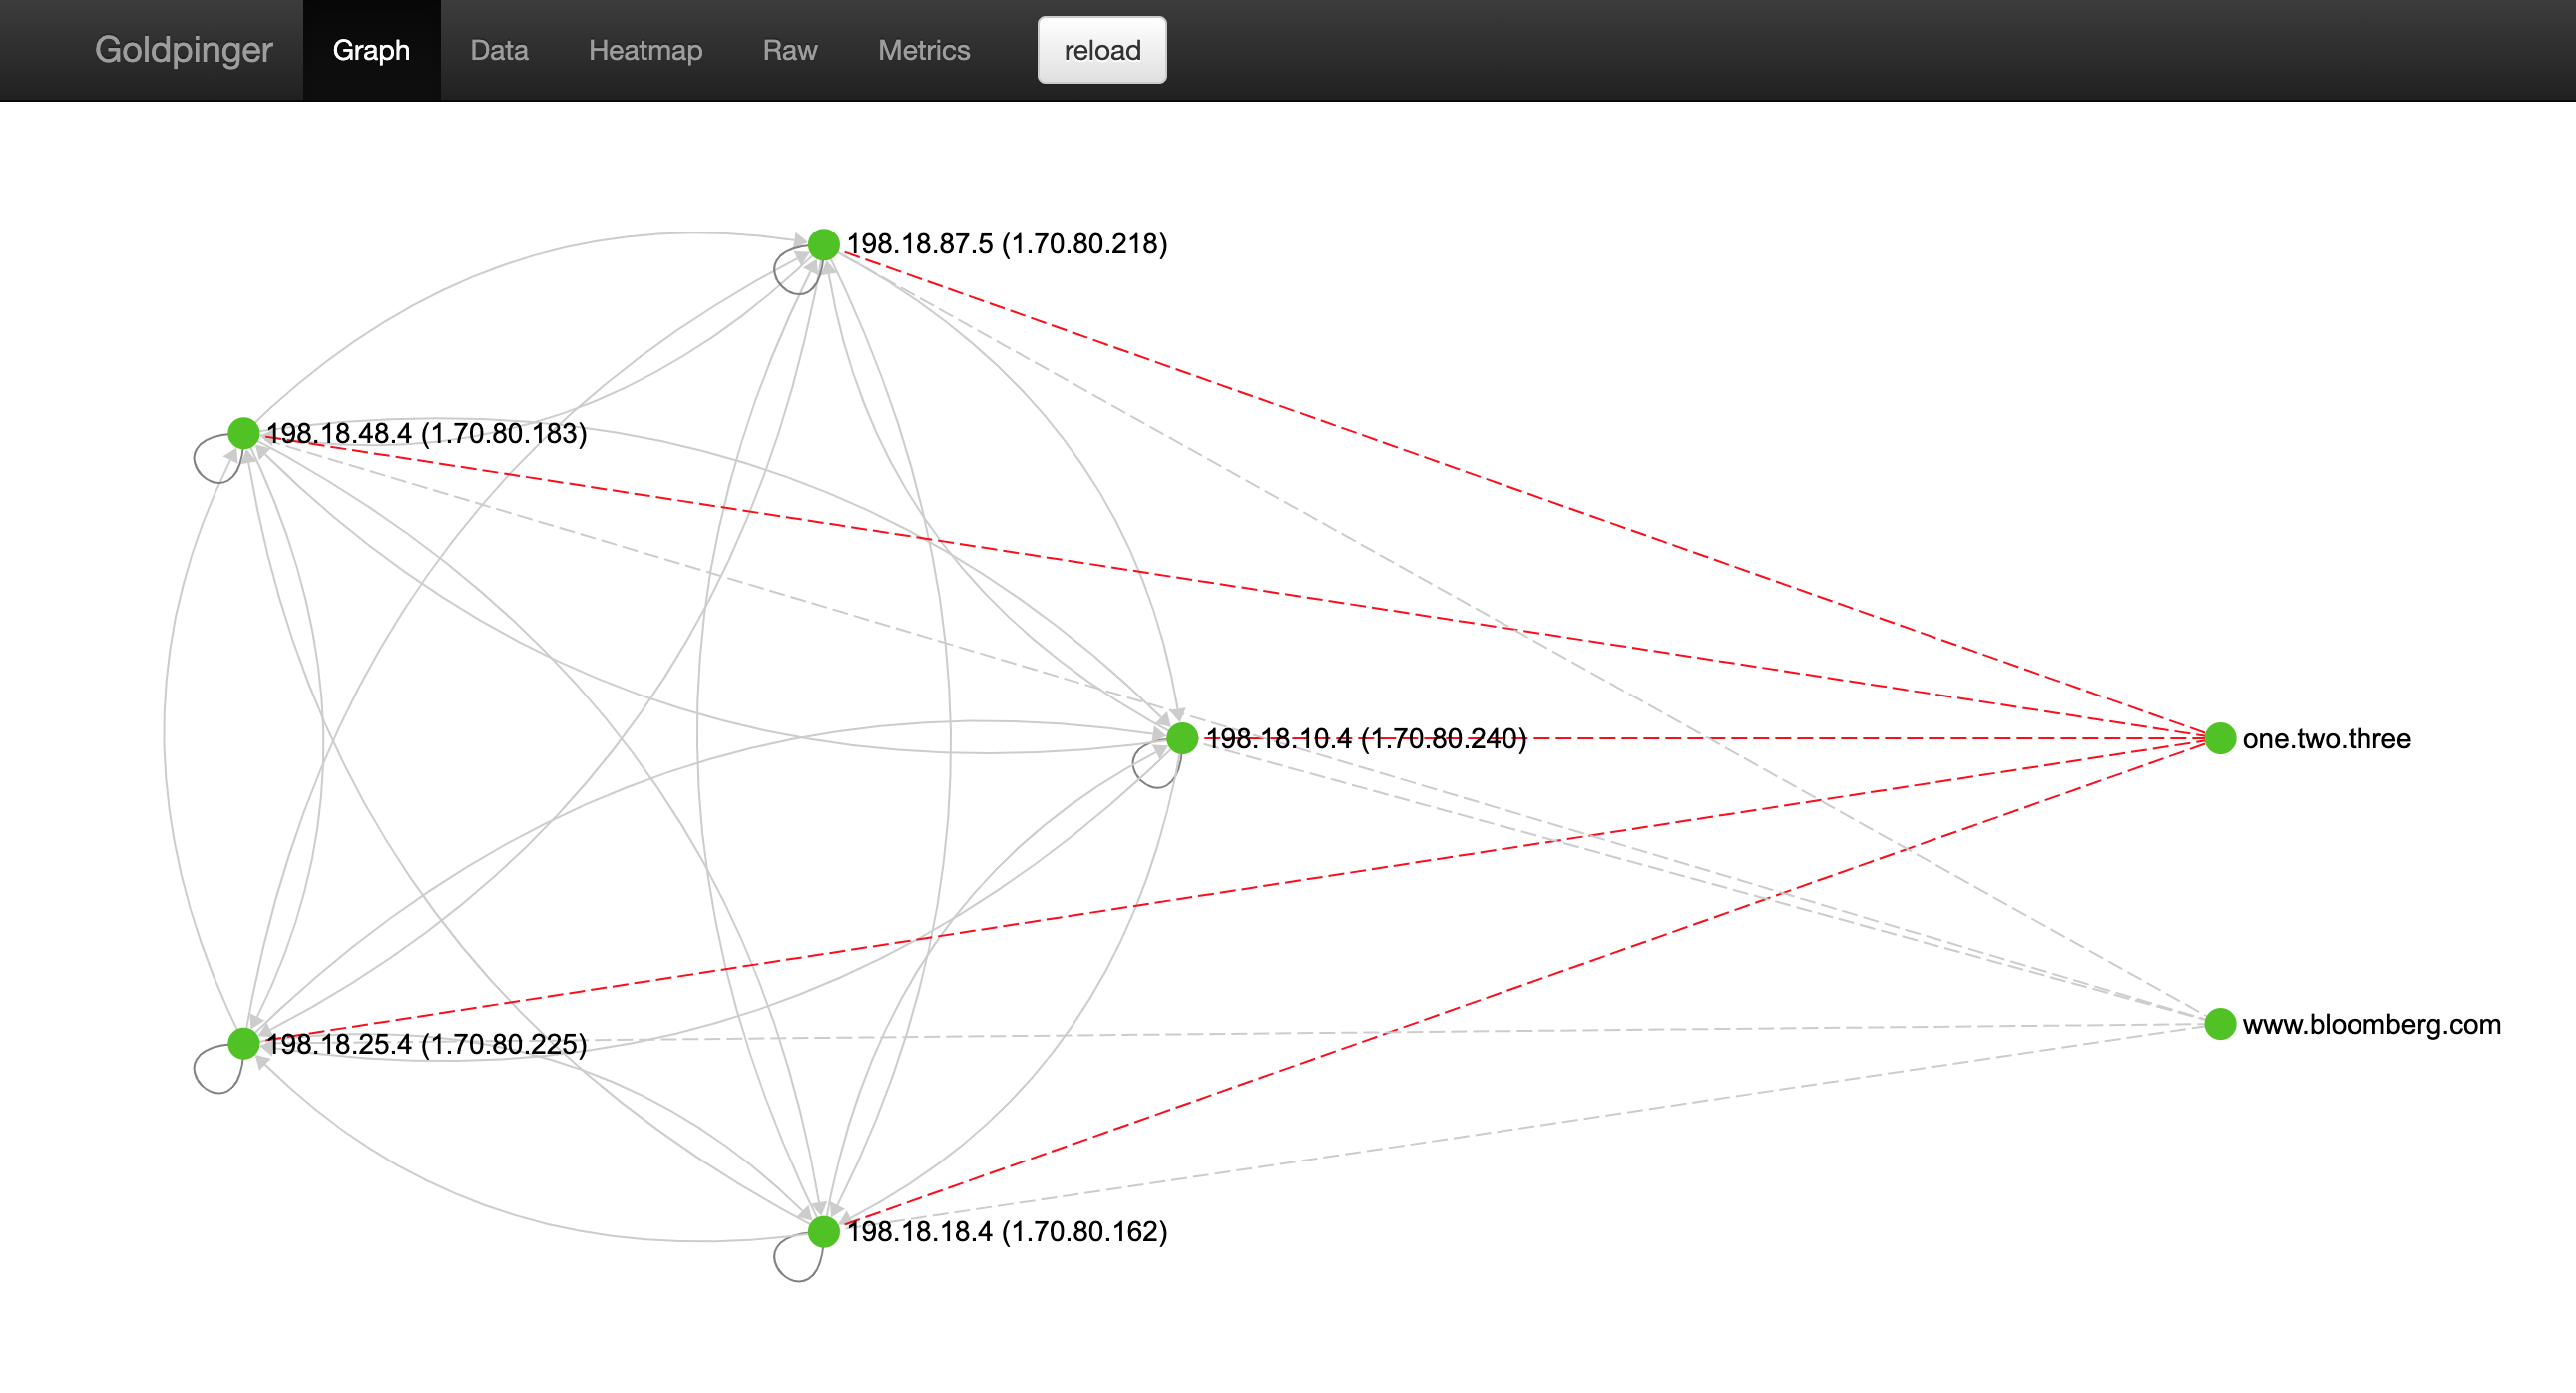
Note, that on top of resolving the other pods, all instances can also try to resolve arbitrary DNS. This allows you to test your DNS setup.
From --help:
--host-to-resolve= A host to attempt dns resolve on (space delimited) [$HOSTSTORESOLVE]So in order to test two domains, we could add an extra env var to the example above:
- name: HOSTSTORESOLVE
              value: "www.bloomberg.com one.two.three"
and goldpinger should show something like this:
TCP and HTTP checks to external targets
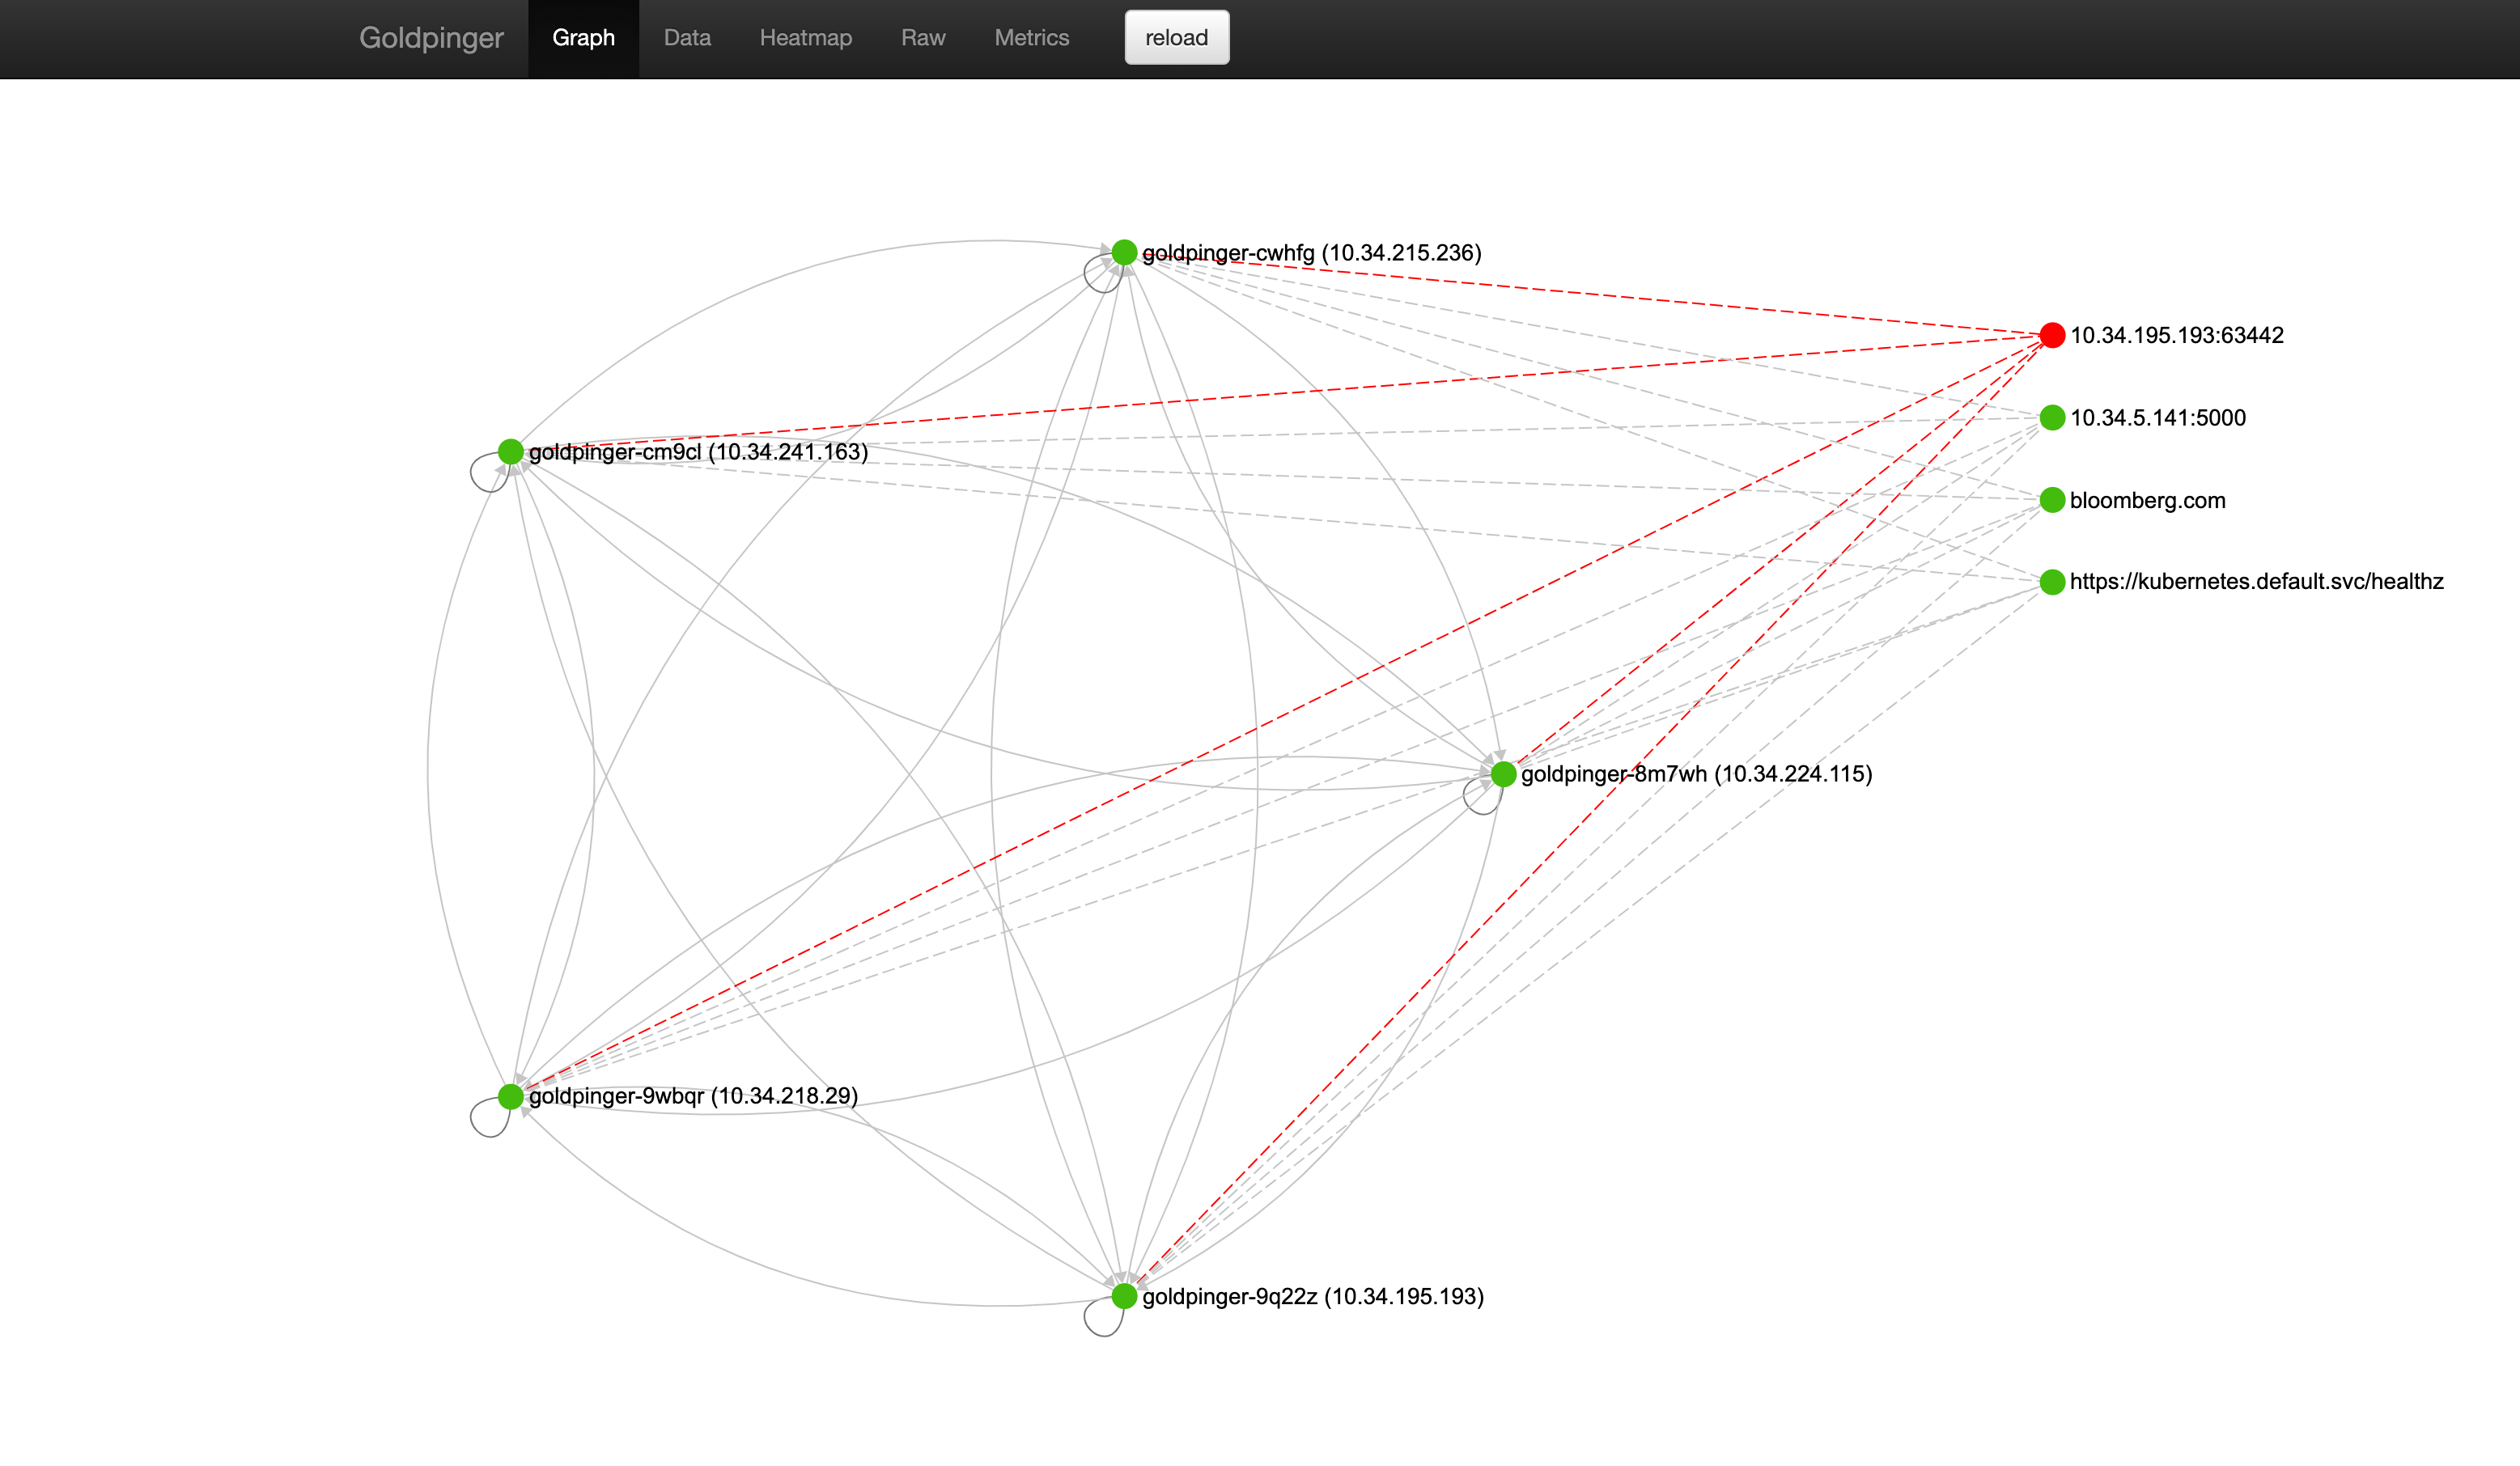
Instances can also be configured to do simple TCP or HTTP checks on external targets. This is useful for visualizing more nuanced connectivity flows.
--tcp-targets=             A list of external targets(<host>:<port> or <ip>:<port>) to attempt a TCP check on (space delimited) [$TCP_TARGETS]
      --http-targets=            A  list of external targets(<http or https>://<url>) to attempt an HTTP{S} check on. A 200 HTTP code is considered successful. (space delimited) [$HTTP_TARGETS]
      --tcp-targets-timeout=  The timeout for a tcp check on the provided tcp-targets (default: 500) [$TCPTARGETSTIMEOUT]
      --dns-targets-timeout=  The timeout for a tcp check on the provided udp-targets (default: 500) [$DNSTARGETSTIMEOUT]
- name: HTTP_TARGETS
value: http://bloomberg.com
- name: TCP_TARGETS
value: 10.34.5.141:5000 10.34.195.193:6442the timeouts for the TCP, DNS and HTTP checks can be configured via TCPTARGETSTIMEOUT, DNSTARGETSTIMEOUT and HTTPTARGETSTIMEOUT respectively.
UDP probe for packet loss, hop count, and RTT
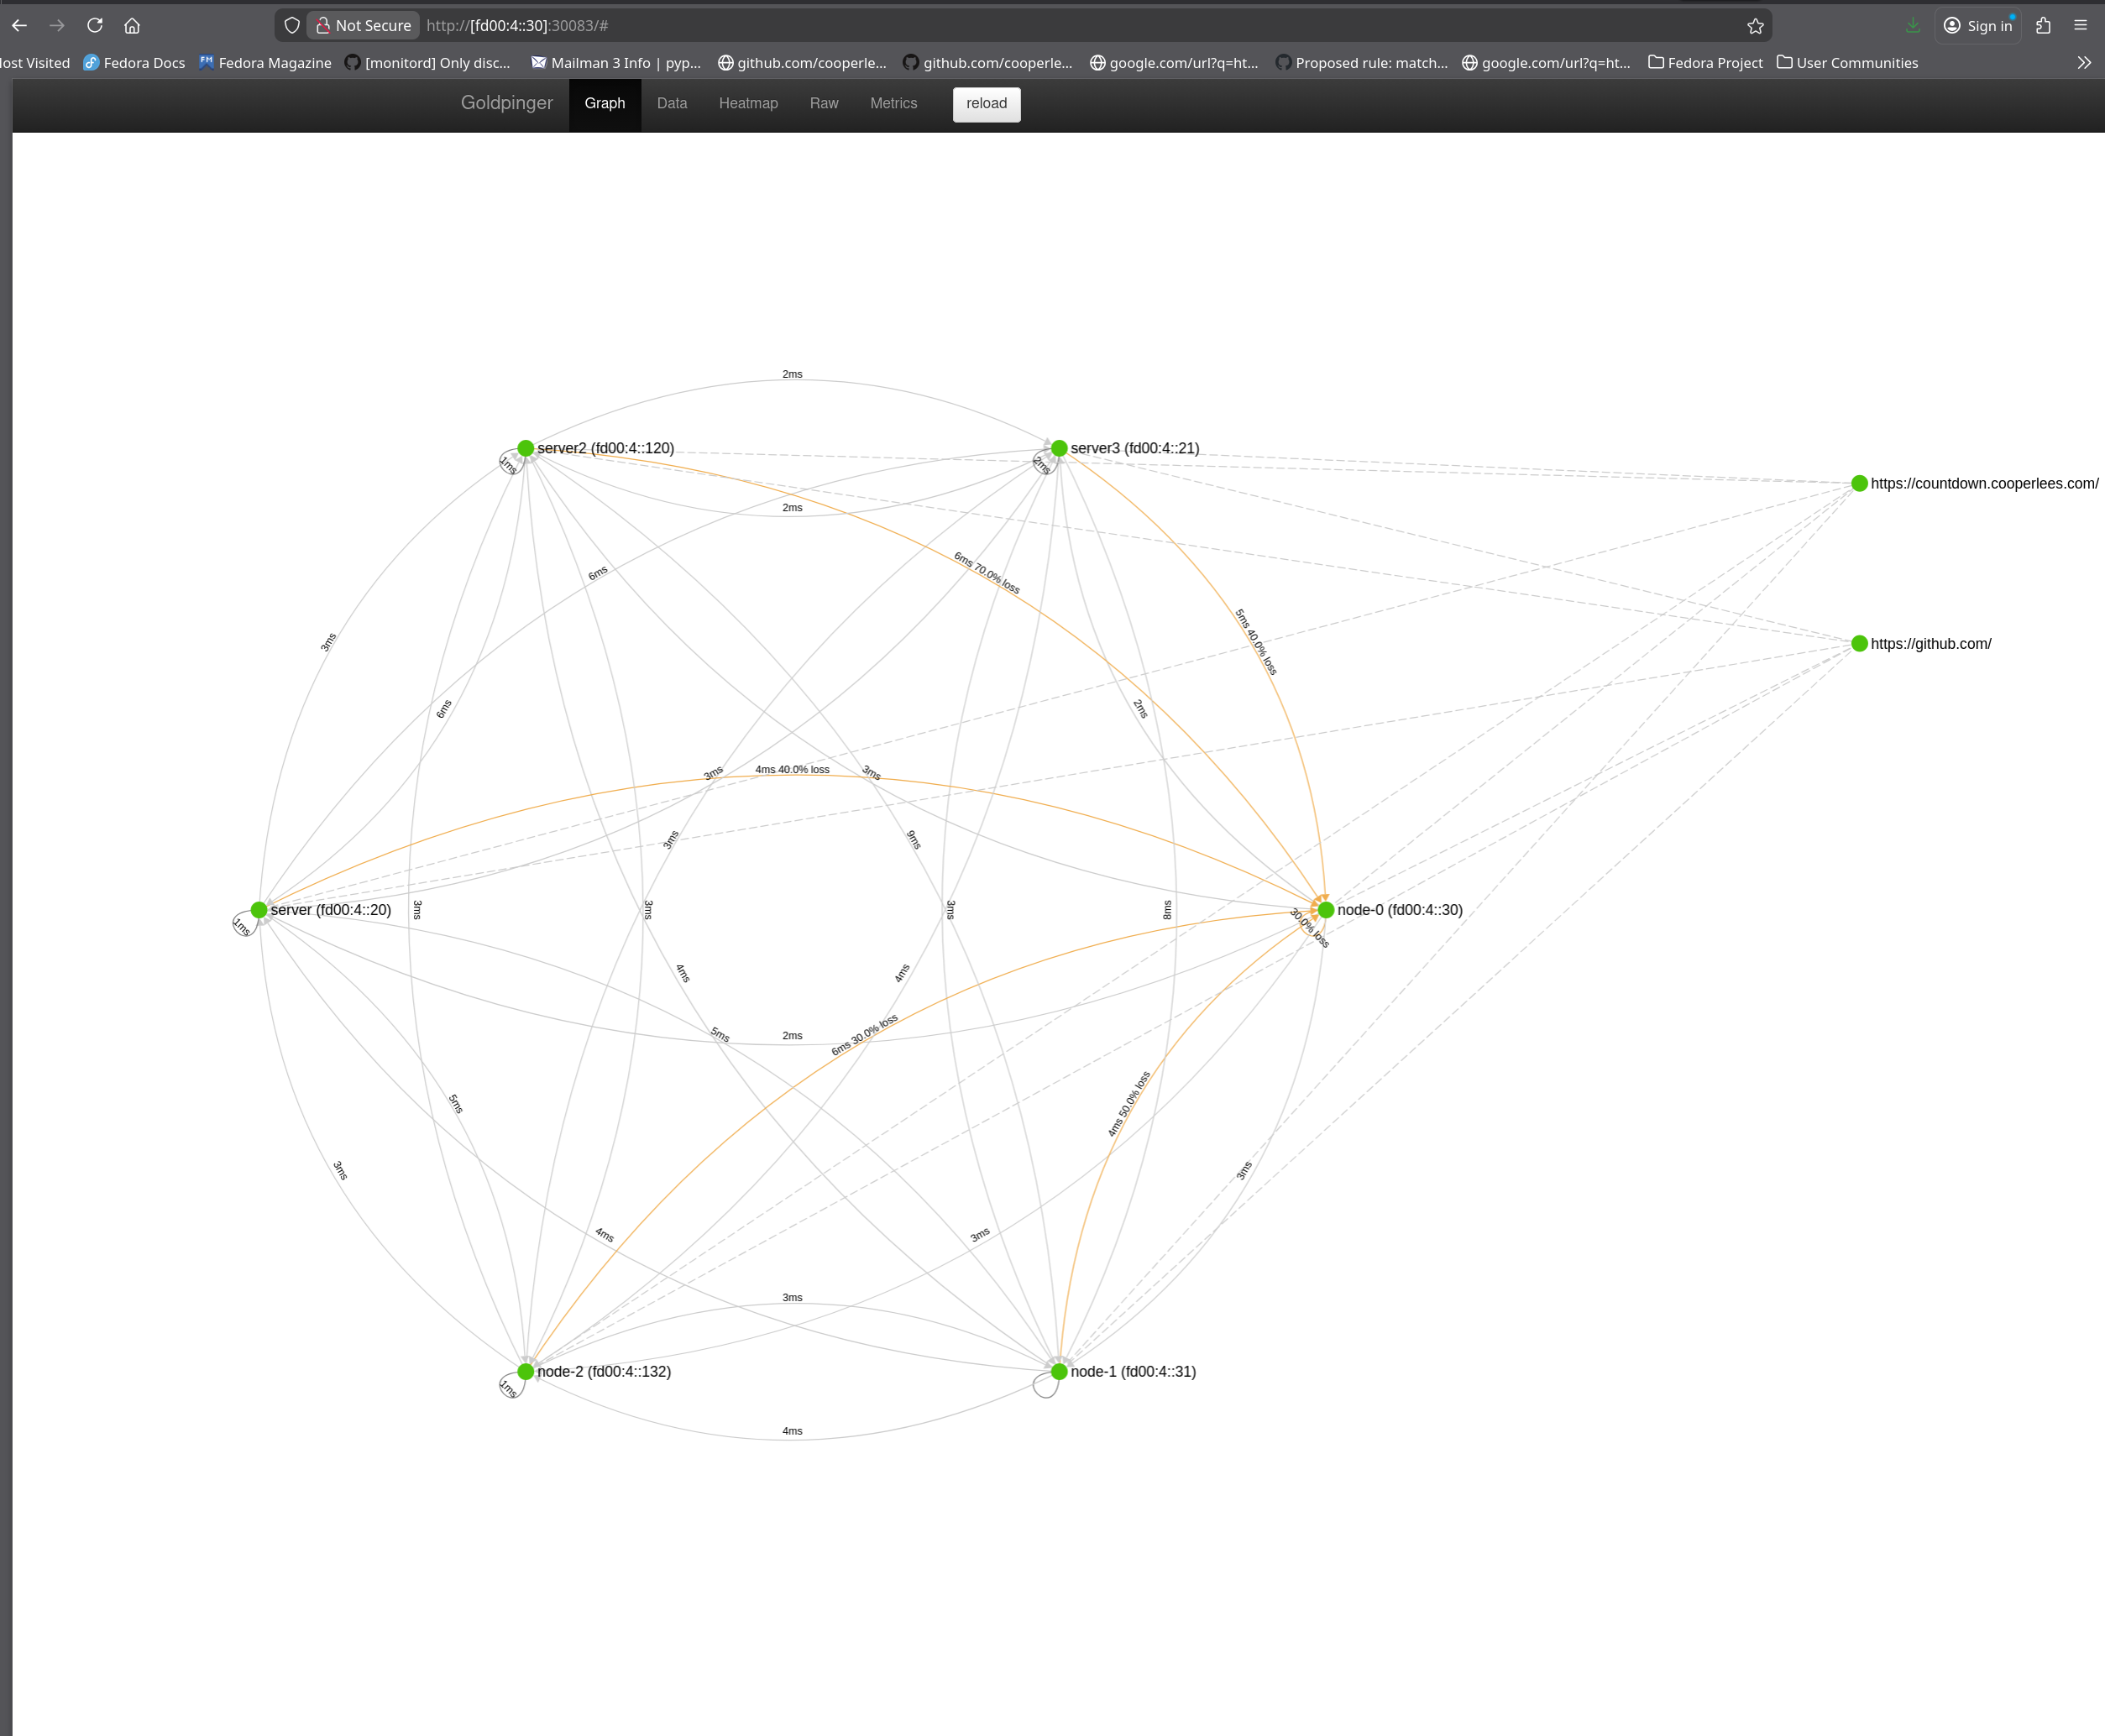
In natively routed Kubernetes environments (e.g. Cilium, Calico in BGP mode), the existing HTTP ping can mask network issues: TCP retransmits hide packet loss, and HTTP latency includes the 3-way handshake, TLS, and application overhead. The UDP probe gives you visibility into the actual network layer.
When enabled, each goldpinger pod runs a UDP echo listener. During each ping cycle, the prober sends a configurable number of sequenced UDP packets to each peer; the peer echoes them back. From the replies, goldpinger computes:
- Packet loss — percentage of packets that were not returned, surfacing degraded links before they impact applications
- Hop count — estimated from the IPv4 TTL or IPv6 HopLimit on received replies, useful for detecting asymmetric routing or unexpected topology changes
- UDP RTT — average round-trip time with sub-millisecond precision, isolating network latency from TCP/HTTP overhead
UDP_ENABLED=true        # enable UDP probing and echo listener
UDP_PORT=6969           # listener port (default: 6969)
UDPPACKETCOUNT=10     # packets per probe (default: 10)
UDPPACKETSIZE=64      # bytes per packet (default: 64)
UDP_TIMEOUT=1s          # probe timeout (default: 1s)
Or via the Helm chart:
goldpinger:
  udp:
    enabled: true
    port: 6969
This adds three Prometheus metrics:
goldpingerpeersloss_pct          # gauge: UDP packet loss percentage (0-100)
goldpingerpeershop_count         # gauge: estimated hop count
goldpingerpeersudprtts         # histogram: UDP round-trip time in seconds
goldpingerudperrors_total        # counter: UDP probe errors
goldpingerudpduplicates_total    # counter: duplicate UDP reply packets
goldpingerudpoutoforder_total  # counter: out-of-order UDP reply packets
Links with partial loss are shown as yellow edges in the graph UI, and edge labels display the UDP RTT instead of HTTP latency when available.
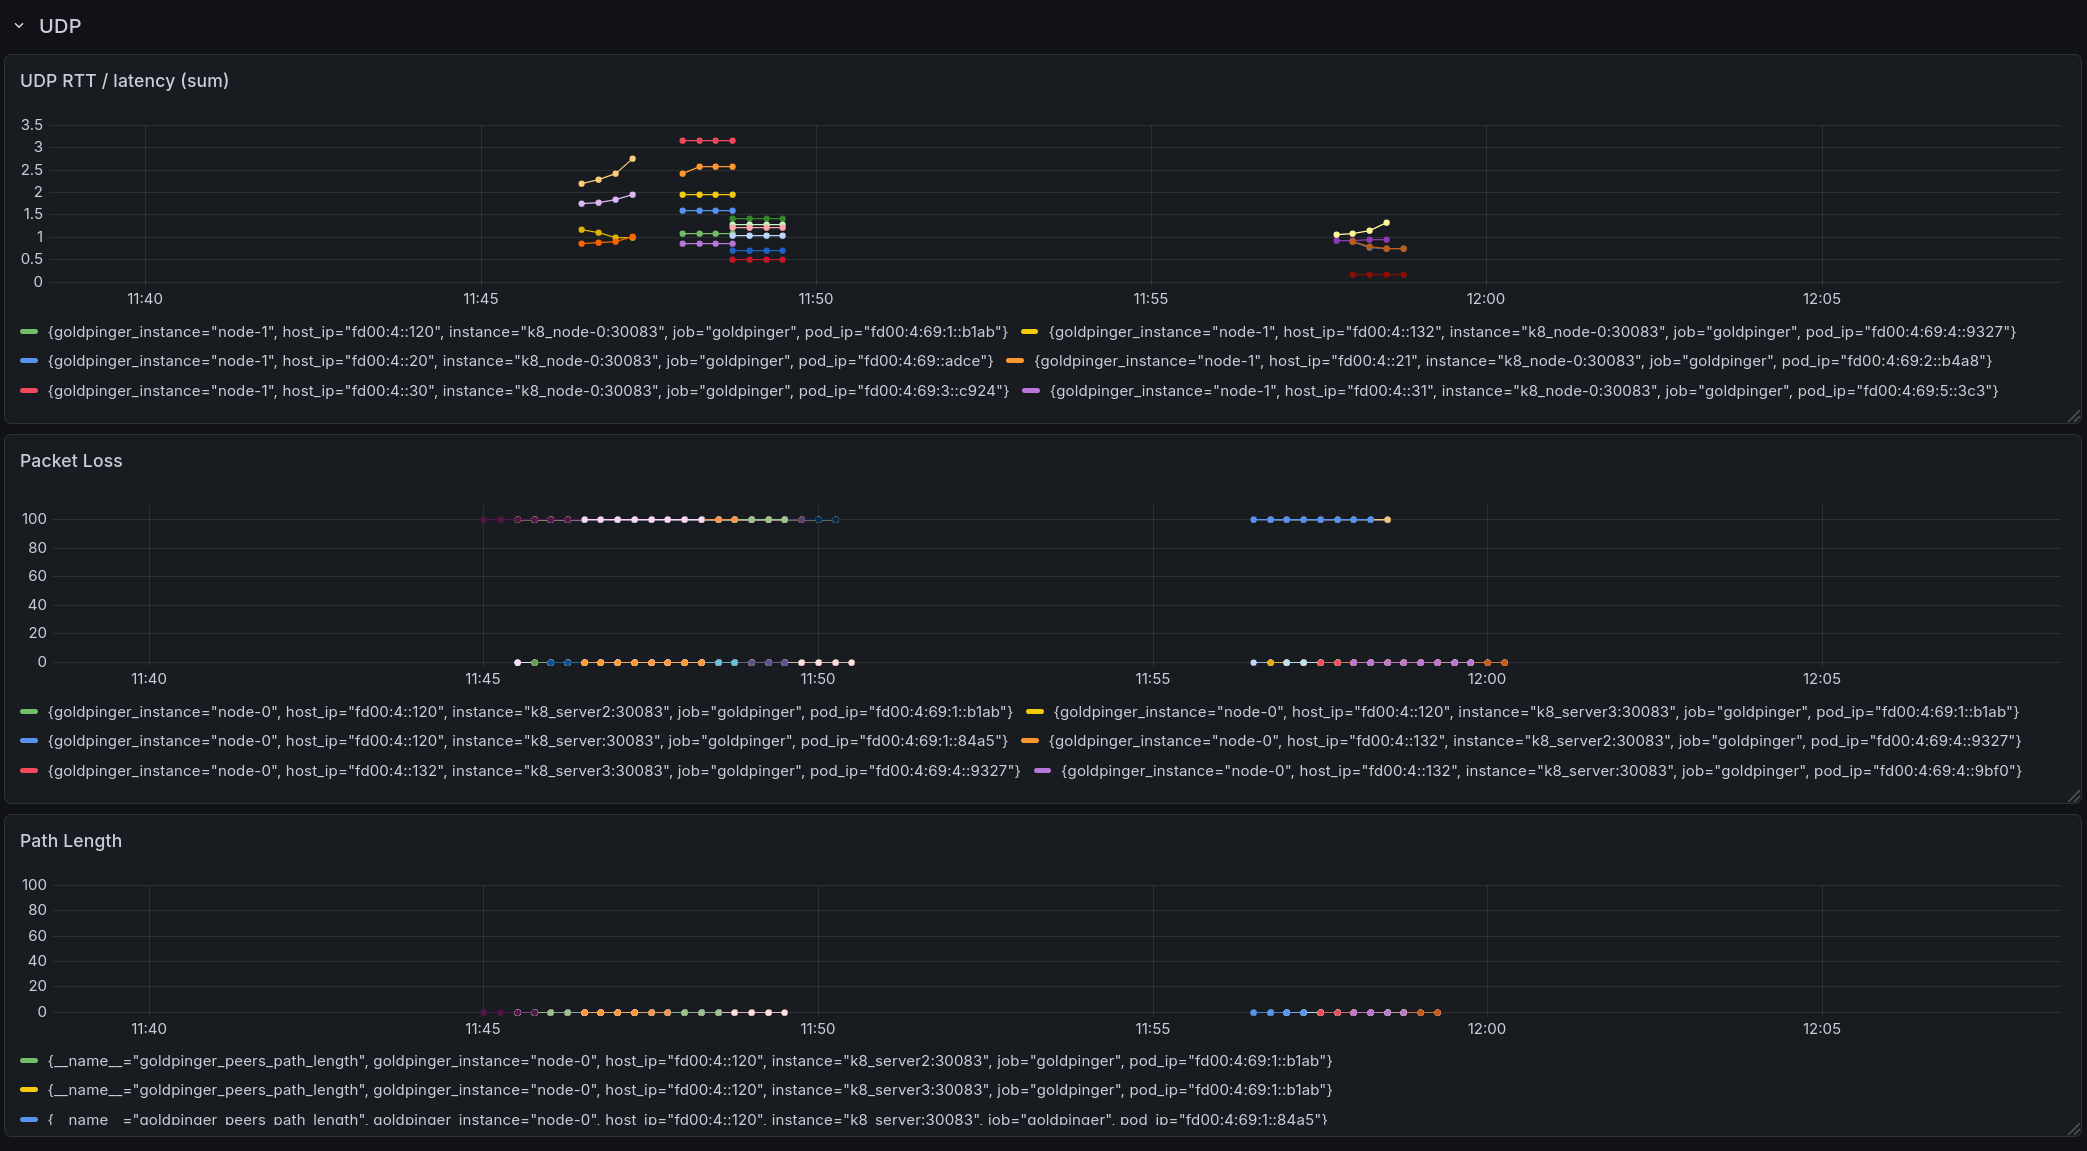
No new dependencies are required (golang.org/x/net is already in go.mod), and no additional container capabilities are needed.
Usage
UI
Once you have it running, you can hit any of the nodes (port 30080 in the example above) and see the UI.

You can click on various nodes to gray out the clutter and see more information.
API
The API exposed is via a well-defined Swagger spec.
The spec is used to generate both the server and the client of Goldpinger. If you make changes, you can re-generate them using go-swagger via make swagger
Prometheus
Once running, Goldpinger exposes Prometheus metrics at /metrics. All the metrics are prefixed with goldpinger_ for easy identification.
You can see the metrics by doing a curl http://$POD_ID:80/metrics.
These are probably the droids you are looking for:
goldpingerpeersresponsetimes_*
goldpingernodeshealth_total
goldpingerstatstotal
goldpingererrorstotal
goldpingerpeersloss_pct           # (UDP probe, when enabled)
goldpingerpeershop_count          # (UDP probe, when enabled)
goldpingerpeersudprtts_*        # (UDP probe, when enabled)
goldpingerudpduplicates_total     # (UDP probe, when enabled)
goldpingerudpoutoforder_total   # (UDP probe, when enabled)
Grafana
You can find an example of a Grafana dashboard that shows what's going on in your cluster in extras. This should get you started, and once you're on the roll, why not :heart: contribute some kickass dashboards for others to use ?
Alert Manager
Once you've gotten your metrics into Prometheus, you have all you need to set useful alerts.
To get you started, here's a rule that will trigger an alert if there are any nodes reported as unhealthy by any instance of Goldpinger.
alert: goldpingernodesunhealthy
expr: sum(goldpingernodeshealth_total{status="unhealthy"})
  BY (instance, goldpinger_instance) > 0
for: 5m
annotations:
  description: |
    Goldpinger instance {{ $labels.goldpinger_instance }} has been reporting unhealthy nodes for at least 5 minutes.
  summary: Instance {{ $labels.instance }} down
Similarly, why not :heart: contribute some amazing alerts for others to use ?
Chaos Engineering
Goldpinger also makes for a pretty good monitoring tool in when practicing Chaos Engineering. Check out PowerfulSeal, if you'd like to do some Chaos Engineering for Kubernetes.
Authors
Goldpinger was created by Mikolaj Pawlikowski and ported to Go by Chris Green.
Contributions
We :heart: contributions.
Have you had a good experience with Goldpinger ? Why not share some love and contribute code, dashboards and alerts ?
If you're thinking of making some code changes, please be aware that most of the code is auto-generated from the Swagger spec. The spec is used to generate both the server and the client of Goldpinger. If you make changes, you can re-generate them using go-swagger via make swagger.
Before you create that PR, please make sure you read CONTRIBUTING and DCO.
License
Please read the LICENSE file here.
For each version built by travis, there is also an additional version, appended with -vendor, which contains all source code of the dependencies used in goldpinger.


