
Algorithmic trading utilizing Heikin-Ashi candlestick plotting
Heikin-Ashi Candle Trading
By April Ye & Connor Anderson - Algorithmic Trading TeamAll trades and graphs below were made in Python
Introduction
Algorithmic Trading: executing trade orders using automated pre-programmed trading instructions accounting for variables such as time, price, and volume. There are 2 main types of trading strategies: Mean Reversion and Momentum. We used a momentum strategy.Our strategy: we relied on Heikin-Ashi candles to calculate indicator date, which we then ran through our momentum trading strategy to determine whether or not to buy or sell. Our momentum strategy relied on Heikin-Ashi candles as well, using the 3 days before an indicator date to determine the current direction of the market.
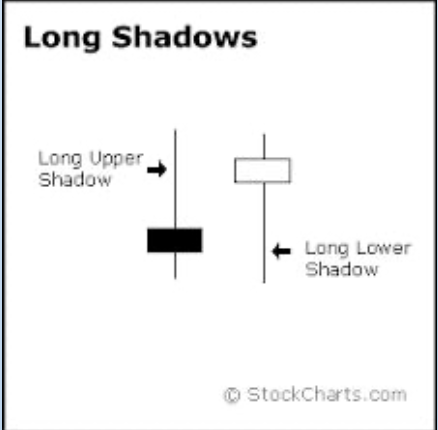
Example Buy & Sell Patterns (Based on CVS stock):

Objectives
Our goal was to create a momentum trading strategy that performed positively on 4 chosen stocks:- CVS
- Tesla
- Walmart
After determining indicator dates, we looked at the previous 3 days' worth of candles to determine if a clear shift in momentum could be concluded. This entailed looking for 3 negative days prior for a buy indicator, and 3 positive days prior for a sell indicator.
We created a visual of indicator dates on our Heikin-Ashi Plot (fig 1), then compared the Heikin-Ashi Plot to a regular candlestick plot (fig 2).
Figure 1: Heikin-Ashi Plot 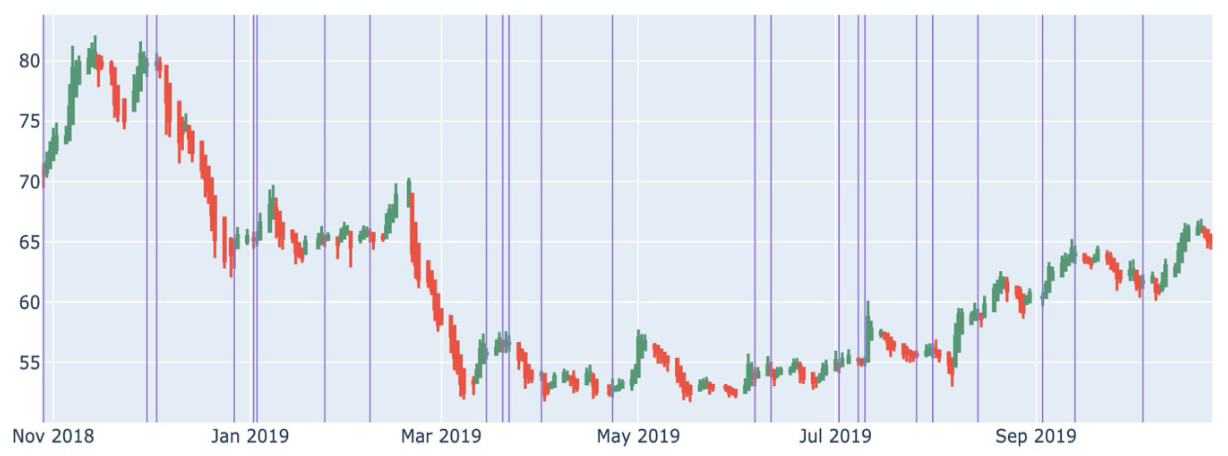
Figure 2: Regular Candlestick Plot 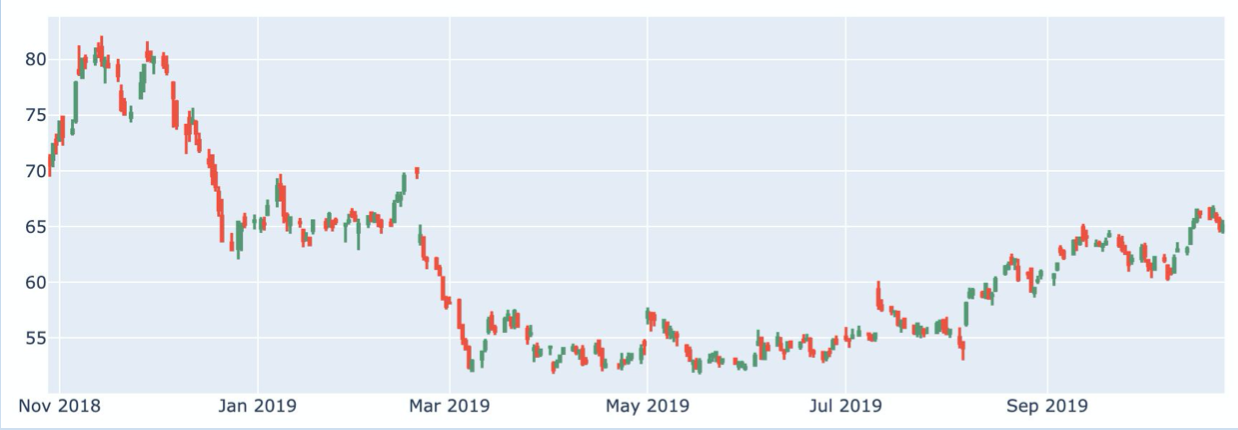
Results
While trading with $1,000,000 and no stock broker fees, simulating how our algorithm would have performed this past year, our results were as follows:- CVS -> 1.004%
- TSLA -> 1.021 %
- TWTR -> -0.013%
- WMT -> 1.009%

Had we traded on the Dow Jones Industrial AVerage this past year, we would have had 1.008% positive returns (trading using $100,000,000).
Conclusion
Our momentum trading strategy thrives on small gains that compound over time. Coming into this, we had the perception that we would be making lots of money with every trade. After studying this strategy for a semester, we now realize that you can't be perfect with your trading strategy. Instead, the goal is to turn a long-term positive profit margin, no matter how small that margin is.Using multiple strategies is almost a necessity. We had to combine our overarching Heikin-Ashi strategy with concepts surrounding bearish and bullish markets, and regular candlestick trading theory.
Future Objectives
Having worked on a momentum trading strategy this semester, the next logical step is for us to tackle a mean reversion trading strategy.We would also like to further explore momentum trading, possibly with a more complex algorithm with more modern theory. The Heikin-Ashi candle trading theory is not well flushed out, and was a very open-ended project. It would be interesting to tackle a more advanced strategy that has been well researched by modern-day algorithmic traders.


