
zabbix nginx pgsql grafana docker compose
Zabbix NGINX PostgreSQL + Grafana
Simplified Docker Compose configuration for running Zabbix monitoring system with Grafana dashboards
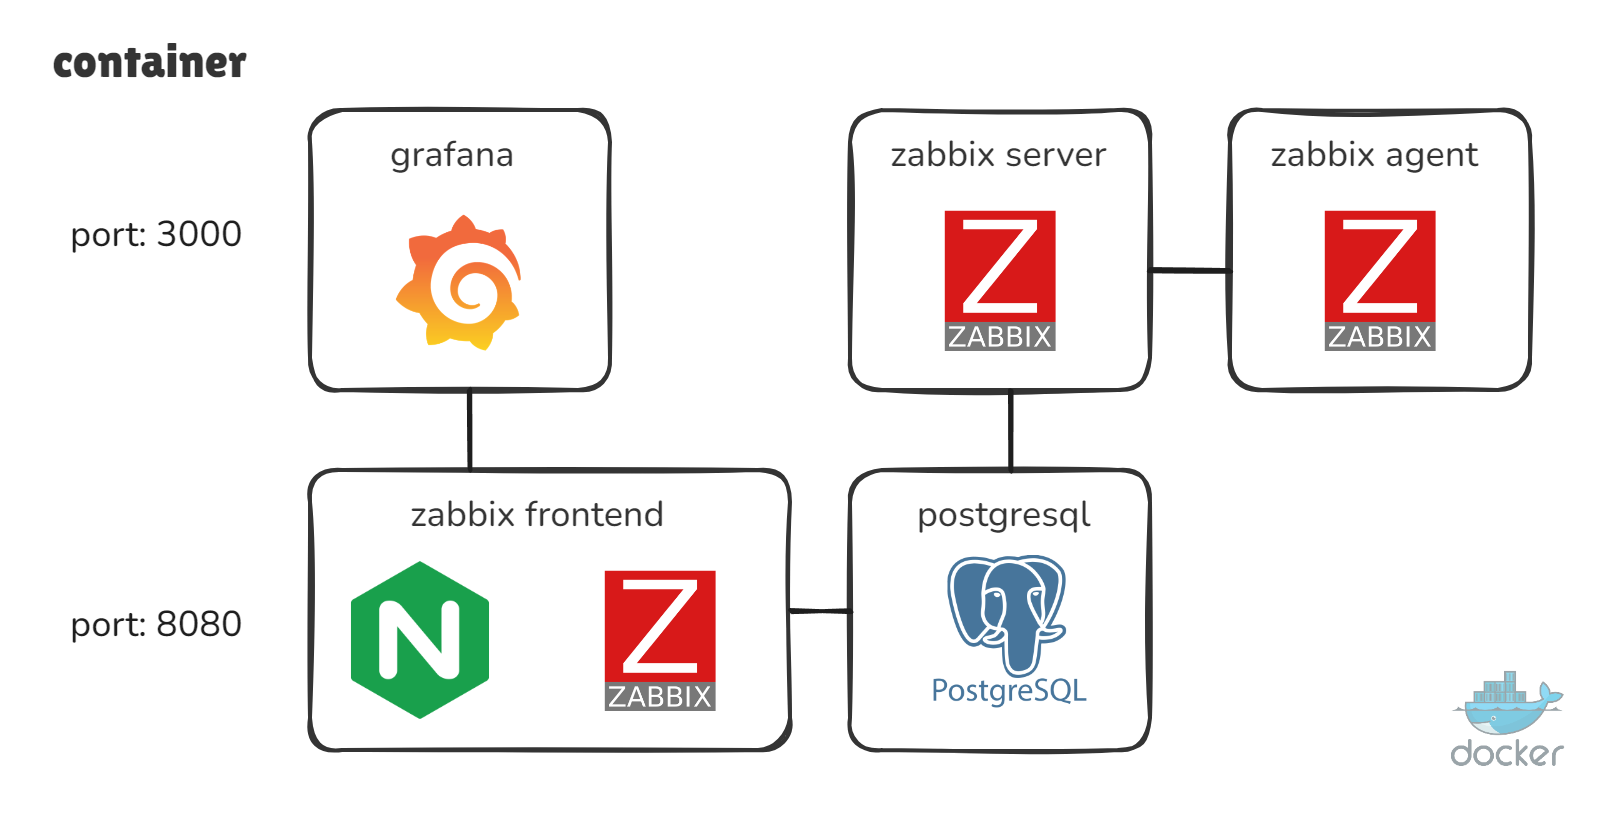
For those who are used to using zabbix to collect metrics, but want to start drawing dashboards more beautifully
Example simple docker-compose service
Current versions:
- Zabbix Server: 7.4
- PostgreSQL: 17-alpine
- Grafana: 12.1.0
Quick Start
1. Clone Repository
git clone https://github.com/akmalovaa/zabbix-docker.git
cd zabbix-docker
2. Configure Environment (Optional)
Review and modify the .env file if needed:
cp .env .env.local  # Optional: create local copy
nano .env           # Edit configuration
3. Start Services
docker compose up -d⏱️ First launch takes 1-2 minutes while PostgreSQL initializes and Zabbix server starts.
4. Verify Installation
Check if all services are running:
docker compose psConfiguration
Environment Variables
Key variables in .env file:
| Variable | Default | Description | |----------|---------|-------------| | POSTGRES_USER | zabbix | PostgreSQL username | | POSTGRES_PASSWORD | zabbix | PostgreSQL password | | POSTGRES_DB | zabbix | Database name | | GFSECURITYADMIN_USER | admin | Grafana admin username | | GFSECURITYADMIN_PASSWORD | 12345 | Grafana admin password | | TZ | Asia/Yekaterinburg | Timezone for all services |
⚠️ Security Note: Change default passwords in production!
Services & Ports
| Service | Internal Port | External Port | URL | |---------|---------------|---------------|-----| | Zabbix Frontend | 8080 | 8080 | YOURHOST:8080 | | Grafana | 3000 | 3000 | YOURHOST:3000 | | Zabbix Agent | 10050 | 10050 | (used internally) | | Zabbix Server | 10051 | 10051 | (used internally) | | PostgreSQL | 5432 | - | Default Internal only |
Usage
Zabbix Web Interface
URL: localhost:8080
Default Credentials:
- Username:
Admin - Password:
zabbix
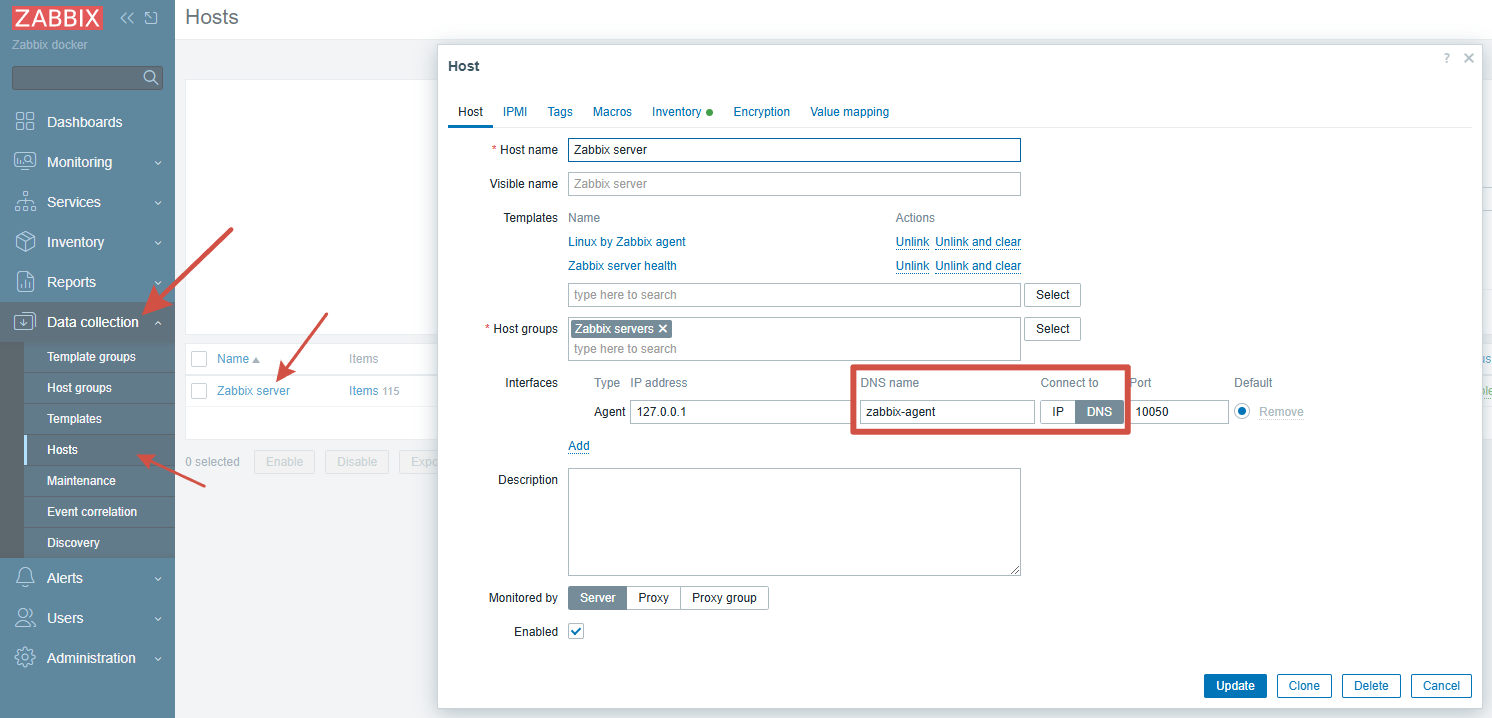
Configure Zabbix Agent Connection
- Navigate to Configuration → Hosts
- Click on Zabbix server host
- Go to Interfaces tab
- Change Connect to from IP to DNS
- Set DNS name to
zabbix-agent - Update the host

Grafana Dashboard
URL: localhost:3000
Default Credentials:
- Username:
admin - Password:
12345
💡 Anonymous access is enabled by default (see grafana/grafana.ini)
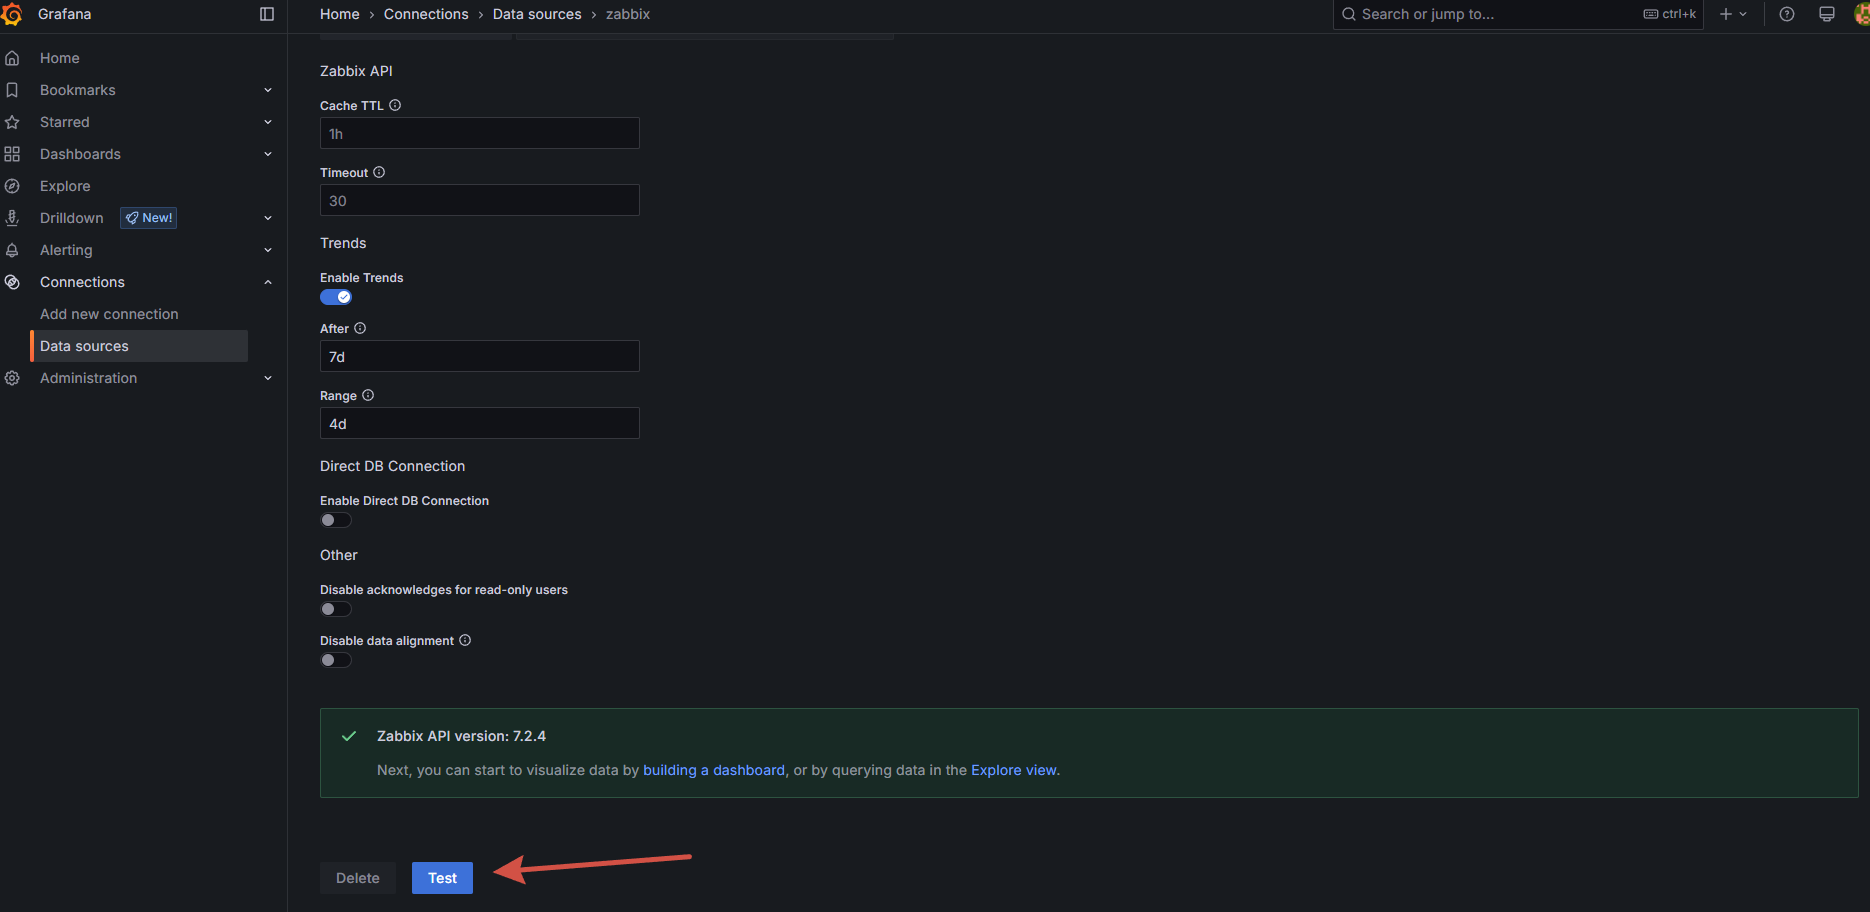
Test Zabbix Data Source
- Go to Connections → Data sources
- Select Zabbix data source
- Click Test button
- Should show "Data source is working"
Troubleshooting
Check Service Logs
# All services
docker compose logs --tail=10 -f
Specific service
docker compose logs -f zabbix-server
docker compose logs -f postgres
Common Issues
1. Zabbix Server Won't Start
# Check database connection
docker compose logs zabbix-server
Restart services in order
docker compose restart postgres
sleep 30
docker compose restart zabbix-server
2. Can't Access Web Interface
# Check if ports are available
netstat -tulpn | grep -E ':(8080|3000|10051|10050)'
Check container status
docker compose ps
3. Grafana Data Source Connection Failed
# Verify Zabbix API is accessible
curl -X POST http://localhost:8080/api_jsonrpc.php \
  -H "Content-Type: application/json" \
  -d '{"jsonrpc":"2.0","method":"apiinfo.version","id":1}'
Performance Tuning
For better performance with large datasets:
# Add to zabbix-server environment in compose.yaml
ZBX_CACHESIZE: "128M"
ZBX_CACHEUPDATEFREQUENCY: "60"
ZBX_STARTDBSYNCERS: "4"
Security Considerations
Production Deployment Checklist
- [ ] Change default passwords in
.env - [ ] Use strong database passwords
- [ ] Restrict access to ports (use firewall/security groups)
- [ ] Enable HTTPS for Zabbix frontend
- [ ] Configure proper backup strategy


