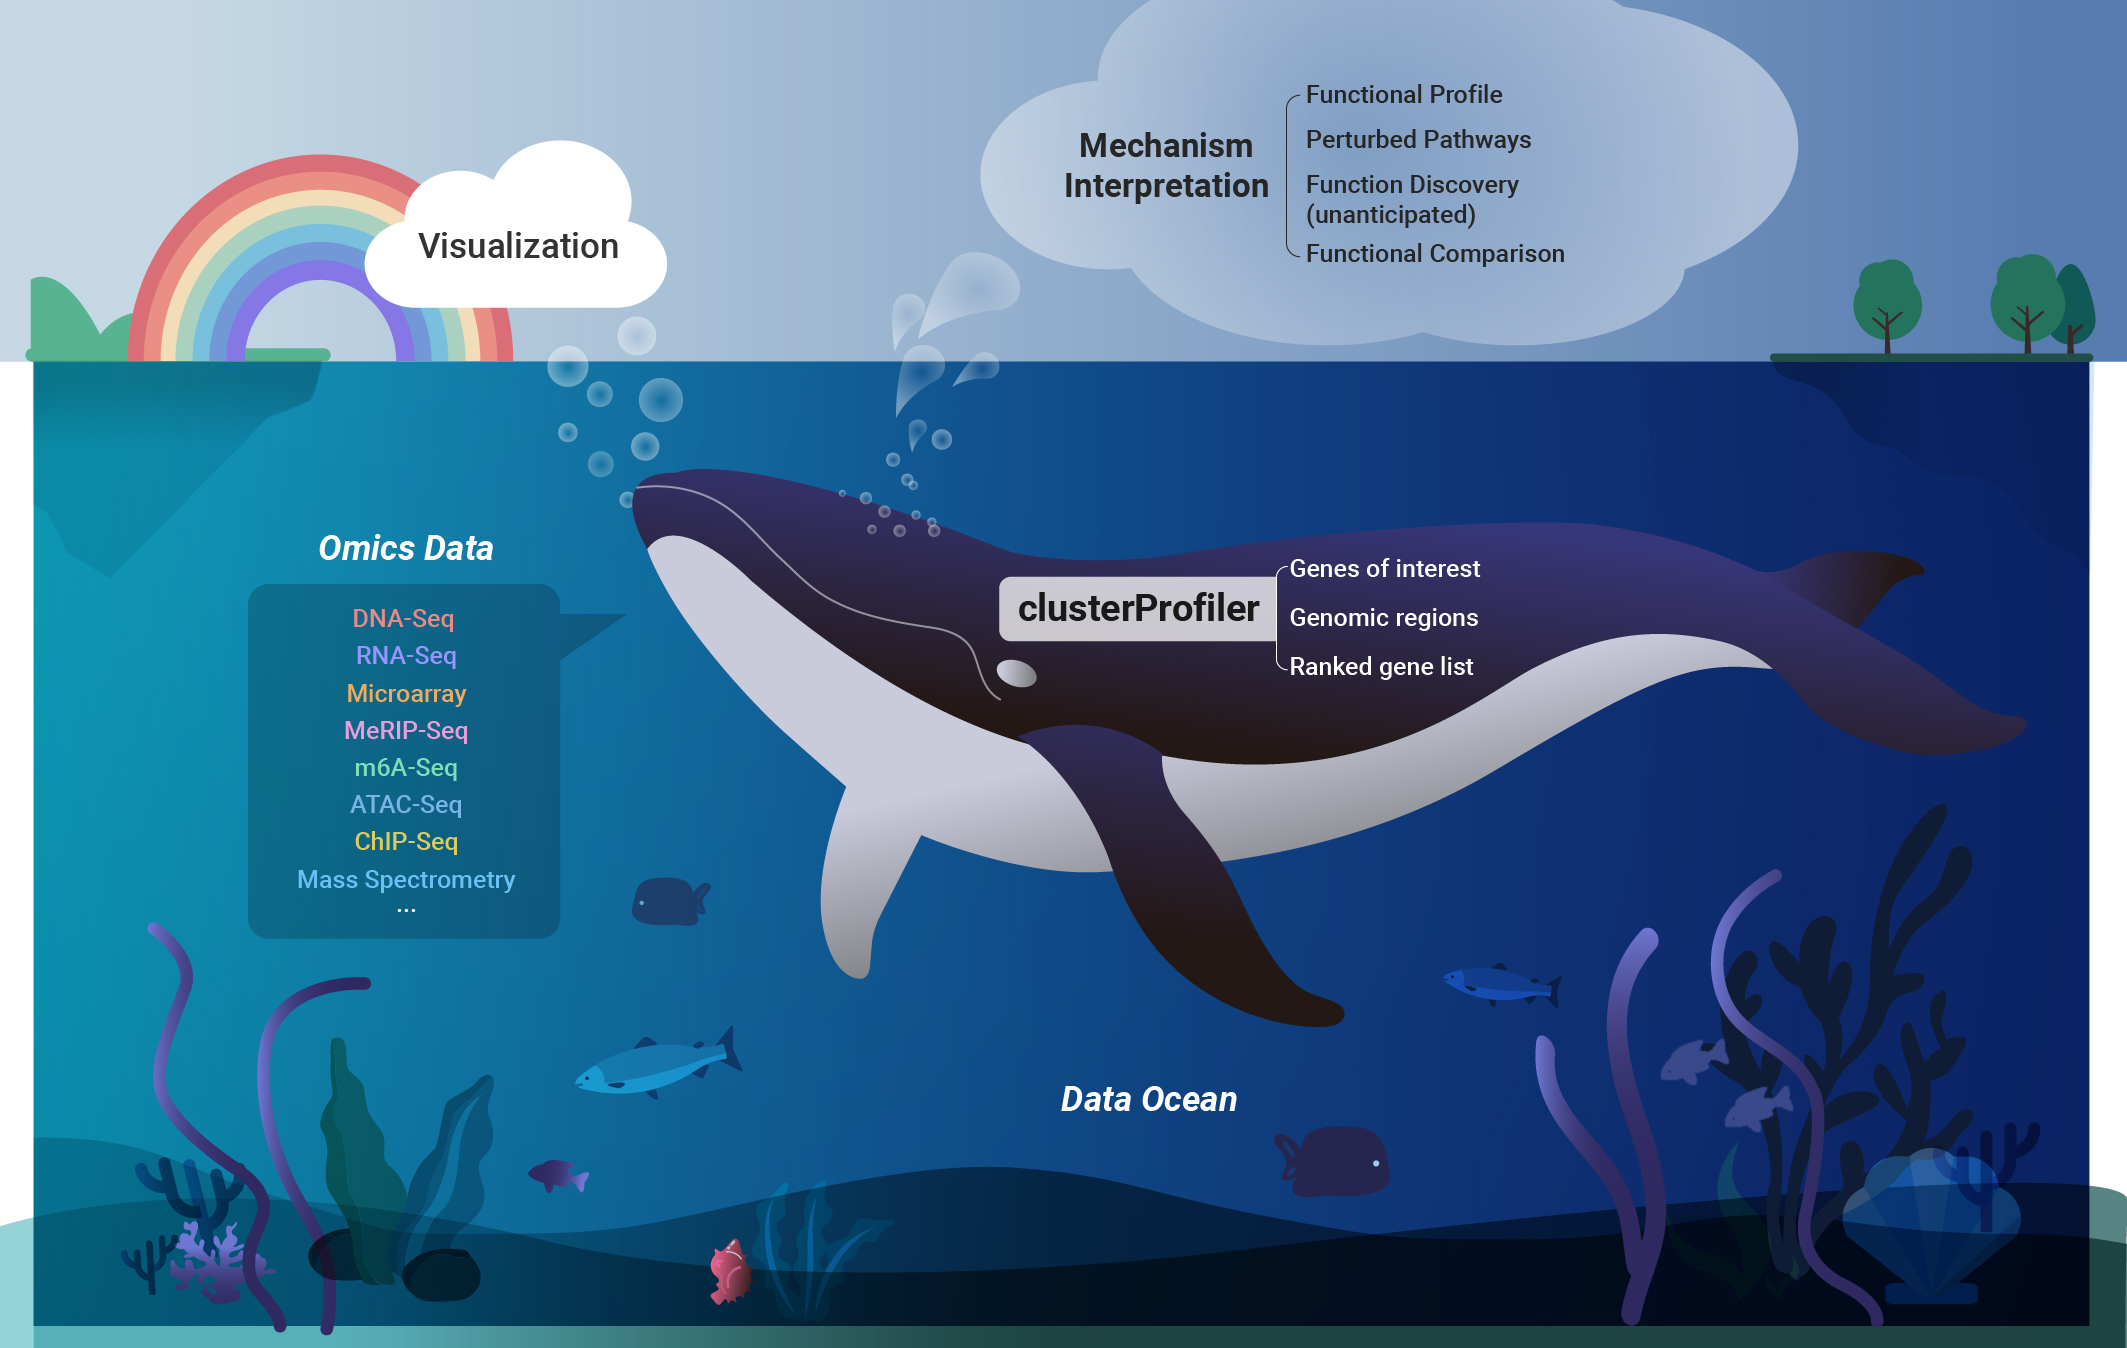
:bar_chart: A universal enrichment tool for interpreting omics data
Last updated Jun 29, 2026
1.2k
Stars
268
Forks
365
Issues
0
Stars/day
Attention Score
77
Language breakdown
R 92.1%
HTML 7.3%
Makefile 0.6%
▸ Files
click to expand
README
clusterProfiler







- It provides a universal interface for gene functional annotation from
- It provides a tidy interface to access, manipulate, and visualize
- Datasets obtained from multiple treatments and time points can be
- It uses
enrichitas the underlying engine for ORA, GSEA, and
For details, please visit:
:writing_hand: Authors
Guangchuang YU
School of Basic Medical Sciences, Southern Medical University