
This repository contains a collection of functions to evaluate investment strategies regarding multiple testing concerns.
Investment Strategy Evaluation
Testing multiple investment strategies until you find one with a high Sharpe Ratio inflates the probability of finding something that looks good by pure chance (Type I error). This repository contains functions for evaluating investment strategies considering multiple testing.
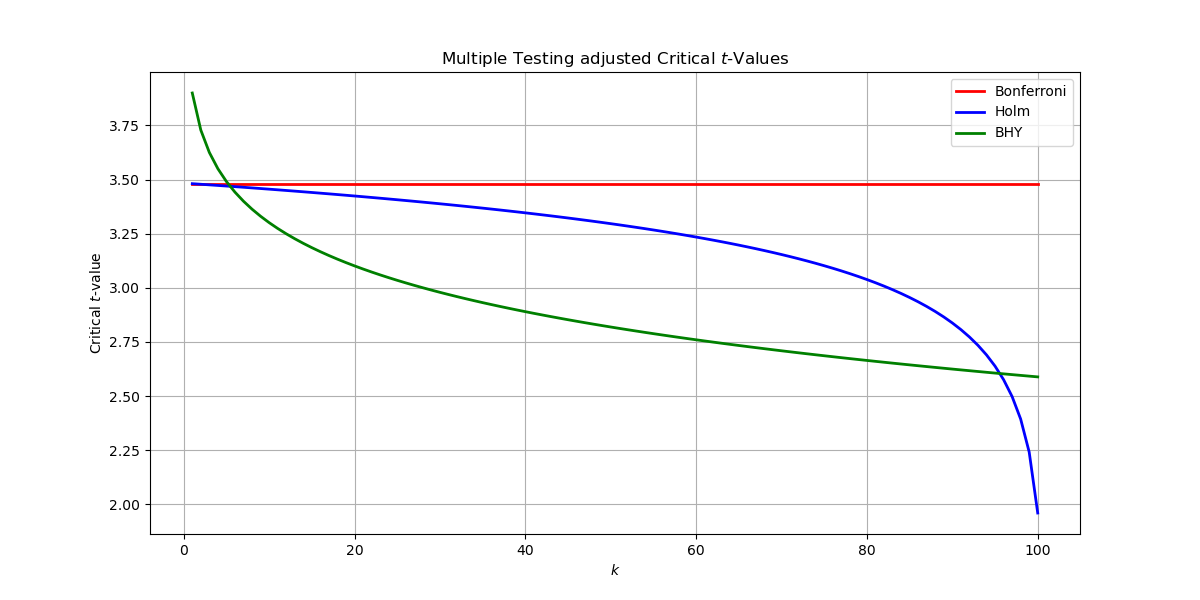
Adjusted critical $t$-values for $m=100$ and $\alpha=.05$
Sharpe Ratio and $t$-Statistic
Sharpe Ratio [sharpe_ratio]
The Sharpe Ratio measures the average return that exceeds the risk-free rate, relative to the volatility of the return. It is a commonly used metric to understand the risk-adjusted return of an investment.
$$ SR = \frac{\mu - r_f}{\sigma} $$
- $\mu$: Mean return
- $r_f$: Risk-free rate
- $\sigma$: Standard deviation of the return
Expected maximum Sharpe Ratio [expectedmaxsharpe_ratio]
When testing $M$ strategies, the expected best Sharpe Ratio $SR_{max}$ can be approximated by
$$ \mathbf{E}[SR{max}] \approx \mathbf{E}[SR{m}] + \sqrt{\mathbf{Var}[SR_{m}]} \left( (1 - \gamma) \Phi^{-1} \left( 1 - \frac{1}{N} \right) + \gamma \Phi^{-1} \left( 1 - \frac{1}{N}e^{-1} \right) \right) $$
- $\Phi$: CDF of the standard normal
- $\gamma$: Euler-Mascheroni constant
- $N$: Number of returns
- $M$: Number of tests
$t$-Statistic [t_statistic]
The $t$-Statistic here refers to the average excess return and is a scaled function of the Sharpe Ratio:
$$ t = \frac{\mu - r_f}{\sigma} \times \sqrt{N} = SR \times \sqrt{N} $$
Multiple Testing Adjustments of critical $t$-values
Bonferroni [bonferronitstatistic]
The Bonferroni Method is a conservative approach for multiple testing correction. It reduces the chance of type I errors (false positives) by dividing the significance level by the number of tests.
$$ t = \Phi^{-1}\left(1 - \frac{\alpha}{2m}\right) $$
- $\alpha$: Significance level
Holm [holmtstatistic]
The Holm Method is a stepwise correction that is less conservative than the Bonferroni Method. It adjusts the $p$-values sequentially, starting from the most significant one, and ensures that the type 1 error rate is maintained across multiple tests.
$$ t_{k} = \Phi^{-1}\left(1 - \frac{\alpha}{2(M + 1 - k)}\right) $$
- $k$: Index of the test sorted by ascending $p$-value
Benjamini-Hochberg-Yekutieli [bhytstatistic]
The BHY Method controls the False Discovery Rate (FDR) and is less conservative than Family-wise Error Rate (FWER) methods like Bonferroni and Holm. FDR is the expected proportion of false discoveries among the rejected hypotheses.
$$ t_{k} = \Phi^{-1}\left(1 - \frac{k \times \alpha}{2m \times \left(\frac{1}{1} + \frac{1}{2} + \cdots + \frac{1}{M}\right)}\right) $$
Strategy Evaluation
Adjusting the Sharpe Ratio [haircutsharperatio]
The Sharpe Ratio is corrected by plugging the corrected $t$-statistic into the rearranged equation to compute the $t$-statistic from the Sharpe Ratio.
$$ SR{cor} = \frac{t{cor}}{\sqrt{N}} $$
Evaluating Investment Strategies [evaluate_strategies]
This function takes a $N \times m$ matrix of returns, where each column belongs to a strategy tested, and outputs a table with the unadjusted and adjusted Sharpe ratios.


